. 2024 Apr 4;31(4):570-581.e7.
doi: 10.1016/j.stem.2024.02.011. Epub 2024 Mar 22.

Autofluorescence is a biomarker of neural stem cell activation state

Affiliations

Autofluorescence is a biomarker of neural stem cell activation state

Christopher S Morrow et al. Cell Stem Cell. .

Abstract

Neural stem cells (NSCs) must exit quiescence to produce neurons; however, our understanding of this process remains constrained by the technical limitations of current technologies. Fluorescence lifetime imaging (FLIM) of autofluorescent metabolic cofactors has been used in other cell types to study shifts in cell states driven by metabolic remodeling that change the optical properties of these endogenous fluorophores. Using this non-destructive, live-cell, and label-free strategy, we found that quiescent NSCs (qNSCs) and activated NSCs (aNSCs) have unique autofluorescence profiles. Specifically, qNSCs display an enrichment of autofluorescence localizing to a subset of lysosomes, which can be used as a graded marker of NSC quiescence to predict cell behavior at single-cell resolution. Coupling autofluorescence imaging with single-cell RNA sequencing, we provide resources revealing transcriptional features linked to deep quiescence and rapid NSC activation. Together, we describe an approach for tracking mouse NSC activation state and expand our understanding of adult neurogenesis.

Keywords: FLIM; NAD(P)H; activation; adult neurogenesis; autofluorescence; fluorescence lifetime imaging; intrinsic fluorescence; lysosomes; neural stem cells; quiescence.


Conflict of interest statement

Declaration of interests The authors declare no competing interests.

Figures

Figure 1 –
Figure 1 –
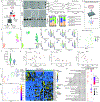
A live-cell, label-free imaging strategy for the classification of NSC activation state. A) Schematic depicting fluorescence lifetime imaging (FLIM) analysis. Data (blue) is modeled by a biexponential decay equation (red). The instrument response function (IRF) is shown in green. B-D) aNSCs and qNSCs were imaged for Ch1 and Ch2 intensities and fluorescence lifetimes. (B) 2-photon intensity images of Ch1 and Ch2 in qNSCs and aNSCs. (C-D) Violin plots depicting intensity and representative FLIM endpoints for Ch1 and Ch2 in qNSCs (blue) and aNSCs (red) (N=3, Generalized Linear Model). E) Principle component analysis of qNSC (red) and aNSC (blue) OCSI data (Ch1 and Ch2 intensity, α1, τ1, and τ2). F) Receiver operating characteristic curve depicting a random forest model generated to classify NSC activation state using NSC autofluorescence data. Different lines represent random forest models constructed using subsets of NSC autofluorescence data. Scale bars, 50 μm. ***p < 0.001.
Figure 2 –
Figure 2 –
Autofluorescence localizing to lysosomes in qNSCs marks NSC activation state. A-E) qNSCs and aNSCs were labeled with Lysotracker and then imaged on a confocal microscope and analyzed for lysosomes (Confocal, green, Ex: 405 nm Em: 525–560 nm) and PAF, and analyzed for the abundance of Lysotracker fluorescence intensity, number of PAF (Confocal; red, Ex: 405 nm Em: 580–620 nm), and %colocalization between PAF and Lysotracker (N=3, Student’s t test, mean ± SD). F-H) aNSCs were treated with either DMSO or 10 μM chloroquine for 2.5 hours, stained with Lysotracker to label lysosomes, and then imaged with a confocal microscope and analyzed for PAF (red) and lysosomes (green) (N=3, Student’s t test, mean ± SD). Nuclei are outlined by a blue dotted line. White line denotes inset. Scale bars, 10 μm (outsets), 1 μm (insets). ****p < 0.0001.
Figure 3 –
Figure 3 –
NSC autofluorescence can enrich for NSC activation state and be used to identify transcriptional signatures of rapid NSC activation. A-D) qNSCs and aNSCs were pulsed with EdU for 1 hour and then prepared for cell sorting either separately or in a 1 aNSC:1 qNSC mixture and then sorted based on relatively low or high PAF intensity (Ex: 405 nm Em: 580–620 nm). 3 hours after plating, cells were fixed, treated to visualize EdU (red) and nuclei (Hoechst; blue) and analyzed for %EdU+ of total Hoechst+ cells (N=3, two-way ANOVA with post hoc Tukey’s test, mean ± SD). E) NAD(P)H (top) and PAF (bottom) 2-photon intensity images of a quiescence exit time course. F-G) Analysis of NAD(P)H and PAF intensity of the quiescence exit time course (n=783 cells). H) PCA of in vitro NSC quiescence exit autofluorescence imaging data (NAD(P)H and PAF intensity, α1, τ1, and τ2). I) Overlay of changes in autofluorescence intensity during the quiescence exit time course combined with the proliferation rate marker (EdU; blue), LC3II (light blue), aggregated proteins (Proteostat; red), vimentin (purple) and lipid droplets (nile red; orange). J) In vitro qNSCs, aNSCs, and qNSCs exiting quiescence for either 24 (qEx 24 hr) or 48 (qEx 48 hr) hours were analyzed by FACS to measure PAF intensity, single-cell sorted, and sent for single-cell RNA sequencing (SORT-seq). K-N) UMAP analysis of in vitro SORT-seq cell transcriptomes labeled by sample condition (K), PAF intensity (L), and predicted cell cycle stage (M). N) Plot comparing PAF intensity to expression of G0 genes in qNSCs exiting quiescence for 48 hours (qEx 48 hr) from in vitro SORT-seq. O) Heat map displaying normalized expression of the top 30 differentially expressed genes when comparing the top 15% to the bottom 15% PAF intensity qEx 48 hr cell transcriptomes from in vitro SORT-seq. P) Dot plot depicting the top 30 gene ontology terms enriched in either the top 15% or bottom 15% PAF qEx 48 hr cell transcriptomes from in vitro SORT-seq. Scale bars, 50 μm. ****p < 0.0001.
Figure 4 –
Figure 4 –
PAF is a graded marker of deep quiescence in vivo. A) Schematic depicting FACS strategy for splitting “All Cells” or “NSC-Enriched” samples into subsets separated by PAF intensity for downstream analyses. Briefly, NSCs were dissociated from the SVZ, then either 1) all cells (All Cells) or 2) CD133+, CD24−, O4− cells (NSC Enriched) were sorted by FACS to isolate cells from each sample collectively that had higher or lower PAF intensity. The resulting samples were analyzed downstream by timelapse imaging and assays to resolve proliferation rate and differentiation. B) Example bright field timelapse images showing time to first mitosis of representative cells from the “All Cells” isolation. C-D) Plots of Low, Mid and High PAF Intensity cells from either the “All Cells” or “NSC-Enriched” isolations showing the fraction of cells which divided ≥3 times and/or took ≥36 hours to reach first mitosis (D) or time to first mitosis (C) (n=206 cells (All Cells) and 128 cells (NSC-Enriched; Student’s t-test (NSC-Enriched), two-way ANOVA with post hoc Tukey’s test (All Cells)). E) Schematic depicting strategy for enriching for NSCs isolated from the SVZ, tracking PAF intensity by FACS, and sending for SORT-Seq. F) UMAP analysis of in vivo SORT-seq transcriptomes labeled by clusters identified using the Louvain method. G) UMAP analysis of single cell transcriptomes from cells isolated from the SVZ as described in Fig. 4E with PAF intensity annotated. H) UMAP analysis of single cell transcriptomes from cells isolated from the SVZ as described in Fig. 4E with expression of markers of different cell types and cell states annotated. I) UMAP analysis of single cell transcriptomes of NSC harboring clusters (clusters 3 and 4) isolated from the SVZ as described in Fig. 4E with PAF intensity annotated. J) PAF Intensity of cells in cluster 3 (qNSCs) and 4 (aNSCs) from in vivo SORT-seq (n=36 cells, Student’s t test). K) Plots of Hopx, Egfr and Mki67 expression as a function of PAF intensity, excluding cells with an expression of 0 for each gene respectively from in vivo SORT-seq. Trend lines are shown in red. L-M) UMAP analysis of NSC transcriptomes reported in Llorens-Bobadilla et al (circles) overlayed with NSCs from clusters 3 and 4 produced by this study and PAF intensity (plus symbols; in vivo SORT-seq). N) Heat map showing normalized expression of the top 30 most differentially expressed genes comparing the top third to the bottom third PAF intensity of qNSCs (cluster 3) from in vivo SORT-seq. O) Dot plot depicting the top 30 gene ontology terms enriched in either the top third or bottom third PAF intensity qNSCs (cluster 3) from in vivo SORT-seq. Scale bars, 20 μm. *p < 0.05. ***p < 0.001, ****p < 0.0001.

References

    1. Goncalves JT, Schafer ST, and Gage FH (2016). Adult Neurogenesis in the Hippocampus: From Stem Cells to Behavior. Cell 167, 897–914. 10.1016/j.cell.2016.10.021. - DOI - PubMed
    1. Kalamakis G, Brune D, Ravichandran S, Bolz J, Fan W, Ziebell F, Stiehl T, Catala-Martinez F, Kupke J, Zhao S, et al. (2019). Quiescence Modulates Stem Cell Maintenance and Regenerative Capacity in the Aging Brain. Cell 176, 1407–1419 e1414. 10.1016/j.cell.2019.01.040. - DOI - PubMed
    1. Lugert S, Basak O, Knuckles P, Haussler U, Fabel K, Gotz M, Haas CA, Kempermann G, Taylor V, and Giachino C (2010). Quiescent and active hippocampal neural stem cells with distinct morphologies respond selectively to physiological and pathological stimuli and aging. Cell Stem Cell 6, 445–456. 10.1016/j.stem.2010.03.017. - DOI - PubMed
    1. Ibrayeva A, Bay M, Pu E, Jorg DJ, Peng L, Jun H, Zhang N, Aaron D, Lin C, Resler G, et al. (2021). Early stem cell aging in the mature brain. Cell Stem Cell. 10.1016/j.stem.2021.03.018. - DOI - PMC - PubMed
    1. Harris L, Rigo P, Stiehl T, Gaber ZB, Austin SHL, Masdeu MDM, Edwards A, Urban N, Marciniak-Czochra A, and Guillemot F (2021). Coordinated changes in cellular behavior ensure the lifelong maintenance of the hippocampal stem cell population. Cell Stem Cell 28, 863–876 e866. 10.1016/j.stem.2021.01.003. - DOI - PMC - PubMed