. 2024 Apr 18;84(8):1475-1495.e18.
doi: 10.1016/j.molcel.2024.02.032. Epub 2024 Mar 22.

Transcription elongation defects link oncogenic SF3B1 mutations to targetable alterations in chromatin landscape

Affiliations

Transcription elongation defects link oncogenic SF3B1 mutations to targetable alterations in chromatin landscape

Prajwal C Boddu et al. Mol Cell. .

Abstract

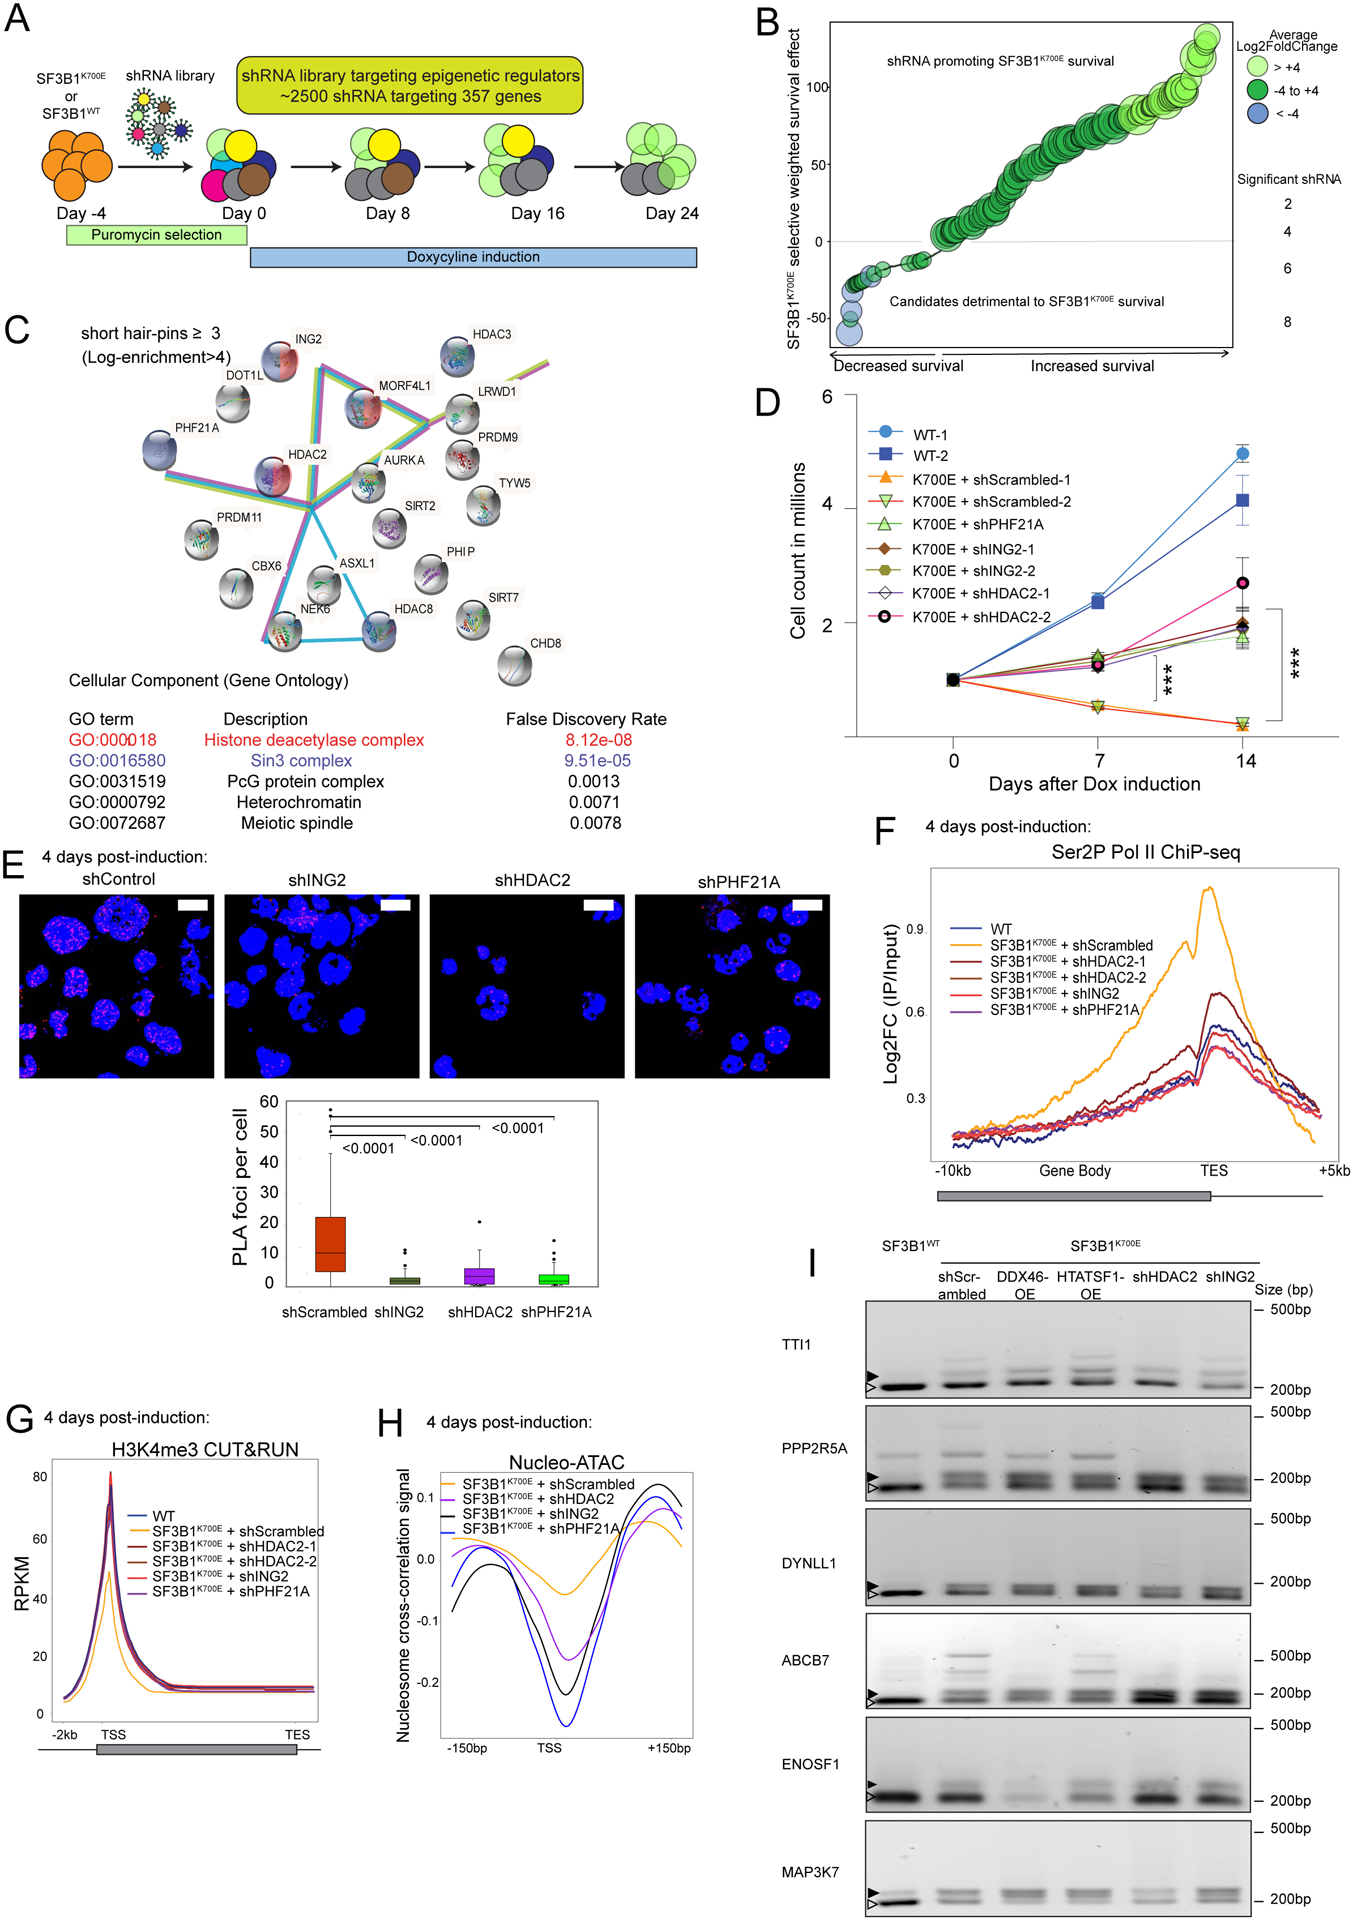
Transcription and splicing of pre-messenger RNA are closely coordinated, but how this functional coupling is disrupted in human diseases remains unexplored. Using isogenic cell lines, patient samples, and a mutant mouse model, we investigated how cancer-associated mutations in SF3B1 alter transcription. We found that these mutations reduce the elongation rate of RNA polymerase II (RNAPII) along gene bodies and its density at promoters. The elongation defect results from disrupted pre-spliceosome assembly due to impaired protein-protein interactions of mutant SF3B1. The decreased promoter-proximal RNAPII density reduces both chromatin accessibility and H3K4me3 marks at promoters. Through an unbiased screen, we identified epigenetic factors in the Sin3/HDAC/H3K4me pathway, which, when modulated, reverse both transcription and chromatin changes. Our findings reveal how splicing factor mutant states behave functionally as epigenetic disorders through impaired transcription-related changes to the chromatin landscape. We also present a rationale for targeting the Sin3/HDAC complex as a therapeutic strategy.

Keywords: DNA damage response; R-loops; RNA polymerase II; SF3B1; Sin3/HDAC; U2AF1; WDR5; co-transcriptional splicing; spliceosome; transcription.


Conflict of interest statement

Declaration of interests Amit Verma has received research funding from Prelude, B.M.S., G.S.K., Incyte, Medpacto, Curis, and Eli Lilly; is a scientific advisor for Stelexis, Bakx, Novartis, Acceleron, and Celgene; receives honoraria from Stelexis and Janssen; and holds equity in Stelexis and Bakx.

Figures

Figure 1:
Figure 1:. Genome-wide analysis of RNAPII redistribution in SF3B1K700E
(A) Inducible SF3B1-mutant cells show near-total recombination by cDNA sequencing post-Cre induction at 4 days (B) ChIP-seq metagene-plot of RNAPII NTD show log2 fold change in 6694 highly expressed genes between SF3B1WT and SF3B1K700E (n=2, each), with variability illustrated by shaded areas. Read densities calculated as RPKM. TSS-transcription start site, TES-transcription end site. (C) Genome browser tracks of RNAPII NTD ChIP-seq comparing SF3B1WT/SF3B1K700E read densities. (D) Traveling-ratio (TR) of promoter/gene-body read density ratio in SF3B1WT versus SF3B1K700E, statistically determined using two-sample-K.S. test. (E) Metagene plot of Ser5P RNAPII ChIP-seq metagene plot similar to (B) (n=1, each). (F) Metagene-plot of Ser2P RNAPII ChIP-seq, as in (B) (n=2, each) (G) Heat maps show (Δ)RNAPII NTD and (Δ)Ser2PRNAPII CTD in K562 cells. in three clusters upon SF3B1K700E expression (H) CDF plot of TR distribution in SF3B1WT /SF3B1K700E cells correlates with intron number (I) Heatmap with static binning displays SF3B1K700E/ SF3B1WT RNAPII NTD ChIP-seq ratios across gene lengths (J) Averaged SF3B1K700E/SF3B1WT RNAPII NTD density ratio at the first exon-intron junction (total 5118 gene isoforms with at least one intron).
Figure 2:
Figure 2:. SF3B1K700E-induced RNAPII nascent transcription changes
(A) GRO-seq metaplot densities in SF3B1WT and SF3B1K700E (n=2 each). (B) GRO-seq browser tracks illustrating transcription changes (C) GRO-seq’s TR calculated as in Fig 1D. (D) GRO-seq reads compare intron/exon coverage in SF3B1WT versus SF3B1K700E. Coverage normalized to the −100bp position of 5’SS (for introns) or to 5’ start (for exons). (E) Genome browser tracks of TT-TL seq post-spike-in normalization. Reads categorized by U-to-C mutations. (F) Metaplot shows RPKM normalized TT-TL-seq RPKM densities scaled to Drosophila-spike in SF3B1WT and SF3B1K700E (n=2, each). (G) Log2 elongation index (EI) difference [SF3B1K700E - SF3B1WT] plotted against %GC in genes, analyzed. (H) Boxplot correlates EI in introns with %GC, assessed by Mann-Whitney-U test.
Figure 3:
Figure 3:. Mechanisms underlying SF3B1K700E-induced transcription elongation defects
(A) Median 3’end RNAPII position from LRS reads, indicating elongation defect in SF3B1K700E. (B) CoSE of introns showing splicing efficiency differences. Significance determined by Mann-Whitney-U. (C) Spliced/total read ratio in GRO-seq in 5118 transcript isoforms. (D) Immunoblots of chromatin-associated FLAG-SF3B1 bound proteins. Intensities obtained using ImageJ. ***(p-value<0.001), ns(p-value>0.05) (E) Spliceosome assembly kinetics by native gel, quantifying E/A complex shifts in HEK293T (SF3B1WT and SF3B1K700E) nuclear extracts. (F) Metaplots of RNAPII Ser2P ChIP-seq in SF3B1K700E and SF3B1WT expressing inducible shRNA (G) Traveling Ratio of RNAPII NTD ChIP-seq comparing clusters, in SF3B1WT cells transfected with DDX46/HTATSF1 siRNA (H) Rescue of HTATSF1/DDX46 overexpressed cells (SF3B1WT/SF3B1K700E). OE:over-expression (I) In vitro RNAPII release assay for HA-tagged RNAPII elution, quantified by ImageJ. (J) Metaplot of Ser2P RNAPII mNET-seq as in Fig1B (n=1, each) (K) mNET-seq density distributions across 5’SS, branchpoint (BP), and 3’SS. (L) Model depicting SF3B1K700E-hindering E-to-B spliceosome transition, blocking RNAPII release. (M) ARTDeco analysis of GRO-seq showing unchanged read-through and read-in transcription.
Figure 4:
Figure 4:. SF3B1K700E’s effects on R-loops and replication dynamics
(A) Nuclear S9.6 intensity in SF3B1WT/SF3B1K700E, and SF3B1K700E+RNH1OE cells, analyzed using Student’s t-test. Scale-bar, 2μm. a.u: arbitrary units. (B) RNAPII NTD+PCNA PLA foci quantified in cells, treated as in (A); significance by Mann-Whitney-U (C) Epistatic effects between SF3B1K700E and R-loop resolvers examined, showing differential PLA foci (left) and γH2AX intensity (right). Scale-bar, 17 μm. (Significance by Mann-Whitney-U and Student’s t-test, respectively) (D) Cell-cycle phases in K562 cells assessed via flow cytometry. Significance by ANOVA (E) Fork velocity measured in cells, treated as in (A). Significance by Mann-Whitney-U). (F) Percentage of EdU+ cells (Left) and EdU intensity (Right) in cells, as in (A). Significance by Student’s t-test and Mann–Whitney-U, respectively. (G) DRIP-seq metaplot shows S9.6 signal distribution along genes in SF3B1WT/SF3B1K700E (n=2, each), with TTS intensity differences by Wilcoxon test with continuity correction (H) DRIP-seq metaplot based on gene-clusters in Fig1G. (I) Metaplot for convergent gene/gene pairs, as in Fig4G. (J) Count of head-on versus co-directional transcription-replication conflict zones intersecting SF3B1K700E-specific R-loop peaks. (K) DRIP-seq coverage at SF3B1K700E-specific R-loop peaks intersected by the replication fork in CD versus HO orientation. (Mann-Whitney-U, two-tailed, ***P<0.0001).
Figure 5:
Figure 5:. SF3B1K700E-induced changes to chromatin accessibility and histone modifications
(A) Spike-in scaled mNET-seq of RNAPII CTD (n=2, each). (B) CDK9 ChIP-seq metagene analysis comparing SF3B1WT/SF3B1K700E (n=2, each). (C) INTS11 ChIP-seq RPKM densities of SF3B1WT/SF3B1K700E (n=1, each) (D) Nucleo-ATAC metaplot at promoter showing nucleosome occupancy changes (E) Volcano plot of ATAC-seq peaks in SFB1K700E vs. SF3B1WT (n=2, each). (F) Colocalization analysis of downregulated ATAC-seq peaks (SF3B1K700E) and differential R-loops (SF3B1K700E vs. SF3B1WT). (G) H3K4me3 CUT&RUN metaplot in SF3B1WT/SF3B1K700E (n=2, each). (H) Genome-browser tracks of H3K4me3 in SF3B1WT/SF3B1K700E. (I) Heatmaps of differences in RNAPII NTD ChIP-seq and H3K4me3 CUT&RUN, by gene-clusters. (J) CHD1 ChIP-seq in SF3B1WT/SF3B1K700E (n=1, each) (K) H3K36me3 ChIP-seq in SF3B1WT/SF3B1K700E (n=1, each) (L) GRO-seq metaplots and heatmaps displaying sense transcription at promoters and putative enhancers in SF3B1WT/SF3B1K700E. (M) ChromHMM defining 14 chromatin states from combinatorial epigenetic signatures, with candidate state annotations. (N) Enrichment of chromatin state transitions at gene promoters analyzed, highlighting differentially regulated genes. −Log-fold change values listed in each box (also see FigS11).
Figure 6:
Figure 6:. shRNA screen identifying key epigenetic pathways in SF3B1K700E-induced growth arrest
(A) shRNA screen for epigenetic/chromatin modifiers altering SF3B1K700E sensitivity. (B) Waterfall plot of survival effects of specific genes. (C) StringDB analysis showing enrichment for Sin3/HDAC complex genes from screen. (D) Cell growth effects of different shRNAs in SF3B1WT and SF3B1K700E. (E) RNAPII NTD+PCNA PLA foci quantification in SF3B1K700E with different shRNAs. Significance by Mann-Whitney-U. Scale-bar: 17 μm. (F) Ser2PRNAPII ChIP-seq Metagene plots for conditions as in (E). (G) H3K4me3 CUT&RUN Metagene plots as in (E). (H) NucleoATAC-inferred nucleosome occupancy as in (E). (I) RT-PCR of cryptic (black arrowheads) and canonical (hollow arrowheads) 3’SSs of six select genes in SF3B1WT or specific conditions with SF3B1K700E.
Figure 7:
Figure 7:. Sin3/HDAC/H3K4me pathway in SF3B1-mutant MDS.
(A) Workflow for isolation/characterization of SF3B1-mutant MDS CD34+ cells. (B) CUT&RUN metagene plots of Ser2P RNAPII in SF3B1-mutant and control CD34+ cells, with TR avrages in inset. (C) Representative genome browser tracks for data in (B). (D) CUT&RUN metagene and box-whisker plots of H3K4me3 density for SF3B1-mutant MDS and control CD34+ cells. (E) Representative genome browser tracks for data in (D). (F) Nucleo-ATAC metaplot of nucleosome occupancy in SF3B1-mutant MDS and control CD34+ cells. (G) Methylcellulose CFU assay contrasting SF3B1-mutant MDS and control CD34+ cells post OICR-9429. Significance determined using one-tailed Student’s t-test. (H) CFU assay with shRNA-mediated knockdowns of ING2 and HDAC2 in SF3B1-mutant MDS. (I) ChIP-seq of pan-, Ser5P-, and Ser2P- RNAPII CTD in lineage negative populations of mouse cells (Sf3b+/K700E/Sf3b1+/+). (J) Scheme for sorting LSK for CFU and ATAC-seq assays (K) CFU assays in murine LSK cells with specific shRNA knockdowns (Statistics by one-tailed Student’s t-test).

Update of

References

    1. Reimer KA, Mimoso CA, Adelman K, and Neugebauer KM (2021). Co-transcriptional splicing regulates 3′ end cleavage during mammalian erythropoiesis. Molecular Cell 81, 998–1012.e7. 10.1016/j.molcel.2020.12.018. - DOI - PMC - PubMed
    1. Zhang S, Aibara S, Vos SM, Agafonov DE, Lührmann R, and Cramer P (2021). Structure of a transcribing RNA polymerase II–U1snRNP complex. Science 371, 305–309. 10.1126/science.abf1870. - DOI - PubMed
    1. Herzel L, Ottoz DSM, Alpert T, and Neugebauer KM (2017). Splicing and transcription touch base: co-transcriptional spliceosome assembly and function. Nat Rev Mol Cell Biol 18, 637–650. 10.1038/nrm.2017.63. - DOI - PMC - PubMed
    1. Caizzi L, Monteiro-Martins S, Schwalb B, Lysakovskaia K, Schmitzova J, Sawicka A, Chen Y, Lidschreiber M, and Cramer P (2021). Efficient RNA polymerase II pause release requires U2snRNP function. Mol Cell 81, 1920–1934.e9. 10.1016/j.molcel.2021.02.016. - DOI - PubMed
    1. Hluchý M, Gajdušková P, Ruiz de los Mozos I, Rájecký M, Kluge M, Berger B-T, Slabá Z, Potěšil D, Weiß E, Ule J, et al. (2022). CDK11 regulates pre-mRNA splicing by phosphorylation of SF3B1. Nature 609, 829–834. 10.1038/s41586-022-05204-z. - DOI - PubMed