. 2025 Mar:69:181-196.
doi: 10.1016/j.jare.2024.03.012. Epub 2024 Mar 22.

Preparation of human astrocytes with potent therapeutic functions from human pluripotent stem cells using ventral midbrain patterning

Affiliations

Preparation of human astrocytes with potent therapeutic functions from human pluripotent stem cells using ventral midbrain patterning

Ye Rim Nam et al. J Adv Res. 2025 Mar.

Abstract

Introduction: Astrocytes are glial-type cells that protect neurons from toxic insults and support neuronal functions and metabolism in a healthy brain. Leveraging these physiological functions, transplantation of astrocytes or their derivatives has emerged as a potential therapeutic approach for neurodegenerative disorders.

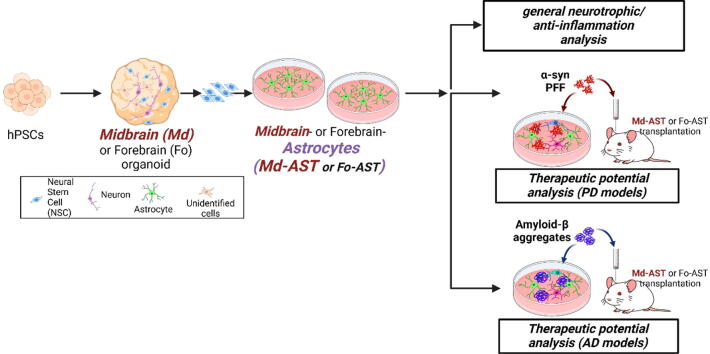
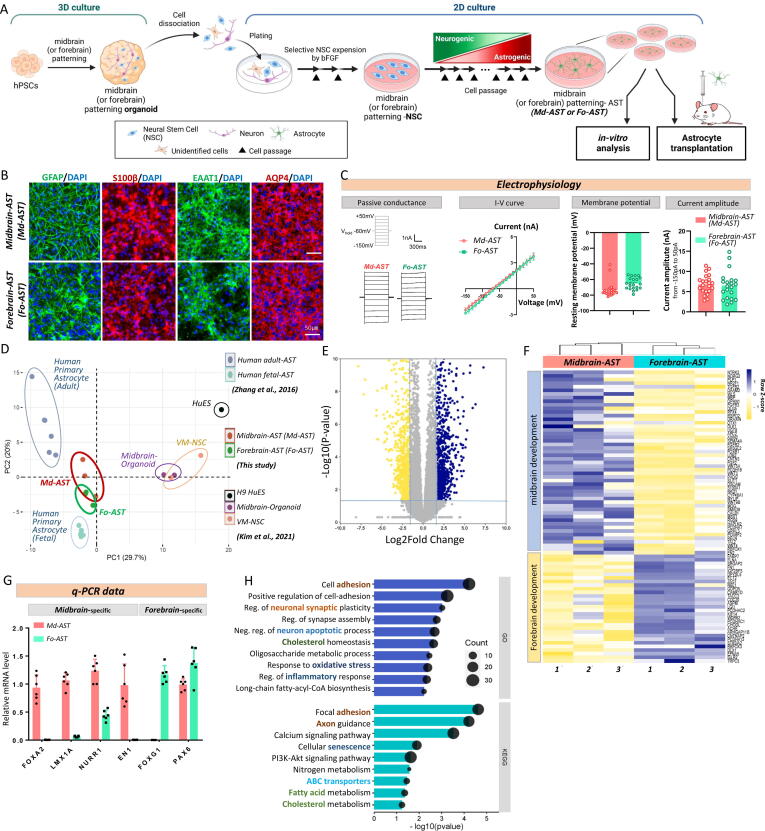
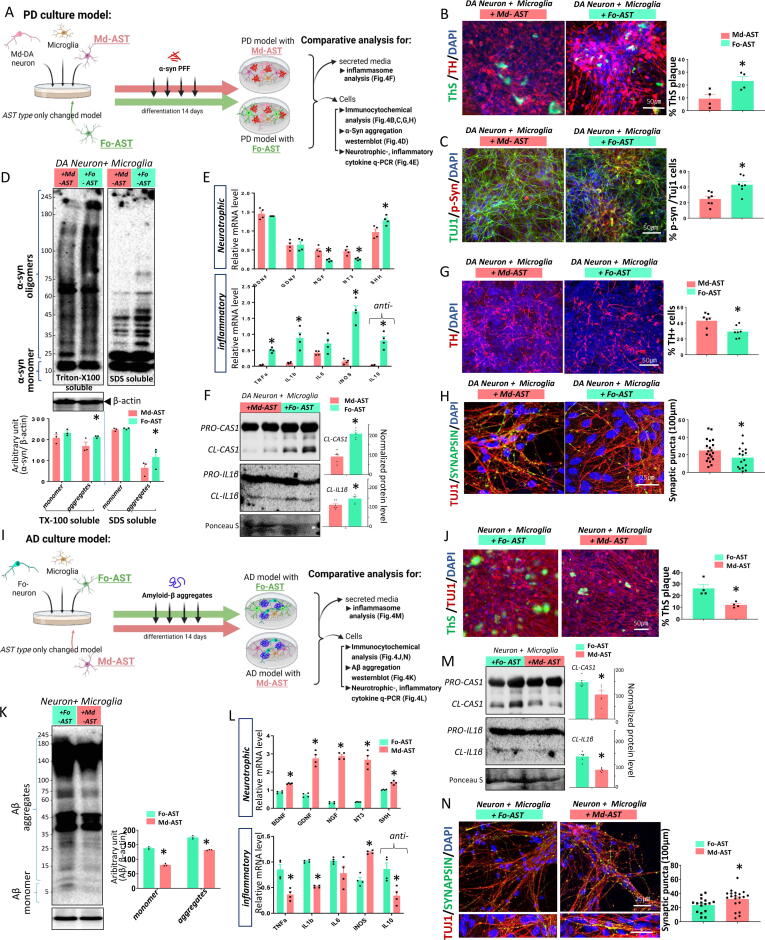
Methods: To substantiate the clinical application of astrocyte-based therapy, we aimed to prepare human astrocytes with potent therapeutic capacities from human pluripotent stem cells (hPSCs). To that end, we used ventral midbrain patterning during the differentiation of hPSCs into astrocytes, based on the roles of midbrain-specific factors in potentiating glial neurotrophic/anti-inflammatory activity. To assess the therapeutic effects of human midbrain-type astrocytes, we transplanted them into mouse models of Parkinson's disease (PD) and Alzheimer's disease (AD).

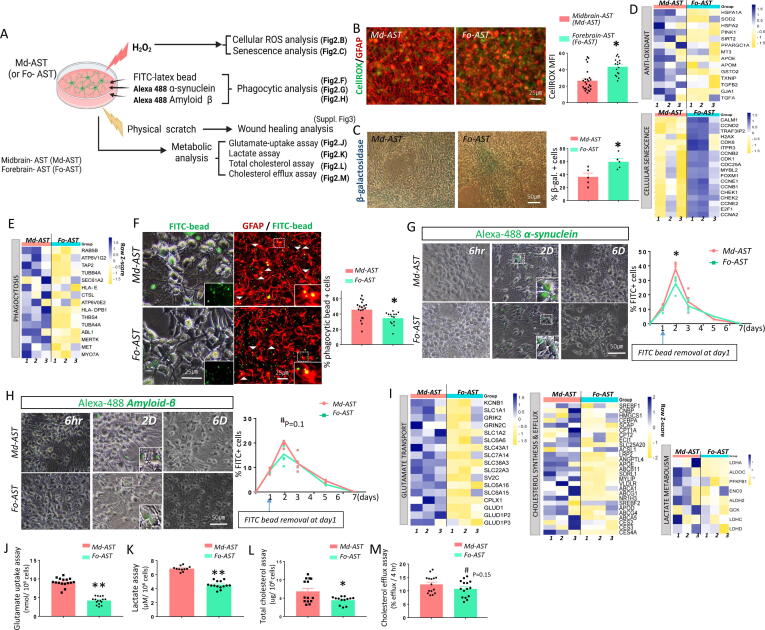
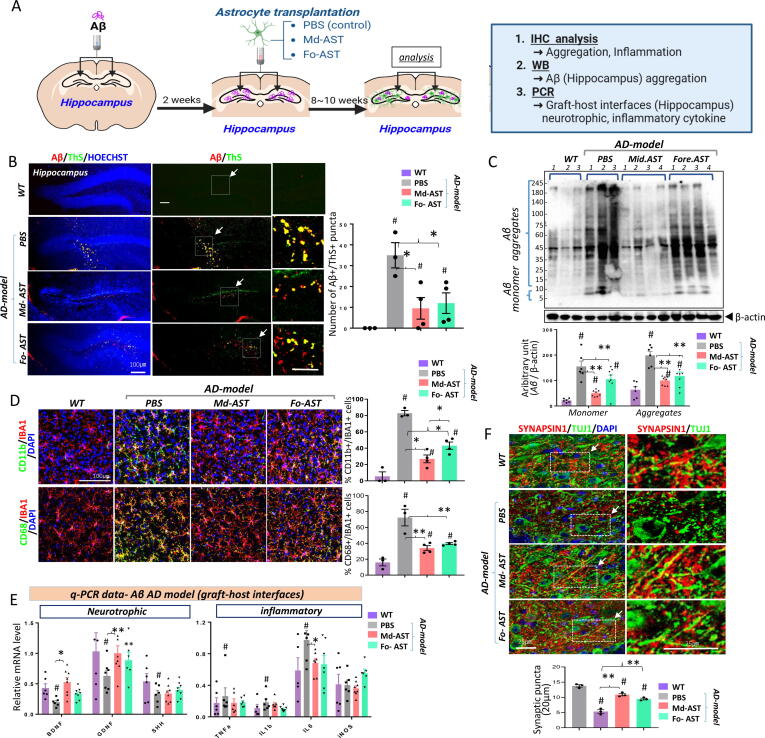
Results: Through a comprehensive series of in-vitro and in-vivo experiments, we were able to establish that the midbrain-type astrocytes exhibited the abilities to effectively combat oxidative stress, counter excitotoxic glutamate, and manage pathological protein aggregates. Our strategy for preparing midbrain-type astrocytes yielded promising results, demonstrating the strong therapeutic potential of these cells in various neurotoxic contexts. Particularly noteworthy is their efficacy in PD and AD-specific proteopathic conditions, in which the midbrain-type astrocytes outperformed forebrain-type astrocytes derived by the same organoid-based method.

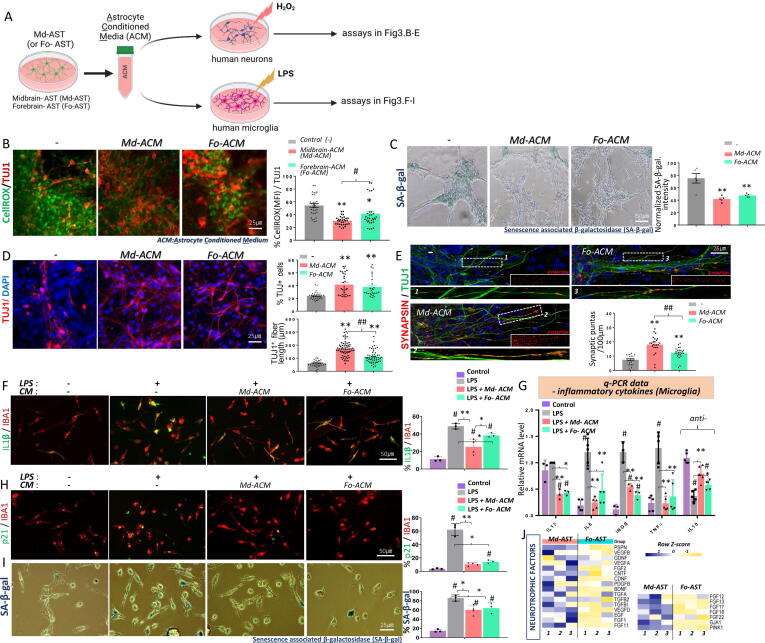
Conclusion: The enhanced functions of the midbrain-type astrocytes extended to their ability to release signaling molecules that inhibited neuronal deterioration and senescence while steering microglial cells away from a pro-inflammatory state. This success was evident in both in-vitro studies using human cells and in-vivo experiments conducted in mouse models of PD and AD. In the end, our human midbrain-type astrocytes demonstrated remarkable effectiveness in alleviating neurodegeneration, neuroinflammation, and the pathologies associated with the accumulation of α-synuclein and Amyloid β proteins.

Keywords: Alzheimer’s disease; Amyloid β; Astrocyte; Parkinson’s disease; Transplantation; α-synuclein.


Conflict of interest statement

Declaration of competing interest The authors declare that they have no known competing financial interests or personal relationships that could have appeared to influence the work reported in this paper.

Figures

None
Graphical abstract
Fig. 1
Fig. 1
Generation of astrocytes from human pluripotent stem cell (hPSC)-derived midbrain (Md)- and forebrain (Fo)-like organoids. (A) Schematic depicting the process of differentiating the Md and Fo organoid–based astrocytes. Human ESCs were induced to form region-specific Md- or Fo-patterned 3D organoids, followed by organoid dissociation and 2D plating. Neural stem cells (NSCs) from Md-like or Fo-like organoids were expanded through multiple passages (∼passage 15; ∼130 days) with basic fibroblast growth factor (bFGF). Detailed cytokine combinations are provided in Supplementary Information S1A. (B) Representative image of hPSC-derived regional astrocytes stained for astrocyte-specific markers (GFAP, AQP4, S100β, EAAT1). Scale bars are 50 μm. (C) Representative current traces of passive conductance (left) from −150 mV to 50 mV, recorded from Md- and Fo-derived astrocytes. Averaged traces of the I-V curve. Average resting membrane potential (mV) and current amplitude (pA) from −150 mV to 50 mV (right bar graphs). n = 3 biological replicates, 21–22 total cells per region patched. (D) Principle component analysis (PCA) of RNA-seq data from regional-patterned astrocytes (this study), human fetal- or adult-astrocytes , and hPSC Md-organoid NSCs (22). PCA scores were calculated using genes associated with astrocyte identity . (E) Volcano plot showing the differentially expressed genes (DEGs) between the Md- and Fo-astrocytes. The plot displays the fold-change (x-axis) versus the significance (y-axis) of the genes identified in the RNA-seq data. The significance (p-value) and fold-change were converted to − Log10 and Log2, respectively. The vertical and horizontal dotted lines indicate the cut-off values for a fold-change >±3 and a p-value < 0.05, respectively. Blue dots are the genes increased in Md-astrocytes, and yellow dots are the downregulated genes. (F) Heatmap showing representative genes associated with Md and Fo development in Md- and Fo-astrocytes (n = 3 biological replicates; Supplementary Table S1). (G) Quantitative PCR analysis of genes associated with midbrain (FOXA2, LMX1A, NURR1, EN1) and forebrain (FOXG1, PAX6) development from Md-astrocytes (Md-AST) and Fo-astrocytes (Fo-AST). (H) Gene Ontology (blue bars) and KEGG pathway (green bars) analyses of the DEGs shown in (E). Significance at p < 0.05 with a DEG fold-change > 3. (For interpretation of the references to colour in this figure legend, the reader is referred to the web version of this article.)
Fig. 2
Fig. 2
Midbrain (Md)-astrocytes have cell-autonomous functions to rescue toxic environments and support neuronal glucose and cholesterol metabolism to provide resistance against stressful conditions. (A) Schematic overview of the experimental procedure. (B–C) Md-astrocytes (Md-AST) and forebrain-astrocytes (Fo-AST) were exposed to H2O2 (250 μM) for 6 hr. Cellular ROS levels (B) were quantified by the intensity of CellROX staining, and cellular senescence (C) was estimated by quantifying the percentage of β-galactosidase (β-gal) + cells using the β-gal assay. Data are represented as the mean ± SEM. n = 4 culture coverslips. Scale bars are 25 or 50 μm. (D) Heatmaps displaying the expression of genes associated with anti-oxidation and cellular senescence in the RNA-seq data (Md-AST vs. Fo-AST). (E) Heatmap illustrating the upregulation of phagocytosis-related genes in Md-AST. (F–H) Phagocytic potential of cultured Md-AST. (F) General phagocytic activity was assessed using fluorescent latex beads (F-13081). Cultured astrocytes were incubated with the latex beads for 90 min and washed, and then the percentage of cells engulfing beads was quantified. Phagocytic clearance of α-syn (G) and amyloid β (Aβ) (H). Astrocytes were incubated with Alexa 488 labeled α-syn or Alexa 488-labeled Aβ for 1 day. The percentage of cells containing Alexa 488 was monitored for 6 days after withdrawal of the fluorescence-labeled α-syn or Aβ. Significant differences from Fo-AST are indicated at *P < 0.05, #P = 0.1. n = 4. One-way ANOVA. Scale bars are 25 or 50 μm. (I) Heatmaps showing gene expression from Md-AST and Fo-AST related to lactate metabolism, glutamate transport, and cholesterol synthesis & efflux. (J–M) Metabolic potentials were analyzed in Md-AST and Fo-AST. Md-AST released higher levels of lactate and cholesterol into the extracellular space and took up more glutamate. For the glutamate uptake assay (J) and total cholesterol assay (L), normally cultured Md-AST and Fo-AST were used. The lactate (K) and cholesterol efflux (M) assays were performed using astrocyte-conditioned media. Significant differences between the astrocyte groups p < 0.05*, 0.0001**, p = 0.15#. t-test (B,C,F,J-M). Data are presented as the mean ± SEM. n = 3–5 independent experiments in duplicate or triplicate.
Fig. 3
Fig. 3
Factors secreted from midbrain (Md)-astrocytes protect neurons against toxic stimuli and prevent pathologic microglial polarization. (A) Schematic overview of the experimental procedure. To investigate paracrine effects, medium was conditioned in Md or forebrain-astrocyte (Md-AST or Fo-AST) culture for 10 days (collecting media every other day). The conditioned media (Md-ACM and Fo-ACM) were then added to neurons treated with H2O2 (250 μM for 6 hr) and cultured for 6 days (B–E) or to microglia treated with LPS (250 ng/mL) and cultured for 48 hr (F–I). (B–C) Paracrine astrocytic functions in protecting cellular ROS levels (B) and preventing cellular senescence (C) in neurons were analyzed. Scale bars are 25–50 μm. (D) Neuronal cell maintenance was quantified by counting the percentage of Tuj1 + cells and neuronal fiber. (E) Neuronal maturation was assessed as the density of synaptic puncta. Data are presented as the mean ± SEM. Significant differences from the non-ACM-treated control p < 0.01*, 0.001**, between the ACM-treated groups p < 0.01#, 0.001##. One-way ANOVA, followed by Tukey’s analysis. Scale bars are 25 μm. (F–I) Md-ACM had anti-inflammatory effects and prevented senescence through secreted factors. (F) Immunocytochemical analysis for microglial (Iba1 + ) immunoreactive pro-inflammatory/cytotoxic factors (IL-1β). (G) qPCR analysis of pro-inflammatory factor expression in LPS-activated microglia treated with Md-ACM or Fo-ACM. (H–I) The senescence level of the microglia was identified by the expression of P21, a senescence marker (H), and SA-β-gal activity (I). Data are indicated as the mean ± SEM. Significant differences from the WT #p < 0.001 and among the groups specified at p < 0.01*, 0.001**. One-way ANOVA, followed by Tukey’s analysis. Scale bars are 25 or 50 μm. (J) Gene expression analysis revealing the DEGs of candidate factors responsible for the differential paracrine actions of inflammatory cytokines and neurotrophic factors between human Md-AST and Fo-AST. The identified DEGs are listed in the heatmap.
Fig. 4
Fig. 4
Midbrain astrocytes (Md-AST) ameliorate PD- and AD-associated pathologies in an in-vitro culture model. (A) Schematic overview of the PD -associated experimental procedure. The effects of the cultured Md-AST on the levels of α-syn pathologies (B-H) were analyzed. Fourteen days after α-syn PFF (1.5 μg/mL) treatment, α-syn aggregation was detected as immunoreactivity against thioflavin-S (ThS) (B) and pS129-α-syn staining (C). Scale bars are 50 μm. *P < 0.05. t-test (D) Intracellular protein levels of α-syn monomers and oligomers were determined using a Western blot (WB) analysis. Data are represented as the mean ± SEM of protein levels relative to β-actin (n = 3). (E) Expression of neurotrophic and inflammatory genes in the presence of the α-syn PFF during co-culture with Md-AST or forebrain-astrocytes (Fo-AST), estimated by qPCR analyses. *P < 0.05. Student’s t-test. n = 3. (F) Immunoblot analysis to assess inflammasome activation. To activate the inflammasome pathway, PD-context model cells were treated with LPS (3 hr; 0.25 µg/mL) and then ATP (2.5 mM, 30 min) before conditioned-medium (CM) was collected. The levels of pro- and activated-IL-1β and caspase-1proteins released in the culture media were determined. The protein levels were measured in the media and normalized to Ponceau S-stained total protein levels. Significant differences from the LPS + ATP-treated(+)/Md-AST co-culture p < 0.05*. n = 6 independent cultures. t-test. (G, H) The effects of Md-AST on α-syn-induced neuronal degeneration were assessed by counting TH + DA neurons (G) and quantifying synaptic puncta per 100 μm (H). *p < 0.05, t-test. n = 3 independent experiments in triplicate. Scale bars are 25 or 50 μm. (I) Schematic overview of the AD -associated experimental procedure. (J-N) The effects of the cultured Md-AST on the levels of Aβ pathologies were analyzed. (J-K) Aβ aggregation was detected as immunoreactivity against thioflavin-S (ThS) (J) and WB analysis (K). *P < 0.05. t-test. (L) Expression of neurotrophic and inflammatory genes in the presence of Aβ fibrils during co-culture, estimated by qPCR analyses. *P < 0.05. Student’s t-test. n = 3. (M) The activated-inflammosome protein levels were measured in the AD-context model. The levels of proteins released in the culture media were determined. Significant differences from the LPS + ATP-treated(+)/Md-AST co-culture p < 0.05*. n = 6 independent cultures. Student’s t-test. (N) The effects of Md-AST on Aβ -induced neuronal degeneration were assessed by quantifying synaptic puncta per 100 μm. Scale bars are 25 or 50 μm. *P < 0.05. t-test.
Fig. 5
Fig. 5
In vivo therapeutic functions of cultured midbrain astrocytes (Md-AST) in MPTP- (A–K) and α-synuclein (L–T)-induced PD model mice. (A) Schematic of the experimental procedure to generate MPTP-induced PD model mice. MPTP PD model mice were generated by MPTP i.p. injection (30 mg/kg) for 5 days. Two to three days after starting the MPTP injections, PBS (sham control), Md-AST, or forebrain-astrocytes (Fo-AST) were injected into both the left and right sides of the substantia nigra (SN). At 12 weeks post-transplantation, the recovery of DA neuron degeneration was assessed using immunohistochemistry and behaviors tests. (B) Representative images of transplantation effect of Md-AST or Fo-AST on PD pathologies in the SN region of the MPTP model. TH + neuronal loss (C), soma size of TH + Md-DA neurons (D), and neurite length (E) were analyzed. The effect of Md-AST transplantation on TH + Md-DA neurons in recovering the toxin-induced loss of Nurr1 was assessed by quantifying the percentage of Nurr1 + TH + cells (F) and the mean fluorescence intensity (MFI) of the Nurr1 signal, assessed by ImageJ (G). Significant differences from the WT #p < 0.001, and among the groups specified at p < 0.05*, 0.01**. n = 3–7 animals. One-way ANOVA, followed by Tukey’s analysis. Scale bars are 100 μm. (H–K) Behavior tests. The behaviors of the MPTP-induced PD model mice were assessed using pole (H), beam (I), rotarod (J), and locomotor activity (K) tests 12 weeks post-transplantation. Significant differences from the WT #p < 0.05 and between the groups p < 0.05*, p < 0.01**. n = 5–12 animals. One-way ANOVA, followed by Tukey’s analysis. Data are indicated as the mean ± SEM. (L) Schematic of the experimental procedure for the α–synuclein PD (α-syn-PD) model. The α-syn-PD model mice were generated by a bilateral injection of α-syn PFF (5 mg/mL) into the midbrain SNs. Two weeks later, cultured Md-AST or Fo-AST were transplanted into the midbrain SNs of the PD mice (or sham-control PBS injection into the SN). (M−N) Eight to ten weeks post-transplantation, α-synucleinopathy assessed as the percent of pS129-αsyn + TH + cells. The boxed areas in each image (1, 2, 3) are enlarged in the lower panel. Scale bars are 25 or 100 μm. (O–Q) DA neuron degeneration assessment. DA neuron degeneration was assessed by quantifying the numbers (O), soma sizes (P), and fiber lengths (Q) of TH + DA neurons (immunofluorescence stained). (R) Detection of α-syn aggregates by a Western blot (WB) analysis of α-syn (SN homogenates; n = 3–4 animals). Monomer and aggregate forms of α-syn were detected in the Triton X-100(Tx-100)–soluble and –insoluble (SDS soluble) fractions. The WB analysis was performed with 3 experimental replicates. (S-T) Assessment of local inflammation in the grafted SNs (host brain regions neighboring the grafts) compared with sham-operated (PBS-injected) areas of α-syn-PD mice and WT mice. (S) qPCR data showing Md-AST-mediated downregulation of pro-inflammatory cytokines and upregulation of neurotrophic factors at the graft–host interfaces of α-syn-PD-mouse SNs. (T) Immunohistochemical analyses of microglia (Iba1 + ) immunoreactive for pro-inflammatory/cytotoxic factors (CD11b and CD68). Immunoreactive cells along the host-graft interfaces were counted in 6 cryosectioned slices from three animals in each group. Data are expressed as percentages of immunoreactive cells in the Iba1 + microglial populations. Scale bars are 100 μm. α-syn-PD model experiments: n = 3–7 animals. Significant differences from the WT #p < 0.05, between the specified groups *p < 0.05, **p < 0.01. Two-way ANOVA, followed by Tukey’s analysis. Data are presented as the mean ± SEM.
Fig. 6
Fig. 6
Alzheimer’s disease (AD)-associated Aβ pathology and inflammation ameliorated in AD mice transplanted with midbrain- or forebrain-astrocytes. (A) Experimental schematic for the midbrain- or forebrain-astrocytes (Md-AST or Fo-AST) transplanted in AD model mice. The AD pathologic model mice were generated by a bilateral injection of Aβ fibrils (100 μM) into the hippocampus. Two weeks later, cultured Md-AST or Fo-AST were transplanted into the hippocampal regions of the AD mice (or sham-control PBS injection into the hippocampus). At 8 to 10 weeks post-transplantation, Aβ pathology and inflammation in hippocampi with astrocyte transplants were compared with those in sham-operated hippocampi. (B) Therapeutic effects of Md-AST or Fo-AST on pathologic Aβ accumulation in the hippocampal regions of AD model mice. The Aβ aggregates were detected by counting Aβ- and thioflavin S–double positive (Aβ+/thioflavin S + ) puncta. (C) Detection of Aβ aggregates by Western blot analysis for Aβ (hippocampus homogenates; n = 3–4 animals). Monomer and aggregate forms of Aβ in the SDS soluble fractions. (D–E) Assessment of local inflammation in the grafted hippocampi (host brain regions neighboring the grafts) compared with sham-operated (PBS-injected) Aβ-AD and WT mice. (D) Immunohistochemical analyses of microglia (Iba1 + ) immunoreactive for pro-inflammatory/cytotoxic factors (CD11b and CD68). Immunoreactive cells along the host-graft interfaces were counted in 3 to 4 animals in each group. Data are expressed as percentages of the immunoreactive cells within the Iba1 + microglial populations. (E) qPCR-based determination of neurotrophic and pro-inflammatory cytokine expression in the graft–host interfaces of AD model mice transplanted with Md-AST or Fo-AST vs. the PBS-sham operated or WT-control. n = 5–8 samples. Significant differences from the WT mice #p < 0.001, between the specified groups *p < 0.05, **p < 0.0001. One-way ANOVA, followed by Turkey post hoc analysis. Scale bars are 100 μm. (F) Synaptic maturation of TUJ1 + neurons, estimated as synapsin + puncta density. Significant differences from the WT mice #p < 0.001, between the groups **p < 0.001. One-way ANOVA. Scale bars are 25 μm.

Similar articles

Cited by

References

    1. Belanger M., Magistretti P.J. The role of astroglia in neuroprotection. Dialogues Clin Neurosci. 2009;11(3):281–295. - PMC - PubMed
    1. Brancaccio M., Patton A.P., Chesham J.E., Maywood E.S., Hastings M.H. Astrocytes control circadian timekeeping in the Suprachiasmatic nucleus via glutamatergic signaling. Neuron. 2017;93(6):1420–35 e5. - PMC - PubMed
    1. Qi G., Mi Y., Shi X., Gu H., Brinton R.D., Yin F. ApoE4 impairs neuron-astrocyte coupling of fatty acid metabolism. Cell Rep. 2021;34(1) - PMC - PubMed
    1. Jiwaji Z., Tiwari S.S., Aviles-Reyes R.X., Hooley M., Hampton D., Torvell M., et al. Reactive astrocytes acquire neuroprotective as well as deleterious signatures in response to tau and ass pathology. Nat Commun. 2022;13(1):135. - PMC - PubMed
    1. Yang Y., Song J.J., Choi Y.R., Kim S.H., Seok M.J., Wulansari N., et al. Proceedings of the national academy of sciences of the united states of america. 2022. Therapeutic functions of astrocytes to treat alpha-synuclein pathology in Parkinson's disease. - PMC - PubMed

MeSH terms

LinkOut - more resources