. 2024 Mar 23;15(1):2619.
doi: 10.1038/s41467-024-46822-7.

Prior infection with unrelated neurotropic virus exacerbates influenza disease and impairs lung T cell responses

Affiliations

Prior infection with unrelated neurotropic virus exacerbates influenza disease and impairs lung T cell responses

Isabelle Jia-Hui Foo et al. Nat Commun. .

Abstract

Immunity to infectious diseases is predominantly studied by measuring immune responses towards a single pathogen, although co-infections are common. In-depth mechanisms on how co-infections impact anti-viral immunity are lacking, but are highly relevant to treatment and prevention. We established a mouse model of co-infection with unrelated viruses, influenza A (IAV) and Semliki Forest virus (SFV), causing disease in different organ systems. SFV infection eight days before IAV infection results in prolonged IAV replication, elevated cytokine/chemokine levels and exacerbated lung pathology. This is associated with impaired lung IAV-specific CD8+ T cell responses, stemming from suboptimal CD8+ T cell activation and proliferation in draining lymph nodes, and dendritic cell paralysis. Prior SFV infection leads to increased blood brain barrier permeability and presence of IAV RNA in brain, associated with increased trafficking of IAV-specific CD8+ T cells and establishment of long-term tissue-resident memory. Relative to lung IAV-specific CD8+ T cells, brain memory IAV-specific CD8+ T cells have increased TCR repertoire diversity within immunodominant DbNP366+CD8+ and DbPA224+CD8+ responses, featuring suboptimal TCR clonotypes. Overall, our study demonstrates that infection with an unrelated neurotropic virus perturbs IAV-specific immune responses and exacerbates IAV disease. Our work provides key insights into therapy and vaccine regimens directed against unrelated pathogens.


Conflict of interest statement

The authors declare no competing interests.

Figures
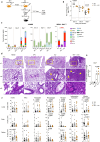
Fig. 1
Fig. 1. SFVIAV sequential infection exacerbates respiratory disease.
a Mice were infected i.p. with 5 × 103 pfu A7(74) SFV followed 8 days later with 104 pfu A/HKx31 (i.n.). Brain, lungs and spleens were harvested at various days post-infection (dpi). b Lung IAV viral titres were determined by a plaque assay on MDCK cells. Each symbol denotes an individual mouse (d3 IAV n = 5, SFV→IAV n = 5; d5 IAV n = 5, SFV→IAV n = 5; d7 IAV n = 10, SFV→IAV n = 10). c Lung homogenates and sera were assayed by LEGENDplex to determine the cumulative amount of total cytokines and chemokines present and the amounts of each cytokine. (SFV→IAV n = 5 (d3 and d5), n = 10 (d7), IAV n = 5 (d3 and d5), n = 10 (d7), data from 2 independent experiments are shown, mean values plotted, error bar represents SEM). d Histopathological changes in the lungs of SFV, IAV, and SFV → IAV infected mice on 7 dpi. Lungs from naïve mice were included as control. Lung sections were stained with HE; representative images are shown. Bar = 200 μm for ×5; 100 μm for ×15; and 20 μm for ×40 magnification. Yellow arrows point to area of inflammation and damage. e Quantification of the extent of inflammation and damage in SFV, IAV, and SFV→IAV groups (SFV n = 3, IAV n = 3, SFV→IAV n = 2, mean values plotted, error bar represents SEM). f Absolute numbers of B cells (B220+CD19+), antibody secreting cells (ASC, IgD-B220loCD138+), neutrophils (CD11b+Ly6G+), macrophages (CD11b+CD64+) DCs (CD11c+), inflammatory monocytes (CD11b+Ly6C+) and effector CD4+ T cells (CD62LloCD44hiCD4+) across different anatomical sites (SFV n = 14, IAV n = 15, SFV→IAV n = 14, error bar represents SEM). Gating strategy is shown in Supplementary Fig. S5a–c. Significance was determined by unpaired two-tailed Student’s t-test. Source data are provided as a Source Data file.
Fig. 2
Fig. 2. SFVIAV sequential infection perturbs influenza-specific CD8+ T cell responses.
a Absolute numbers of activated (CD44+CD62Llo) CD8+ T cells across different anatomical sites in naïve (n = 5), SFV (n = 14), IAV (n = 15) and SFV→IAV (n = 14) infected mice. Representative FACS plots shown for each group and tissue; error bar represents SEM. Gating strategy is shown in Supplementary Fig. S5c. b Absolute numbers of IAV-specific CD8+ T cells directed at DbNP366 and DbPA224 epitopes across different anatomical sites in IAV (n = 15) and SFV→IAV (n = 14) infected mice. Open symbols represent data points where less than 10 cells were analysed. Representative FACS plots shown for each group and tissue; error bar represents SEM. c Intracellular cytokine staining of CD8+ T cells isolated on 7 dpi from the brain of IAV (n = 5), SFV (n = 4) or SFV→IAV (n = 5) infected mice, and stimulated with a cognate peptide. Mean frequencies of IFNγ producing cells are plotted. Representative FACS plots shown for SFV → IAV infection, error bars represent SD. d Stacked bar graphs depicting frequencies of activation marker combinations on CD8+ T cells (upper panel), DbNP366+CD8+ T cells (middle panel) and DbPA224+CD8+ T cells (bottom panel) on 7 dpi in IAV (n = 15) and SFV→IAV (n = 14) infected mice; error bar represents SEM. e Comparison of significantly different activation marker combinations in the brain and lungs (IAV n = 15, SFV→IAV n = 14, error bar represents SEM). Significance was determined by unpaired two-tailed Student’s t test. Source data are provided as a Source Data file.
Fig. 3
Fig. 3. Increased TCRαβ repertoire clonotypic diversity of IAV-specific CD8+ T cells during SFVIAV sequential infection.
TCR representation of CDR3β sequence motifs within (a) DbNP366+CD8+ T cells and (b) DbPA224+CD8+ T cells in the lungs and brains of IAV and SFV → IAV mice. Each TCR chain motif depicts the V (left side) and J (right side) gene frequencies, the CDR3 amino acid sequence (middle), and the inferred rearrangement structure (bottom bars coloured by source region; V-region, light grey; insertions, red; diversity (D)-region, black; and J-region dark grey). The motif scores were determined by chi-squared, with values greater than 90 considered highly significant. c Circos plots of TRAV and TRBV clonotype pairings for DbNP366 and DbPA224 epitopes in the lung and brain of IAV and SFV → IAV infected mice. Left arch and segment colours show TRAV usage, while the outer right arch depicts TRBV usage. Each coloured segment indicates TCRαβ clonotypes with the same V gene segment usage, but not CDR3 sequences. The number on the bottom right shows the number of sequences considered for each circos plot. d Simpson’s diversity index (SDI) analysis of TRAV and TRBV usage in the lungs and brains of IAV (n = 4) and SFV → IAV (n = 5) in DbNP366 and DbPA224 epitopes CD8+ T cells. Significance was determined by unpaired two-tailed Student’s t-test. Source data are provided as a Source Data file.
Fig. 4
Fig. 4. Factors driving IAV-specific T cell trafficking to the brain.
a Evans blue (EB) extravasation assay in mice infected with either SFV or IAV or SFV→IAV co-infected, compared to naïve controls. EB was injected i.p. on different days, brains were perfused and harvested 3 h post-injection. EB concentration was measured spectrophotometrically in brain homogenates and determined using a standard curve. Data from 2 independent experiments were normalised to naïve controls and plotted, error bar represents SEM (d3: SFV n = 10, IAV n = 10; d5: SFV n = 10, IAV n = 8; d7: SFV n = 10, IAV n = 9; d7 + 1: SFV → IAV n = 10; d7 + 2: SFV → IAV n = 10; d7 + 3: SFV → IAV n = 4). b Mice were infected i.p. with 5 × 103 pfu A7(74) SFV. 1 x 106 naïve or in vitro activated CD8+ OT-I T cells were adoptively transferred i.v. to 7 days after infection SFV mice and uninfected mice. D1 post transfer all mice were infected i.n. with 1x10⁴ pfu A/x31-OVA. Brain, lungs, and spleen were collected at 7 days after infection. IAV, SFV, and SFV → IAV has been included as control (not shown) and has also received naïve or in-vitro activated OT-I T cells. c Absolute numbers of OT-I T cells across different anatomical sites in naïve (n = 4), SFV (n = 5), IAV (n = 5), SFV → IAV (n = 7), IAV-OVA (n = 9) and SFV → IAV-OVA (n = 10) with in vitro activated OT-I T cell transfer (error bar represents SEM). Representative FACS plots shown for each group and tissue. Gating strategy is shown in Supplementary Fig. S5d. d A/PR8 (H1N1) matrix (M) gene expression in the brain of IAV-only and SFV → IAV infected mice across different timepoints. Gene expression is normalised to GAPDH and the ∆∆Ct method used to calculate relative gene expression. Mean data are shown for biological replicates (d1: IAV n = 5, SFV → IAV n = 5; d2: IAV n = 5, SFV → IAV n = 5; d3: IAV n = 5, SFV → IAV n = 5; d5: IAV n = 4, SFV → IAV n = 5; d7: IAV n = 9, SFV → IAV n = 8; d8: IAV n = 5, SFV → IAV n = 5; error bar represents SEM). Shaded regions indicate 95% confidence interval. A/PR8 M gene expression in the lungs of IAV infected mice (n = 5) at 5 dpi was included as positive control. P values d1 *** = 0.0008, d7 * = 0.0464. Significance was determined by unpaired two-tailed Student’s t-test. Source data are provided as a Source Data file.
Fig. 5
Fig. 5. Surface proteome analysis of CD8+ T cells migrating to the brain.
a Schematic workflow for flow cytometric analysis of surface proteome. CD45.1+CD8+ T cells were enriched from the brain, lungs, and spleen of IAV-OVA and SFV → IAV-OVA infected mice, barcoded, stained with a CD8+ T cell focused backbone panel, then stained with phycoerythrin (PE) conjugated labelled antibodies for surface proteome expression with the LEGENDScreen kit (Biolegend), followed by individual expression analysis. b UMAP plot generated using InfinityFlow-predicted expression profiles for indicated populations in lungs OT-I CD8+ T cells from both SFV → IAV-OVA and IAV-OVA groups. c UMAP plot of OT-I CD8+ T cell subsets in the lungs generated using backbone markers from SFV → IAV-OVA (orange) and IAV-OVA (blue) groups. d Comparison of cell frequencies between SFV → IAV-OVA and IAV-OVA groups in different clusters identified by InfinityFlow. e Histogram representations of activation markers associated with CD8+ T cells: KLRG1, CX3CR1, CD43, integrin B7, CD11b and CD11c in Cluster 1 (terminal effectors). Source data are provided as a Source Data file.
Fig. 6
Fig. 6. SFV infection induces APC paralysis.
a Lung SFV viral titres were determined by a plaque assay on Vero cells on d3, d5 and d7 (n = 8). Absolute numbers of SFV-specific CD8+ T cells of KbE159 specificity in the lungs of SFV (n = 5) and SFV → IAV (n = 4) infected mice on d7. Each symbol denotes an individual mouse. b Mice were infected i.p. with 5×10³ pfu A7(74) SFV, or with 104 pfu A/HKx31 (i.n.), or treated with 20-nmol CpG 1668 i.v., a TLR9 ligand. c Normalised mean fluorescence intensity of cell surface marker Ly6A (SCA−1) on CD8+ dendritic cell population in spleen of mice infected with IAV (n = 9), SFV (n = 10), and CpG treated (n = 6) compared to naïve (n = 2). Representative histogram shown for expression of Ly6A on CD8+ DCs in the spleen of each infection, error bar represents SEM. d Mice were infected i.p. with 5 × 103 pfu A7(74) SFV. 1 × 106 VPD450-labelled naïve CD8+ OT-I T cells were adoptively transferred i.v. to SFV-infected mice on d7 and uninfected mice. D1 post transfer all mice were infected i.n. with 1 × 104 pfu A/x31-OVA. Mediastinal lymph node (MLN), lungs, and spleen were collected on d3.5 and d4.5. e Proportion of proliferating (VPD450 low) OT-I T cells at each division in the MLN on d3.5. Representative histogram shown for each division (naïve n = 5, IAV-OVA n = 9, SFV → IAV-OVA n = 9: error bar represents SEM). Gating strategy is shown in Supplementary Fig. S5d. f Proportion of divided (VPD450 low) OT-I T cells in the MLN, lungs, and spleen at 4.5 dpi. Representative histogram shown for OT-I T cells division (naïve n = 6, IAV-OVA n = 10, SFV → IAV-OVA n = 10; error bars represent SEM). Significance was determined by unpaired two-tailed Student’s t test. Source data are provided as a Source Data file.
Fig. 7
Fig. 7. Impaired immunological memory formation following sequential infection.
a Mice were infected i.p. with 5 × 103 pfu A7(74) SFV followed 8 days later with 104 pfu A/HKx31 (i.n.). Another group was infected with the same virus dosage, but in reverse order. IAV-only group has been included as control. Brains, lungs and spleens were harvested on d90. b Absolute numbers of IAV-specific CD8+ T cells directed at both DbNP366 and DbA224 epitopes are shown across different anatomical sites in IAV, SFV→IAV and IAV→SFV infected mice. ce Concatenated FACS plots (n = 5) shown for each group and tissue. Absolute numbers of IAV-specific TEM and TCM CD8+ T cells are shown for both DbNP366+CD8+ T cell and DbPA224+CD8+ T cell specificities in brain and lungs of IAV, SFV→IAV and IAV→SFV infected mice. Representative FACS plots shown for each group and tissue (n = 10, error bar represents SEM). f Absolute numbers of IAV-specific TRM CD8+ T cells for both DbNP366+CD8+ and DbPA224+CD8+ T cells in brain and lungs of IAV, SFV→IAV and IAV→SFV infected mice. Insets show frequencies of CD8+ T cells gated on CD69 and CD103 (n = 10, error bar represents SEM). Concatenated FACS plots (n = 5) shown for each group and tissue. Gating strategy is shown in Supplementary Fig. S5c. Significance was determined by unpaired two-tailed Student’s t test. Source data are provided as a Source Data file.
Fig. 8
Fig. 8. Abolition of immunodominance hierarchy in sequentially infected mice.
a Mice were infected i.p. with 5 × 103 pfu A7(74) SFV followed 8 days later with 104 pfu A/HKx31 (i.n.). Another group was infected with the same virus dosage, but in reverse order. IAV-only group has been included as control. On d100 after primary IAV infection mice were infected i.n. with 103 pfu A/PR/8/34 (PR8). Brains, lungs and spleens were harvested on d5 following PR8 challenge. b Absolute numbers of DbNP366+CD8+ and DbPA224+CD8+ T cells across different anatomical sites in [IAV]→PR8 (n = 9), [SFV→IAV]→PR8 (n = 9) and [IAV→SFV]→PR8 (n = 10) infected mice are shown. Representative FACS plots shown for each group and tissue, error bar represents SEM. c Magnitude of the secondary IAV-specific responses upon rechallenge. Memory: IAV (n = 10), SFV→IAV (n = 10) and IAV→SFV (n = 10). Recall: [IAV]→PR8 (n = 9), [SFV→IAV]→PR8 (n = 9) and [IAV→SFV]→PR8 (n = 10). Mean values plotted, error bar represents SEM. d Proportion of IAV-specific DbNP366+CD8+ T cells and DbPA224+CD8+ T cells across different anatomical sites in [IAV]→PR8 (n = 9), [SFV→IAV]→PR8 (n = 9) and [IAV→SFV]→PR8 (n = 10) infected mice. Mean values plotted, error bar represents SEM. e Absolute numbers and frequencies of IAV-specific CD8+ effector T cells (CD62LloCD44hi) for DbNP366+CD8+ and DbPA224+CD8+ T cells across different anatomical sites in [IAV]→PR8 (n = 9), [SFV→IAV]→PR8 (n = 9) and [IAV→SFV]→PR8 (n = 10) infected mice are shown. Concatenated FACS plots (n = 5 from one experiment) shown for each group and tissue, error bar represents SEM. Gating strategy is shown in Supplementary Fig. S5c. Significance was determined by ordinary two-way ANOVA test with Šídák’s multiple comparison. Source data are provided as a Source Data file.

References

    1. Griffiths EC, Pedersen AB, Fenton A, Petchey OL. The nature and consequences of coinfection in humans. J. Infect. 2011;63:200–206. doi: 10.1016/j.jinf.2011.06.005. - DOI - PMC - PubMed
    1. Kenney LL, et al. Increased immune response variability during simultaneous viral coinfection leads to unpredictability in CD8 T cell immunity and pathogenesis. J. Virol. 2015;89:10786–10801. doi: 10.1128/JVI.01432-15. - DOI - PMC - PubMed
    1. Paget J, et al. Global mortality associated with seasonal influenza epidemics: New burden estimates and predictors from the GLaMOR Project. J. Glob. Health. 2019;9:020421. doi: 10.7189/jogh.09.020421. - DOI - PMC - PubMed
    1. Girard M, Nelson CB, Picot V, Gubler DJ. Arboviruses: a global public health threat. Vaccine. 2020;38:3989–3994. doi: 10.1016/j.vaccine.2020.04.011. - DOI - PMC - PubMed
    1. Lopez Rodriguez E, et al. Co-infection with dengue virus and pandemic (H1N1) 2009 virus. Emerg. Infect. Dis. 2010;16:882–884. doi: 10.3201/eid1605.091920. - DOI - PMC - PubMed

Substances