. 2024 Mar 23;15(1):2615.
doi: 10.1038/s41467-024-46876-7.

Plasma p-tau212 antemortem diagnostic performance and prediction of autopsy verification of Alzheimer's disease neuropathology

Affiliations

Plasma p-tau212 antemortem diagnostic performance and prediction of autopsy verification of Alzheimer's disease neuropathology

Przemysław R Kac et al. Nat Commun. .

Abstract

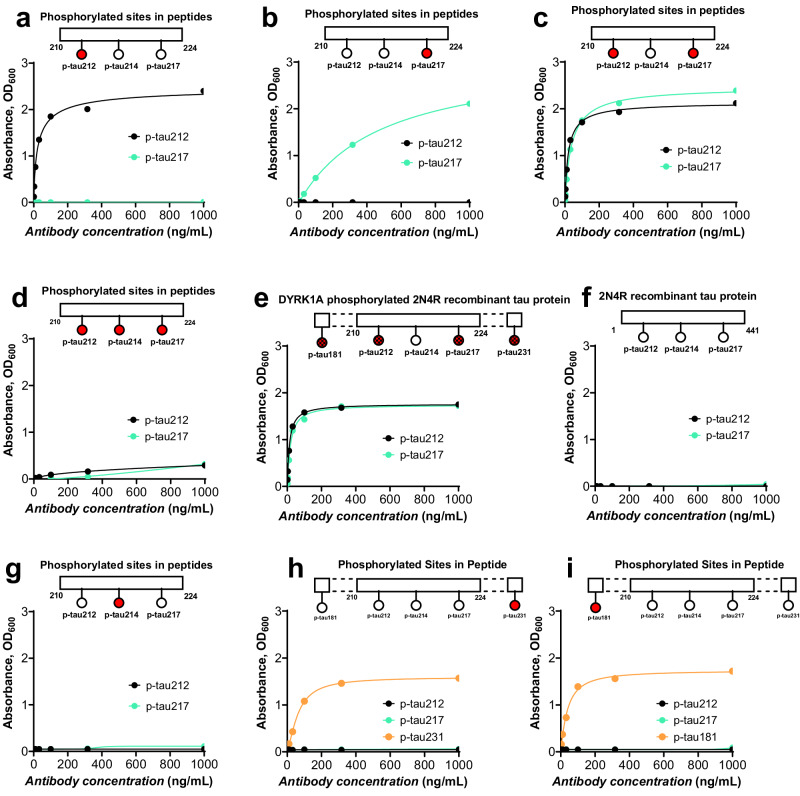
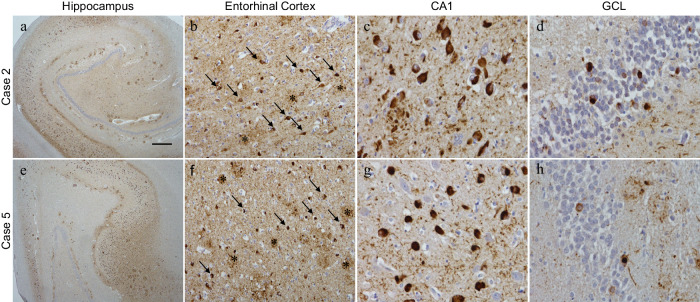
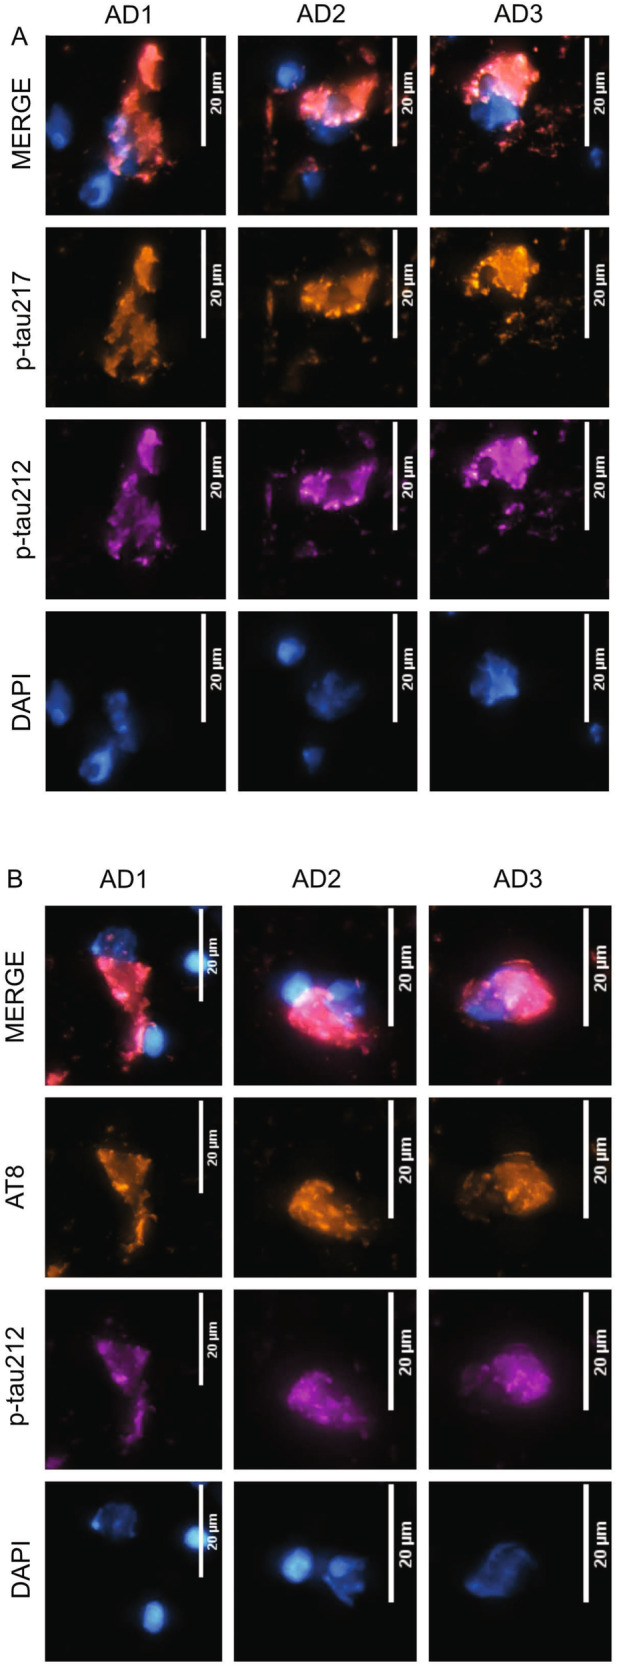
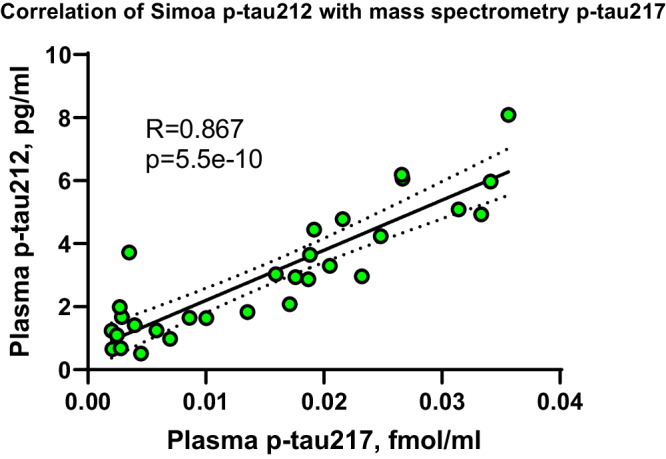
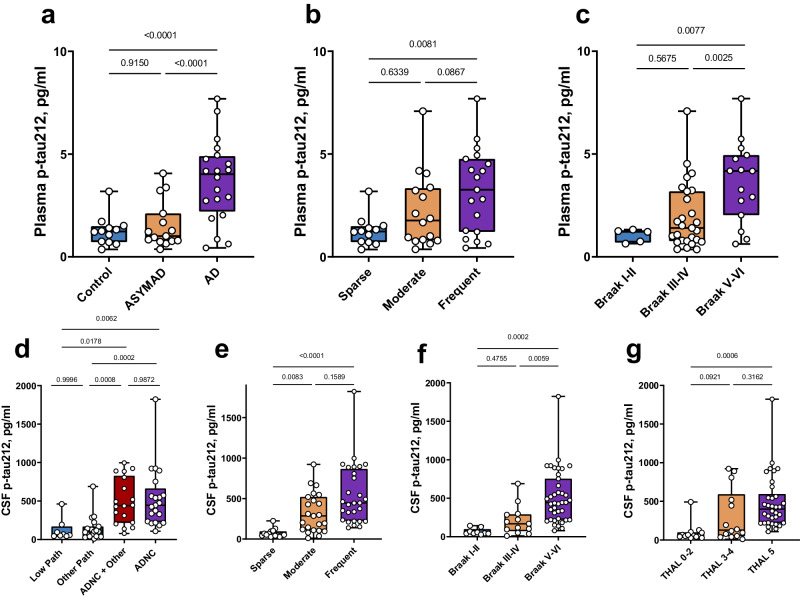
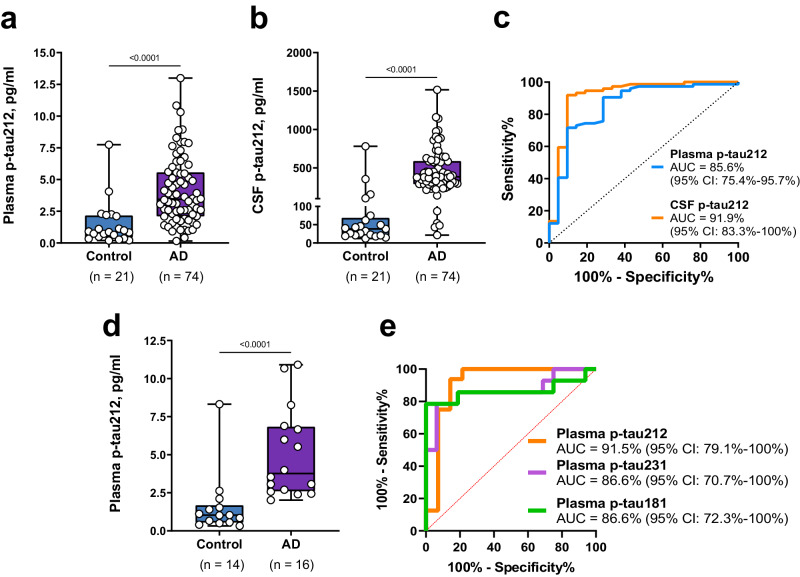
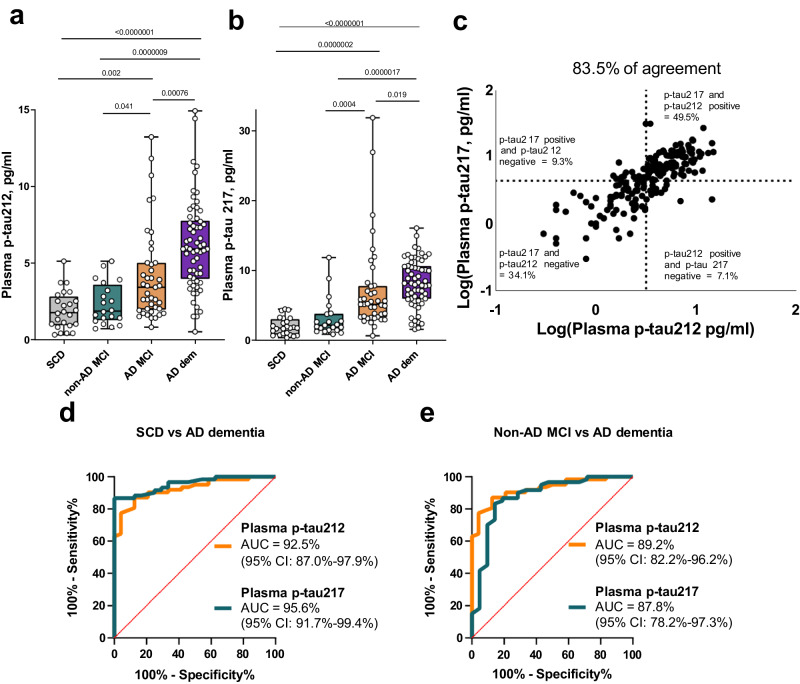
Blood phosphorylated tau (p-tau) biomarkers, including p-tau217, show high associations with Alzheimer's disease (AD) neuropathologic change and clinical stage. Certain plasma p-tau217 assays recognize tau forms phosphorylated additionally at threonine-212, but the contribution of p-tau212 alone to AD is unknown. We developed a blood-based immunoassay that is specific to p-tau212 without cross-reactivity to p-tau217. Here, we examined the diagnostic utility of plasma p-tau212. In five cohorts (n = 388 participants), plasma p-tau212 showed high performances for AD diagnosis and for the detection of both amyloid and tau pathology, including at autopsy as well as in memory clinic populations. The diagnostic accuracy and fold changes of plasma p-tau212 were similar to those for p-tau217 but higher than p-tau181 and p-tau231. Immunofluorescent staining of brain tissue slices showed prominent p-tau212 reactivity in neurofibrillary tangles that co-localized with p-tau217 and p-tau202/205. These findings support plasma p-tau212 as a peripherally accessible biomarker of AD pathophysiology.


Conflict of interest statement

M.T. and P.H. are employees of Bioventix Plc. H.Z. has served at scientific advisory boards and/or as a consultant for Abbvie, Acumen, Alector, Alzinova, ALZPath, Annexon, Apellis, Artery Therapeutics, AZTherapies, CogRx, Denali, Eisai, Nervgen, Novo Nordisk, Optoceutics, Passage Bio, Pinteon Therapeutics, Prothena, Red Abbey Labs, reMYND, Roche, Samumed, Siemens Healthineers, Triplet Therapeutics, and Wave, has given lectures in symposia sponsored by Cellectricon, Fujirebio, Alzecure, Biogen, and Roche. K.B. has served as a consultant or at advisory boards for Abcam, Axon, BioArctic, Biogen, JOMDD/Shimadzu. Julius Clinical, Lilly, MagQu, Novartis, Ono Pharma, Pharmatrophix, Prothena, Roche Diagnostics, and Siemens Healthineers. H.Z. and K.B. are co-founders of Brain Biomarker Solutions in Gothenburg AB, a GU Ventures-based platform company at the University of Gothenburg. NJA has given lectures in symposia sponsored by Lilly, BioArctic, and Quanterix. The other authors declare no competing interests.

Figures

Fig. 1
Fig. 1. Biochemical characterization of the p-tau212- and p-tau217-specific sheep mAbs.
Each panel shows the results of direct ELISAs where the p-tau212 and p-tau217 antibodies were each titrated against fixed concentrations of the indicated synthetic peptide or recombinant protein. The numbers at the start and the end of the horizontal schematics refer to the amino acids at the beginning and the end of the synthetic peptides. Colored circles represent phosphorylated site on the peptide. Checked circles represent epitopes proven to be phosphorylated by a dual specificity tyrosine phosphorylation regulated kinase 1A (DYRK1A) kinase. a Binding profiles of the p-tau212 and p-tau217 antibodies to a synthetic peptide (Bt-x-SRpTPSLPTPPTREPK, where Bt-x refers to biotinylation) that was phosphorylated specifically and exclusively at threonine-212. b Kinetic profiles of the p-tau212 and p-tau217 antibodies to a synthetic peptide that had the same sequence as in (a) above but was rather phosphorylated only at threonine-217 (Bt-x-SRTPSLPpTPPTREPK). c Binding characteristics of the p-tau212 and p-tau217 antibodies to the same sequence of synthetic peptide as in (a) and (b) but was phosphorylated at both the threonine-212 and threonine-217 sites (Bt-x-SRpTPSLPpTPPTREPK). d Binding profiles of the p-tau212 and p-tau217 antibodies to the same peptide sequence as in (ac) except that it was phosphorylated jointly at threonine-212, serine-214 and threonine-217 (Bt-x-SRpTPpSLPpTPPTREPK). e Binding characteristics of the p-tau212 or p-tau217 antibodies to a recombinant form of full-length tau 441 (2N4R) that was phosphorylated in vitro by DYRK1A kinase. This kinase phosphorylates tau at multiple other sites beyond threonine-212 and threonine-217 but not at serine-214. f Binding profiles of the p-tau212 or p-tau217 antibodies to a recombinant full-length tau 441 (2N4R) that was not phosphorylated at any site. g Binding characteristics of antibodies to peptide (bt-x-SRTPpSLPTPPTREPKK) specifically phosphorylated at serine-214. h Binding profile of antibodies to a peptide (bt-x-KKVAVVRpT(HOMOPRO)PKSPSSAK) specifically phosphorylated at threonine-231. P-tau231 specific antibody was used as a positive control. i Binding profile of antibodies to a peptide (bt-x-APKpTPPSSGE) specifically phosphorylated at threonine-181. P-tau181 specific antibody was used as a positive control. Source data are provided as a Source Data file.
Fig. 2
Fig. 2. P-tau212 immunohistochemical staining on Alzheimer’s Disease cases.
Hippocampal sections were stained with the ptau212 antibody recognizing the phosphorylated residues at 212. In both cases 2 and 5, strong tau staining was observed (a, e). In the entorhinal cortex neuropil threads were seen covering the parenchyma, along with neurofibrillary tangles (b and f arrows) and dystrophic neurites observed in concentrated areas (b and f asterisks). Higher magnification images of the CA1 subfield of the hippocampus and the granule cell layer (GCL) show the intensity of the staining in the neurofibrillary tangles (CA1: c and g, GCL: d and h). Scale bar represents 500 µm in a and e; 50 µm in b and f; 25 µm in c, d, g, and h.
Fig. 3
Fig. 3. Representative neurofibrillary tangles in autopsy-diagnosed AD brain tissue are phosphorylated jointly at p-tau212 and p-tau217.
The figure shows confocal microscopy images of immunofluorescent staining of selected tangles from temporal cortex tissue sections of three independent autopsy-verified AD patients. The individual was neuropathologically evaluated to be at Braak VI at autopsy, and they had been given an AD diagnosis for 15 years prior to death. Each micrograph shows co-staining with the nuclear stain DAPI in cyan hot, p-tau212 in magenta and p-tau217 (A, b) (or AT8 [p-tau202/205] in (B) in orange hot. The merged images show colocalization of the different color channels. The scale bar is 20 µm in each image.
Fig. 4
Fig. 4. Spearman Correlation for IP-MS plasma p-tau217 and Simoa plasma p-tau212.
The figure shows correlation between IP-MS plasma p-tau217 and Simoa plasma p-tau212 (n = 30 for both). Spearman r = 0.867. p = 5.5e-10).
Fig. 5
Fig. 5. Clinical performance of plasma and CSF p-tau212 in autopsy verified cohorts.
The figure shows plasma and CSF p-tau212 levels according to diagnostic groups, amyloid pathology, and Braak staging of neurofibrillary tangles in the BLSA- (a-c) and UCSD-neuropathology (d-f) cohorts with post-mortem validation. a Plasma p-tau212 levels in the control (n = 12) ASYMAD (n = 15), and AD (n = 20) groups in the BLSA-neuropathology cohort. b Plasma p-tau212 concentrations according to Aβ plaque counts categorized by the CERAD scoring – Sparse (n = 12), Moderate (n = 16) and Frequent (n = 19). c Stepwise increase of plasma p-tau212 levels according to Braak staging of neurofibrillary tangles - Braak I-II (n = 5), Braak III-IV (n = 27), Braak V-VI (n = 15). d CSF p-tau212 levels according to Alzheimer’s disease neuropathologic change (ADNC) categorization. The groups include those with low ADNC pathology - Low Path (non ADNC) (n = 8), Other Path (n = 19), ADNC (n = 21) and ADNC with concomitant neurodegenerative pathologies (ADNC + Other) (n = 18). e CSF p-tau212 concentrations according to the CERAD scores of Aβ plaques Sparse (n = 15), Moderate (n = 23), Frequent (n = 28) f CSF p-tau212 levels separated based on Braak staging characterization given at autopsy - Braak I-II (n = 9), Braak III-IV (n = 13), Braak V-VI (n = 39). g CSF p-tau212 concentration across different Thal phases - THAL 0-2 (n = 13), THAL 3-4 (n = 14); THAL 5 (n = 34). The estimated mean between-group fold differences of CSF/plasma p-tau212 for every plot are given in Tables 2, 3, and Supplementary Table 10. Comparisons of the performances of p-tau212 with p-tau217, p-tau181 and p-tau231 are shown in Tables 2, 3, and Supplementary Table 10. Boxplots showing measurements of other p-tau biomarkers are shown in Supplementary Fig. 6. Box plots are shown as median and interquartile range (IQR), boundaries of the whiskers are minimum and maximum values. Analysis of variance (ANOVA) with Tukey’s post-hoc test was used to compare differences between groups, after adjusting for sex, age, and CSF/plasma collection-to-death intervals. Pairwise comparisons were adjusted for multiple comparisons. Source data are provided as a Source Data file.
Fig. 6
Fig. 6. P-tau212 performance in plasma versus CSF to distinguish Aβ + AD from Aβ- controls.
The plots in a and b show p-tau212 levels in Aβ-positive AD (n = 74) participants compared with Aβ-negative controls (n = 21) in paired plasma and CSF samples respectively in the Polish cohort. c AUCs of the accuracies of p-tau212 in plasma versus CSF to separate the groups shown in (a) and (b). De Long’s test comparing the AUCs for plasma and CSF p-tau212 did not reach statistical significance. d Plasma p-tau212 levels in Aβ-positive AD (n = 16) participants compared with Aβ-negative controls (n = 14) in the Gothenburg cohort. e Comparison of the AUC values for plasma p-tau212 versus those for plasma p-tau231 and p-tau181 in the same set of samples shown in (d). Box plots are shown as median and interquartile range (IQR), boundaries of the whiskers are minimum and maximum values. Group differences were examined using two-tailed Mann–Whitney test. The Polish cohort included individuals with paired CSF and EDTA plasma samples (n = 95) from Erlangen Score defined controls (n = 21) and AD (n = 74). The Gothenburg discovery cohort (n = 30) included EDTA plasma samples from neurochemically defined Alzheimer’s disease participants (n = 16) and controls (n = 14). Source data are provided as a Source Data file.
Fig. 7
Fig. 7. Clinical utility of plasma p-tau212 and p-tau217 in a real-world memory clinic cohort.
Clinical validation of the plasma p-tau212 assay versus p-tau217 in the Slovenia memory clinic cohort. a Plasma p-tau212 levels in the different diagnostic groups – SCD (Subjective Cognitive Decline) (n = 24), non-AD MCI (non-Alzheimer’s Disease Mild Cognitive Impairment) (n = 20), AD MCI (Alzheimer’s Disease Mild Cognitive Impairment) (n = 41), AD dementia (Alzheimer’s Disease Dementia) (n = 62), and b Plasma p-tau217 levels in the different diagnostic groups – SCD (n = 24), non-AD MCI (n = 21), AD MCI (n = 41), AD Dementia (n = 60) levels in the different diagnostic groups. The SCD and non-AD MCI groups included Aβ-negative participants while the AD MCI and AD dementia groups were all Aβ-positive. c Concordance between plasma p-tau212 and p-tau217. Percentage of concordant measurements are given in the lower left and upper right quadrants whilst the percent of discordant cases are in the lower right and upper left quadrants. Assay cut-offs were estimated using the Youden’s index. d Area under the curve (AUC) comparison of plasma p-tau212 and plasma p-tau217 to differentiate between SCD and AD-dementia. e AUC comparison of plasma p-tau212 and plasma p-tau217 measurements to differentiate between non-AD MCI and AD-dementia participants. De Long’s test comparisons of the AUCs did not reveal any significant differences. Box plots are shown as median and interquartile ranges (IQR), boundaries of the whiskers are minimum and maximum values. Group differences were examined using Dwass-Steel-Critchlow-Fligner test. Source data are provided as a Source Data file.

Update of

References

    1. Li Y, et al. Validation of plasma amyloid-β 42/40 for detecting alzheimer disease amyloid plaques. Neurology. 2022;98:e688–e699. - PMC - PubMed
    1. Karikari TK, et al. Blood phospho-tau in Alzheimer disease: analysis, interpretation, and clinical utility. Nat. Rev. Neurol. 2022;18:400–418. doi: 10.1038/s41582-022-00665-2. - DOI - PubMed
    1. Chong JR, et al. Blood-based high sensitivity measurements of beta-amyloid and phosphorylated tau as biomarkers of Alzheimer’s disease: a focused review on recent advances. J. Neurol. Neurosurg. Psychiatry. 2021;92:1231–1241. doi: 10.1136/jnnp-2021-327370. - DOI - PubMed
    1. Teunissen CE, et al. Blood-based biomarkers for Alzheimer’s disease: towards clinical implementation. Lancet Neurol. 2022;21:66–77. doi: 10.1016/S1474-4422(21)00361-6. - DOI - PubMed
    1. Gonzalez-Ortiz F, et al. Plasma phospho-tau in Alzheimer’s disease: towards diagnostic and therapeutic trial applications. Mol. Neurodegener. 2023;18:18. doi: 10.1186/s13024-023-00605-8. - DOI - PMC - PubMed