. 2024 Mar 23;15(1):2599.
doi: 10.1038/s41467-024-46824-5.

FANCJ promotes PARP1 activity during DNA replication that is essential in BRCA1 deficient cells

Affiliations

FANCJ promotes PARP1 activity during DNA replication that is essential in BRCA1 deficient cells

Ke Cong et al. Nat Commun. .

Abstract

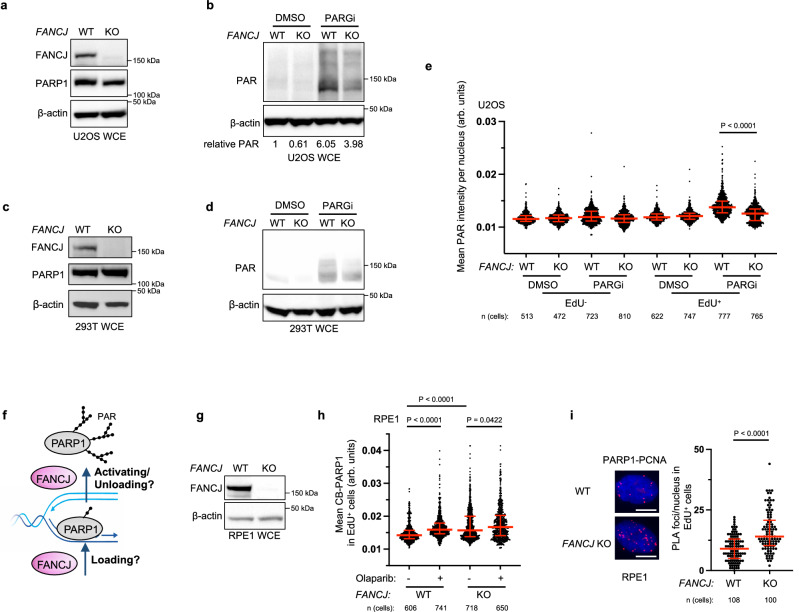
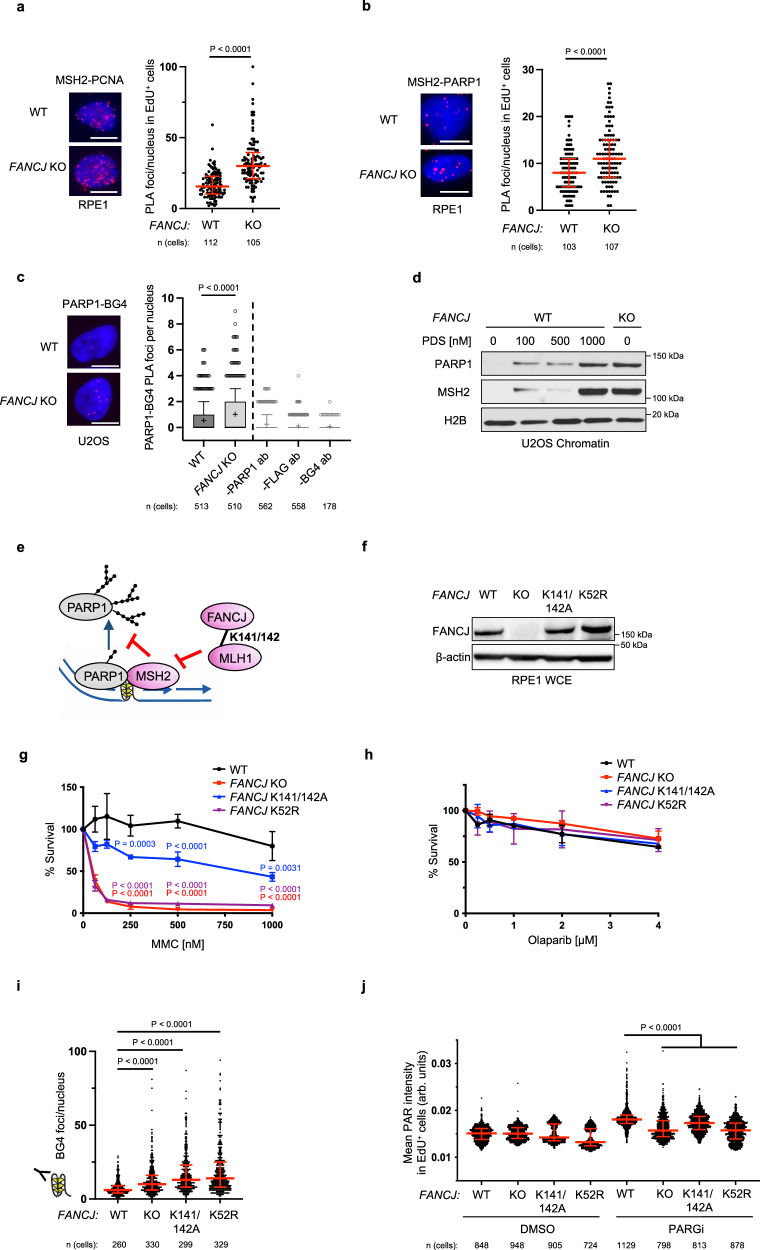
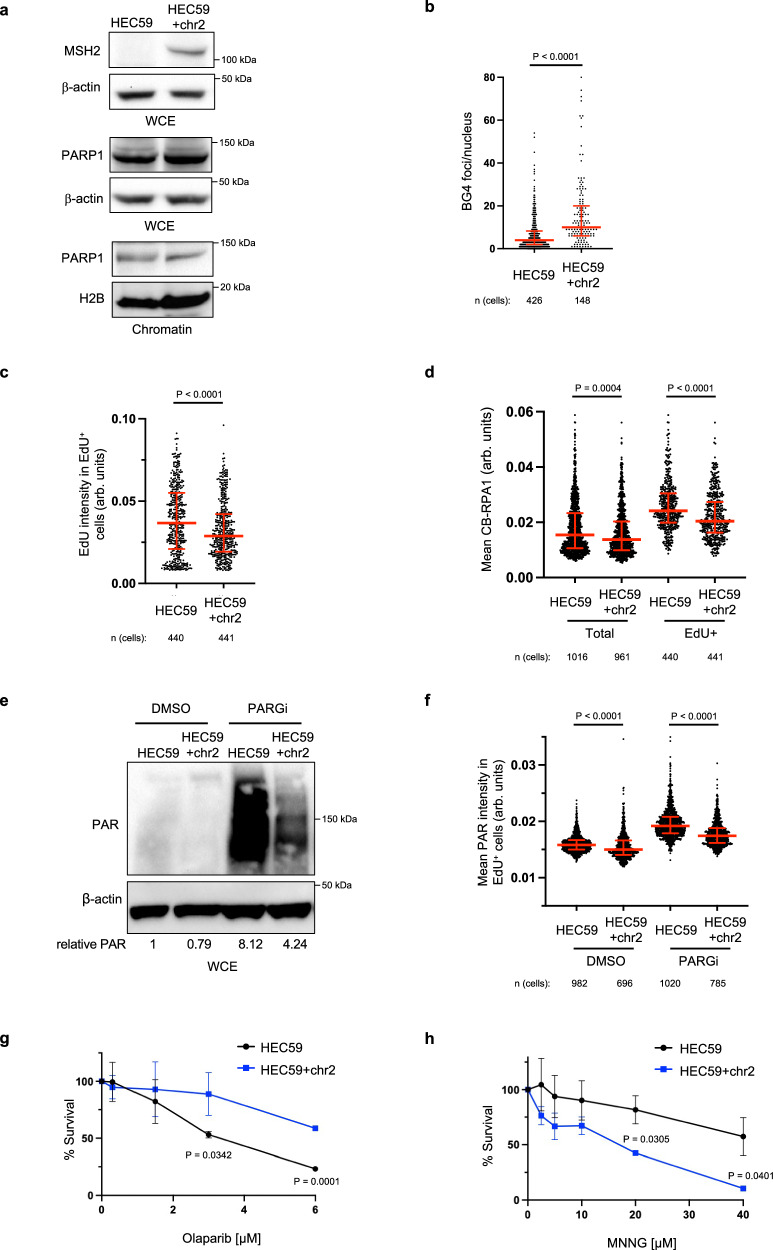
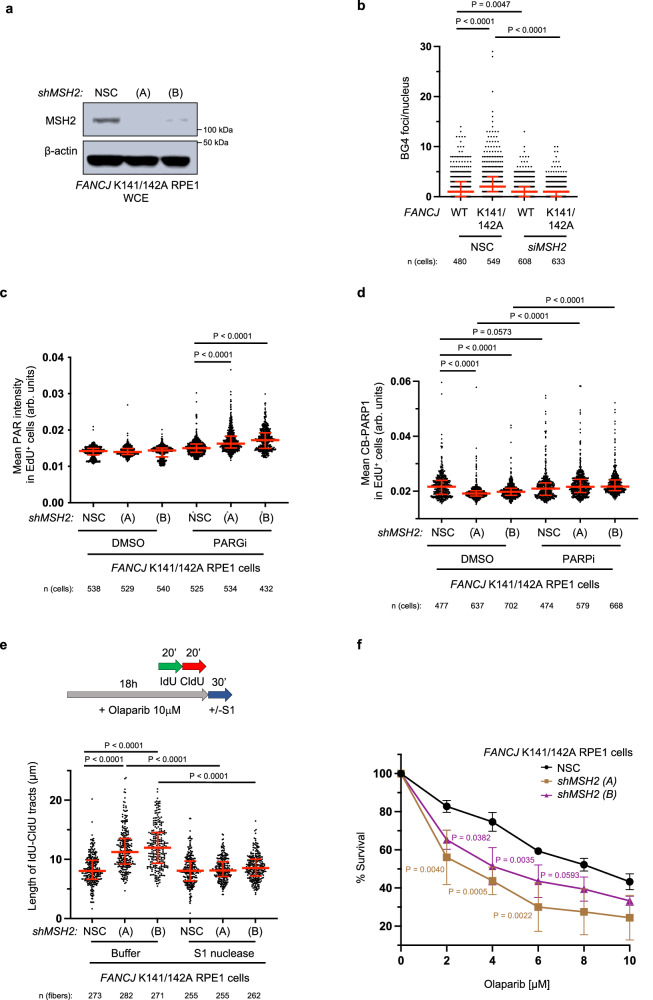
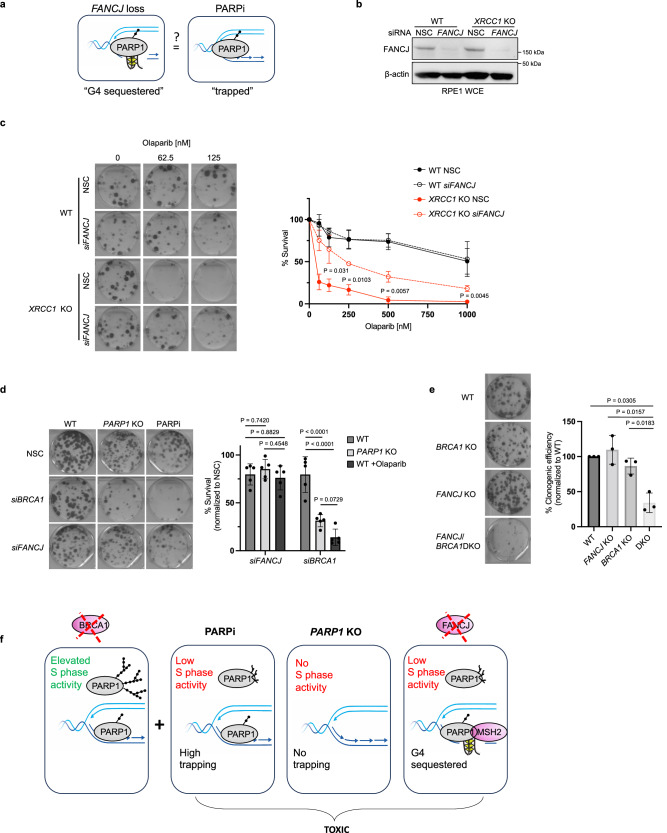
The effectiveness of poly (ADP-ribose) polymerase inhibitors (PARPi) in creating single-stranded DNA gaps and inducing sensitivity requires the FANCJ DNA helicase. Yet, how FANCJ relates to PARP1 inhibition or trapping, which contribute to PARPi toxicity, remains unclear. Here, we find PARPi effectiveness hinges on S-phase PARP1 activity, which is reduced in FANCJ deficient cells as G-quadruplexes sequester PARP1 and MSH2. Additionally, loss of the FANCJ-MLH1 interaction diminishes PARP1 activity; however, depleting MSH2 reinstates PARPi sensitivity and gaps. Indicating sequestered and trapped PARP1 are distinct, FANCJ loss increases PARPi resistance in cells susceptible to PARP1 trapping. However, with BRCA1 deficiency, the loss of FANCJ mirrors PARP1 loss or inhibition, with the detrimental commonality being loss of S-phase PARP1 activity. These insights underline the crucial role of PARP1 activity during DNA replication in BRCA1 deficient cells and emphasize the importance of understanding drug mechanisms for enhancing therapeutic response.


Conflict of interest statement

The authors declare no competing interests.

Figures

Fig. 1
Fig. 1. Modest PARPi sensitivity of FANCJ deficient cells is associated with low S-phase PAR and enhanced PARP1 chromatin loading.
a Representative western blot (WB) from two independent experiments for analysis of the expression levels of the indicated proteins from whole cell lysates in untreated WT vs FANCJ KO U2OS cells. b Representative WB analyzing PAR from whole cell lysates in indicated U2OS cells treated with DMSO or PARG inhibitor (PARGi, 10 µM) for 40 min prior to harvesting to block PAR removal. Mean relative PAR from three independent experiments normalized to β-actin shown. c Representative WB from two independent experiments for analysis of the expression levels of the indicated proteins from whole cell lysates in untreated WT vs FANCJ KO 293T cells. d Representative WB from two independent experiments showing the PAR formation in indicated 293T cells treated with DMSO or PARG inhibitor (PARGi, 10 µM) for 40 min prior to harvesting to block PAR removal. e Quantification of mean PAR intensity per nucleus for WT and FANCJ KO U2OS cells treated with DMSO or PARGi (10 µM, 30 min) together with EdU incubation. Data are from three independent experiments. Each dot represents one cell. Red bars represent the median ± interquartile range. All statistical analysis according to Kruskal–Wallis test, followed by Dunn’s test. f Schematic showing how FANCJ impacts PAR formation during replication: could FANCJ impact PARP1 loading and/or releasing during replication? g Representative WB from three independent experiments for analysis of the expression levels of the indicated proteins from whole cell lysates in untreated WT vs FANCJ KO RPE1 cells. h Quantification of chromatin-bound PARP1 (CB-PARP1) for RPE1 WT and FANCJ KO with or without Olaparib treatment (10 µM, 2 h) with EdU incubated in the final 30 min. Data are from three independent experiments. Each dot represents one cell. Red bars represent the median ± interquartile range. All statistical analysis according to Kruskal-Wallis test, followed by Dunn’s test. i PARP1-PCNA proximity ligation assay (PLA) in untreated RPE1 WT vs FANCJ KO cells, with 10 µM EdU incubated for 20 mins. Dot plot shows the number of foci per EdU+ cell and the red bars represent median ± interquartile range from three independent experiments. Scale bars, 10 µm. Statistical analysis according to two-tailed Mann–Whitney test. Representative images shown with PLA foci in red, scale bars 10 µm. For e, h, and i; 5-ethynyl-2′-deoxyuridine (EdU)-positive or EdU+ cells were gated to identify positive EdU incorporation (S-phase). Source data are provided as a Source Data file.
Fig. 2
Fig. 2. S-phase PAR requires FANCJ helicase and MLH1 binding activities.
a MSH2-PCNA proximity ligation assay (PLA) in untreated RPE1 WT vs FANCJ KO cells with EdU incubated for 20 mins. Dot plot shows the number of foci per EdU+ cell and the red bars represent median ± interquartile range from three independent experiments. Statistical analysis according to two-tailed Mann–Whitney test. Representative images shown with PLA foci in red, scale bars 10 µm. b MSH2-PARP1 PLA in untreated RPE1 WT vs FANCJ KO cells with EdU incubated for 20 min. Dot plot shows the number of foci per EdU+ cell and the red bars represent median ± interquartile range from three independent experiments. Statistical analysis according to two-tailed Mann-Whitney test. Representative images shown with PLA foci in red, scale bars 10 µm. c PARP1-BG4 PLA in untreated U2OS WT vs FANCJ KO cells. The mean of the data are represented by a “+”, the bounds of box indicate first and third quartile while the whiskers indicate 10th and 90th percentile. Data are from three independent experiments except for the negative BG4 antibody control (1 experiment). Scale bars, 10 µm. Statistical analysis according to two-tailed Mann–Whitney test. Representative images shown with PLA foci in red, scale bars 10 µm. d Representative WB from three independent experiments of chromatin bound PARP1 and MSH2 in 24 h PDS treated U2OS WT cells compared to untreated WT and FANCJ KO cells. e Model showing MSH2 could limit PARP1 activation and be regulated by the FANCJ-MLH1 interaction. f WB analysis of FANCJ in the whole cell lysates of FANCJ knock-in mutant cells. Representative from three independent experiments. g Cell survival assays for indicated cells under increasing concentrations of mitomycin C (MMC). Dots represent the mean percentage ±SD of survival for each cell line and drug concentration from three independent experiments. Significance was determined by one-way ANOVA followed by Dunnett’s test comparing FANCJ WT to mutant cells. P-value color matches sample in key and compares to WT. h Cell survival assays for indicated cells under increasing concentrations of Olaparib. Dots represent the mean percentage ±SD of survival for each cell line and drug concentration from three independent experiments. i Quantification of G-quadruplex (BG4 antibody) foci/nucleus in RPE1 mutant cells under untreated growth conditions. Representative from two independent experiments. Statistical analysis according to Kruskal-Wallis test, followed by Dunn’s test. j Quantification of PAR after 30 min DMSO or PARGi (10 µM) treatment with EdU in EdU+ RPE1 WT, FANCJ KO, FANCJ K141/142A and K52R cells. Red bars represent the median ± interquartile range. Representative from three independent experiments. Statistical analysis according to Kruskal–Wallis test, followed by Dunn’s test. For a, b, and j; 5-ethynyl-2′-deoxyuridine (EdU)-positive or EdU+ cells were gated to identify positive EdU incorporation (S-phase). Source data are provided as a Source Data file.
Fig. 3
Fig. 3. MSH2 interferes with PARP1 activation.
a Representative WB from two independent experiments from whole cell lysates and chromatin fractionations showing indicated proteins in HEC59 vs HEC59 + chr2 cells under untreated growth conditions. b Quantification of G-quadruplexes (BG4 antibody) in untreated HEC59 vs HEC59 + chr2 cells from three independent experiments. Red bars represent the median ± interquartile range, each dot represents one cell. Statistical analysis according to two-tailed Mann-Whitney test. c Quantification of mean EdU intensity from EdU+ cells labeled for 40 min from three independent experiments. Red bars represent the median ± interquartile range, each dot represents one cell. d Quantification of chromatin bound RPA1 (CB-RPA1) for the indicated cells with EdU incubated for 40 min from three independent experiments. Red bars represent the median ± interquartile range, each dot represents one cell. Statistical analysis according to Kruskal-Wallis test, followed by Dunn’s test. e Representative WB for the PAR formation in indicated cells treated with DMSO or PARGi (10 µM) for 40 min prior to harvesting. Mean relative PAR from three independent experiments normalized to β-actin shown. f Quantification of PAR after 30 min DMSO or PARGi (10 µM) treatment in the indicated EdU+ cells. Each dot represents one cell from three independent experiments. Red bars represent the median ± interquartile range, each dot represents one cell. All statistical analysis according to Kruskal-Wallis test, followed by Dunn’s test. g, h Cell survival assays for the indicated cells under increasing concentrations of Olaparib and N-methyl-N′-nitro-N-nitrosoguanidine (MNNG). Dots represent the mean percentage ±SD of survival for each cell line and drug concentration from three independent experiments. Significance was determined by unpaired t-test (two-tailed, unequal variance). For c, d, and f; 5-ethynyl-2′-deoxyuridine (EdU)-positive or EdU+ cells were gated to identify positive EdU incorporation (S-phase). Source data are provided as a Source Data file.
Fig. 4
Fig. 4. The FANCJ-MLH1 interaction promotes PARP1 activation by restricting MSH2.
a Representative WB from three independent experiments for the indicated proteins from whole cell lysates from RPE1 cells expressing small hairpin RNA (shRNA) against non-silencing control (NSC) and two shRNAs targeting MSH2 (A) and (B). b Quantification of G-quadruplexes (BG4 antibody) in the indicated RPE1 cells with siRNA under untreated growth conditions. Each dot represents one cell from three independent experiments. Red bars represent the median ± interquartile range. Statistical analysis according to Kruskal-Wallis test, followed by Dunn’s test. c Quantification of PAR after 30 min DMSO or PARGi (10 µM) treatment in the indicated EdU+ RPE1 cells. Each dot represents one cell from three independent experiments. Red bars represent the median ± interquartile range. Statistical analysis according to Kruskal–Wallis test, followed by Dunn’s test. d Quantification of CB-PARP1 in the indicated cells with or without Olaparib treatment (10 µM, 6 h), with EdU incubated at the final 40 min. Each dot represents one cell from three independent experiments. Red bars represent the median ± interquartile range. Statistical analysis according to Kruskal–Wallis test, followed by Dunn’s test. e Schematic and quantification of the S1 nuclease DNA fiber assays for the length of dual-color tracts in indicated cells following Olaparib treatment (10 µM, 18 h). Each dot represents 1 fiber; data are from three independent experiments. Red bars represent the median ± interquartile range. Statistical analysis according to Kruskal–Wallis test, followed by Dunn’s test. f Cell survival assays for indicated RPE1 cells under increasing concentrations of Olaparib. Dots represent the mean percentage ±SD of survival for each cell line and drug concentration from four independent experiments. Significance was determined by one-way ANOVA followed by Dunnett’s test, P-value color matches sample in key and compares to NSC. For c and d; 5-ethynyl-2′-deoxyuridine (EdU)-positive or EdU+ cells were gated to identify positive EdU incorporation (S-phase). Source data are provided as a Source Data file.
Fig. 5
Fig. 5. G4 “sequestered” PARP1 is distinct from “trapped” PARP1 and provides insight that loss of S-phase activity underlies PARPi toxicity in BRCA1 deficient cells.
a Model depicting the question: Is PARP1 trapping distinct from G4 sequestering? b Representative WB from two independent experiments to analyze of the expression levels of the indicated proteins from whole cell lysates for the indicated cells lines and knock down reagents. c Representative images and quantification of clonogenic survival assays of the indicated RPE1 cell lines and siRNA treatments with increasing doses of Olaparib from three independent experiments. Dots represents the mean percentage ± SD for a given cell line, knockdown reagent and Olaparib concentration. Significance determined by unpaired t-test (two-tailed, unequal variance) comparing XRCC1 KO NSC to siFANCJ. d Representative images and quantification of clonogenic assays for RPE1 WT and PARP1 KO cells with indicated siRNA, KO cell and Olaparib treatment (1 µM). Mean survival percentages normalized to NSC from 5 independent experiments. Dots represent each individual experiment while the top of the bar indicates the mean percentage ± SD. Significance determined by two-way ANOVA followed by Tukey’s test. e Representative images and quantification of clonogenic assays for the indicated cells. DKO double knockout. Mean percent clonogenic efficiencies (normalized to WT) from three independent experiments. Dots represent each individual experiment while the top of the bar indicates the mean percentage ± SD. Significance determined by one-way ANOVA (unequal variance) followed by Dunnett’s test. f Model of proposed findings: PARPi toxicity in BRCA1 deficient cells derives from an inability of PARP1 to function in S-phase resulting in the accumulation of replication-associated ssDNA lesions and PARP1 trapping. Loss of FANCJ in BRCA1 deficient cells sequesters PARP1 on G4s prohibiting PARP1 from efficiently functioning during replication. Source data are provided as a Source Data file.

Update of

References

    1. Bryant HE, et al. Specific killing of BRCA2-deficient tumours with inhibitors of poly(ADP-ribose) polymerase. Nature. 2005;434:913–917. doi: 10.1038/nature03443. - DOI - PubMed
    1. Farmer H, et al. Targeting the DNA repair defect in BRCA mutant cells as a therapeutic strategy. Nature. 2005;434:917–921. doi: 10.1038/nature03445. - DOI - PubMed
    1. Ray Chaudhuri A, et al. Topoisomerase I poisoning results in PARP-mediated replication fork reversal. Nat. Struct. Mol. Biol. 2012;19:417–423. doi: 10.1038/nsmb.2258. - DOI - PubMed
    1. Berti M, et al. Human RECQ1 promotes restart of replication forks reversed by DNA topoisomerase I inhibition. Nat. Struct. Mol. Biol. 2013;20:347–354. doi: 10.1038/nsmb.2501. - DOI - PMC - PubMed
    1. Haince JF, et al. PARP1-dependent kinetics of recruitment of MRE11 and NBS1 proteins to multiple DNA damage sites. J. Biol. Chem. 2008;283:1197–1208. doi: 10.1074/jbc.M706734200. - DOI - PubMed

Substances