. 2024 Mar 23;10(1):30.
doi: 10.1038/s41522-024-00496-7.

A genetic screen identifies a role for oprF in Pseudomonas aeruginosa biofilm stimulation by subinhibitory antibiotics

Affiliations

A genetic screen identifies a role for oprF in Pseudomonas aeruginosa biofilm stimulation by subinhibitory antibiotics

Luke N Yaeger et al. NPJ Biofilms Microbiomes. .

Abstract

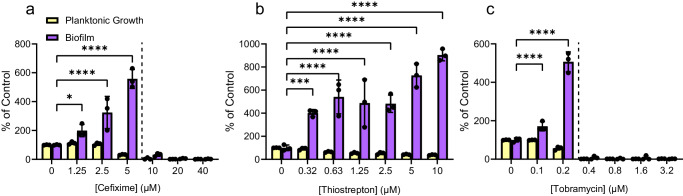
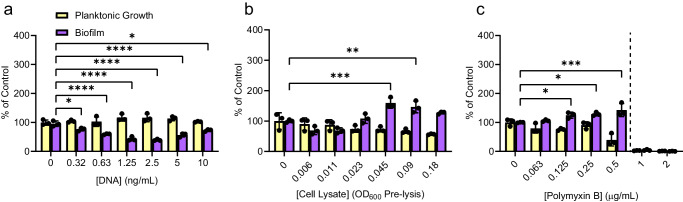
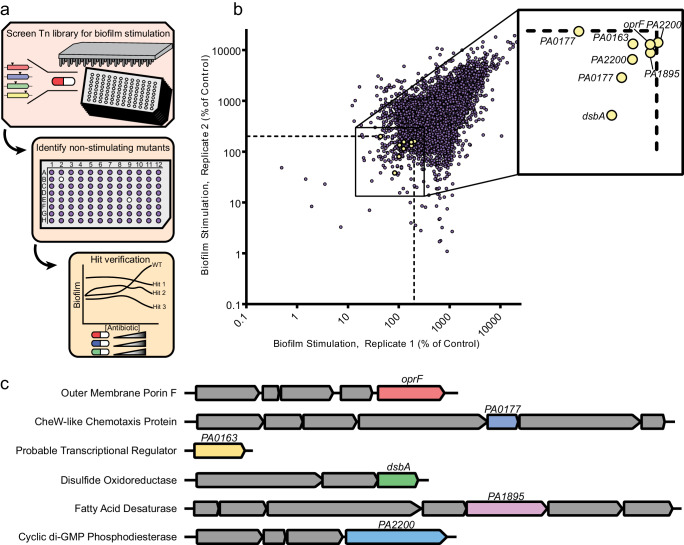
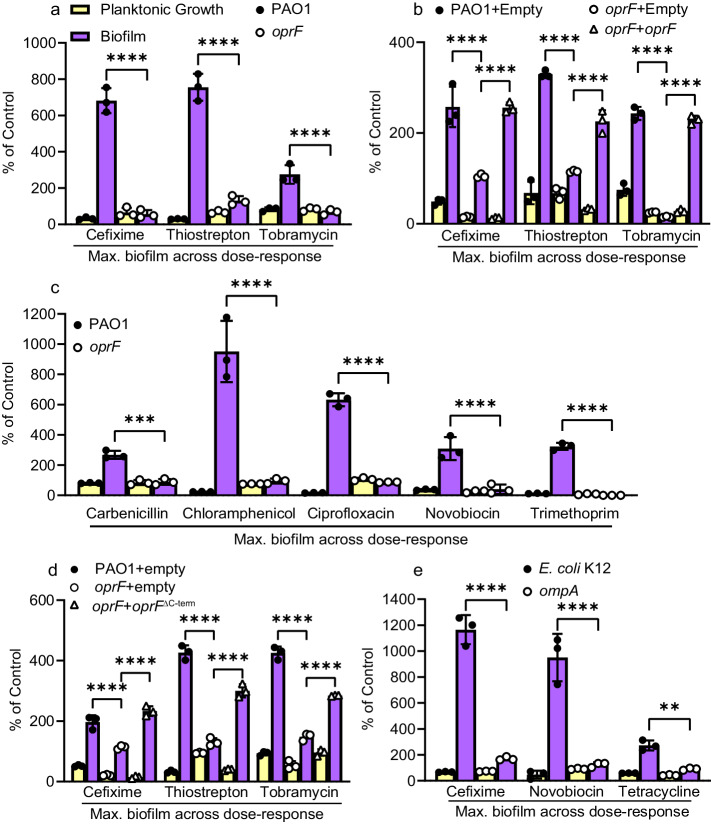
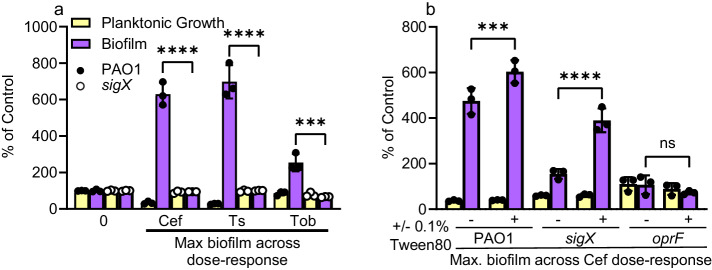
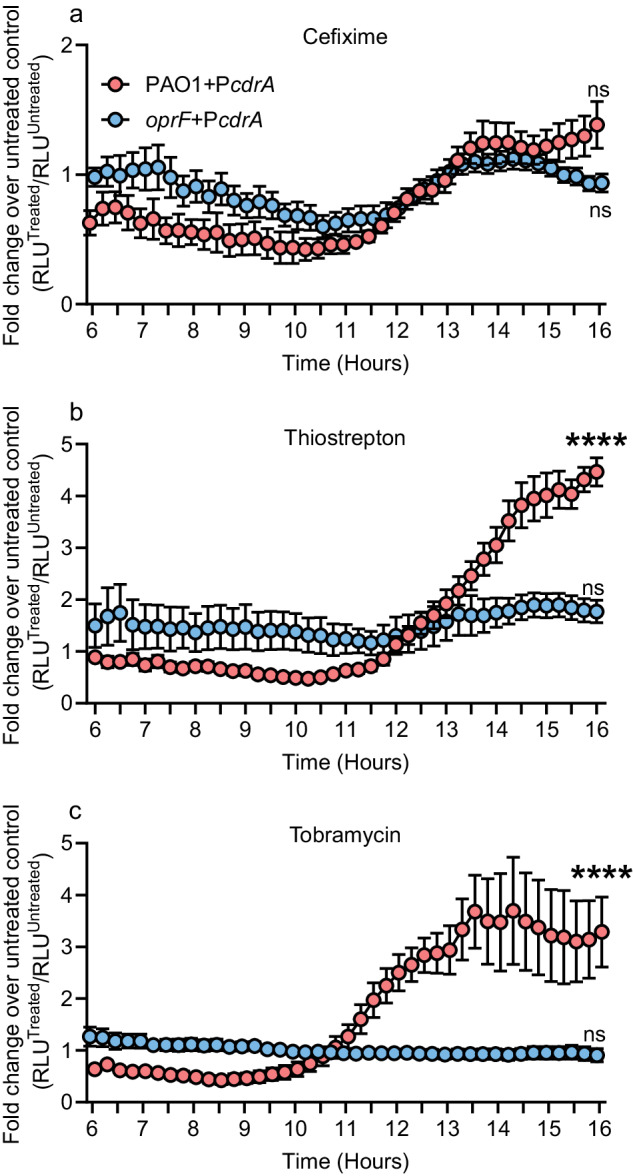
Biofilms are surface-associated communities of bacteria that grow in a self-produced matrix of polysaccharides, proteins, and extracellular DNA (eDNA). Sub-minimal inhibitory concentrations (sub-MIC) of antibiotics induce biofilm formation, potentially as a defensive response to antibiotic stress. However, the mechanisms behind sub-MIC antibiotic-induced biofilm formation are unclear. We show that treatment of Pseudomonas aeruginosa with multiple classes of sub-MIC antibiotics with distinct targets induces biofilm formation. Further, addition of exogenous eDNA or cell lysate failed to increase biofilm formation to the same extent as antibiotics, suggesting that the release of cellular contents by antibiotic-driven bacteriolysis is insufficient. Using a genetic screen for stimulation-deficient mutants, we identified the outer membrane porin OprF and the ECF sigma factor SigX as important. Similarly, loss of OmpA - the Escherichia coli OprF homolog - prevented sub-MIC antibiotic stimulation of E. coli biofilms. Our screen also identified the periplasmic disulfide bond-forming enzyme DsbA and a predicted cyclic-di-GMP phosphodiesterase encoded by PA2200 as essential for biofilm stimulation. The phosphodiesterase activity of PA2200 is likely controlled by a disulfide bond in its regulatory domain, and folding of OprF is influenced by disulfide bond formation, connecting the mutant phenotypes. Addition of reducing agent dithiothreitol prevented sub-MIC antibiotic biofilm stimulation. Finally, activation of a c-di-GMP-responsive promoter follows treatment with sub-MIC antibiotics in the wild-type but not an oprF mutant. Together, these results show that antibiotic-induced biofilm formation is likely driven by a signaling pathway that translates changes in periplasmic redox state into elevated biofilm formation through increases in c-di-GMP.


Conflict of interest statement

The authors declare no competing interests.

Figures

Fig. 1
Fig. 1. Sub-MIC antibiotics stimulate biofilm formation of P. aeruginosa PAO1.
Structurally and functionally diverse antibiotics a cefixime, b thiostrepton, and c tobramycin cause dose-dependent increases in biofilm formation as they approach the minimal inhibitory concentration. A two-way ANOVA followed by a Dunnett’s test was performed to compare the untreated control and each drug treatment. *p < 0.05, **p < 0.01, ***p < 0.001, ****p < 0.0001. Three biological replicates were performed, with 3 technical replicates each. A representative biological replicate is shown, with individual data points shown as black circles and error bars representing the standard deviation. Planktonic growth (OD600, yellow) and biofilm (A600, purple) are both reported as percentage of the vehicle control. Dashed lines indicate the MIC cutoff. Source data are provided in Supplementary Data file 1.
Fig. 2
Fig. 2. Release of cellular contents fails to recapitulate antibiotic-induced biofilm formation.
a Addition of purified genomic DNA from P. aeruginosa PAO1 does not increase biofilm formation at any of the concentrations tested. b Addition of cell lysate does not induce biofilm formation above our cutoff of 200% of control at any of the concentrations tested, although a small yet significant biofilm induction occurs at higher concentrations of lysate. c Sub-MIC polymyxin B is a poor inducer of biofilm formation and fails to induce biofilm above 200% of the untreated control, despite a statistically significant increase in biofilm. A two-way ANOVA followed by Dunnett’s test was performed to compare the untreated control and each drug treatment. *p < 0.05, **p < 0.01, ***p < 0.001, ****p < 0.0001. Three biological replicates were performed with 3 technical replicates each. A representative biological replicate is shown, with individual data points shown as black circles and error bars representing the standard deviation. Planktonic growth (OD600, yellow) and biofilm (A600, purple) are reported as percentage of the untreated-treated control. The dashed line indicates the MIC cutoff. Source data are provided in Supplementary Data file 1.
Fig. 3
Fig. 3. A transposon mutant library screen uncovers genetic determinants of biofilm stimulation by sub-MIC antibiotics.
a A PAO1 transposon library was constructed and arrayed in 96-well format, then screened for biofilm stimulation by ½ MIC cefixime in technical duplicate. Non-stimulated mutants were identified as having an average cefixime-induced biofilm of less than 200% of the vehicle control. Hits were validated in dose-response peg lid assays using cefixime, tobramycin, and thiostrepton and those lacking biofilm stimulation in response all three compounds were selected for follow up. The location of transposon insertions was identified by arbitrarily primed touchdown PCR followed by sequencing. b A replicate plot showing biofilm stimulation by ½ MIC cefixime for the entire transposon library (~13 000 mutants) across both technical replicates. The axes are shown as a log10 scale, and the dashed line shows the 200% of untreated control cutoff for hits. Each mutant is represented by a circle, with yellow circles showing the hits that failed to respond to three different antibiotics in dose-response follow-up assays. The identity of each verified hit is shown in the inset box. c A schematic of the genes that, when disrupted, prevent biofilm formation in response to antibiotics is shown, with the genes of interest in different colors and neighboring genes in gray. The predicted gene product description according to the Pseudomonas database for each hit is on the left. Source data are provided in Supplementary Data Set 1.
Fig. 4
Fig. 4. OprF is required for sub-MIC antibiotic-induced biofilm stimulation.
a Sub-MIC antibiotics fail to stimulate biofilm formation in an oprF::FRT mutant (N = 3). b Expression of OprF from pHERD30T in trans restores (either fully or partially) the biofilm response to sub-MIC cefixime, thiostrepton, and tobramycin (N = 3). c Multiple antibiotics fail to stimulate biofilm formation of an oprF mutant (N = 3). Notably, the oprF mutant was ~16x more sensitive than the wild type to trimethoprim. d Expression of a truncated OprF that lacks the C-terminal PG-binding region (oprFΔC-term) from pHERD30T restores (either fully or partially) antibiotic-induced biofilm formation in an oprF mutant (N = 2). e OmpA, the OprF homolog in E. coli, is required for biofilm stimulation by sub-MIC cefixime, novobiocin, or tetracycline in E. coli K12 (N = 2). Planktonic growth (OD600, yellow) and biofilm (A600, purple) are reported as percentage of the vehicle control. A two-way ANOVA followed by Tukey’s multiple comparisons test was performed for the biofilm formation values for each panel. *p < 0.05, **p < 0.01, ***p < 0.001, ****p < 0.0001. Each biological replicate has 3 technical replicates, and a representative biological replicate is shown with the circle or triangle symbols representing individual data points. The graphs show the maximum amount of biofilm observed from a dose-response assay (such as those shown in Fig. 1) for each antibiotic/strain. Maximum biofilm formation occurred at 5 µM for cefixime, 10 µM for thiostrepton, 0.2 µM for tobramycin, 200 µM carbenicillin, 4 µg/mL for chloramphenicol, 0.25 µg/mL ciprofloxacin, 150 µg/mL novobiocin, and 16 µg/mL trimethoprim. For oprF mutant strains that are not complemented, maximum biofilm formation tended to occur at the lowest concentration of antibiotic as biofilm formation decreased at higher antibiotic concentrations. Error bars represent the standard deviation. Source data are provided in Supplementary Data Set 1.
Fig. 5
Fig. 5. Sub-MIC antibiotics fail to stimulate biofilm formation in a sigX mutant.
a Sub-MIC cefixime, tobramycin, and thiostrepton do not stimulate biofilm formation in a sigX mutant (N = 3). Notably, loss of sigX greatly increases the baseline biofilm formation in the untreated control. A two-way ANOVA followed by Šídák’s multiple comparisons test was performed between the biofilm formation data for PAO1 and the sigX::FRT mutant for each antibiotic in a. Each data point is shown at individual circles, where black circles represent PAO1 and white circles represent sigX::FRT. Cef cefixime, Ts thiostrepton, Tob tobramycin. b Supplementing 0.1% Tween 80 into the media restores biofilm stimulation for a sigX mutant but not an oprF mutant (N = 2). A two-way ANOVA followed by Tukey’s multiple comparisons test was performed for the biofilm formation data in b. ns not significant, *p < 0.05, **p < 0.01, ***p < 0.001, ****p < 0.0001. For both figures, three technical replicates were performed for each biological replicate and data from a representative biological replicate is shown. The graphs show the maximum amount of biofilm observed from a dose-response assay (such as those shown in Fig. 1) for each antibiotic/strain. Planktonic growth (OD600, yellow) and biofilm (A600, purple) are reported as percentage of the untreated control. Error bars represent the standard deviation. Source data are provided in Supplementary Data Set 1.
Fig. 6
Fig. 6. DTT suppresses biofilm stimulation by cefixime, thiostrepton, and tobramycin.
Biofilm stimulation peg-lid assays were performed for a cefixime, b thiostrepton, or c tobramycin in either 10:90 LB (black circles), or 10:90 LB with 0.5 mM DTT (white circles) or 1 mM DTT (white triangles) (N = 2). A two-way ANOVA followed by Tukey’s multiple comparisons test was performed for the biofilm formation data in b. *p < 0.05, **p < 0.01, ***p < 0.001, ****p < 0.0001. Three technical replicates were performed for each biological replicate and data from a representative biological replicate is shown. Planktonic growth (OD600, yellow) and biofilm (A600, purple) are reported as percentage of the untreated control. Error bars represent the standard deviation. Dashed lines indicate the MIC cutoff. Source data are provided in Supplementary Data Set 1.
Fig. 7
Fig. 7. cdrA promoter activity increases following treatment with sub-MIC thiostrepton and tobramycin.
PAO1 or oprF::FRT cells containing pMS402(Empty) or pMS402(PcdrA) were treated with ½ MIC cefixime (a), thiostrepton (b), tobramycin (c) or a vehicle control and monitored for growth and luminescence. Mean relative luminescence (RLU = arbitrary luminescence values divided by OD600) of the treated wells divided by the mean RLU of the matched untreated wells is plotted on the Y-axis as the fold change. The time in hours is plotted on the X-axis and readings were taken every 15 min. Circles represent the mean of six values taken across three biological replicates each performed in technical duplicate. Error bars represent the standard error of the mean. Red and blue circles represent data from PAO1 and oprF::FRT containing pMS402(PcdrA), respectively. Data are plotted as a fold change over the empty vector control, therefore the empty vector data are all equal to one, as they would be a well’s fold change versus itself. A two-way ANOVA followed by Dunnett’s multiple comparisons test was performed to compare each antibiotic treatment condition across the time course to the six-hour time point, and the results of the comparison are shown for the 16-h time point. ns not significant, ****p < 0.0001. Source data are provided in Supplementary Data Set 1.

References

    1. Zilberberg MD, Shorr AF. Prevalence of multidrug-resistant Pseudomonas aeruginosa and carbapenem-resistant Enterobacteriaceae among specimens from hospitalized patients with pneumonia and bloodstream infections in the United States from 2000 to 2009. J. Hosp. Med. 2013;8:559–563. doi: 10.1002/jhm.2080. - DOI - PubMed
    1. Buford VR, Kumar V, Kennedy BR. Relationship of various infection control interventions to the prevalence of multidrug-resistant Pseudomonas aeruginosa among U.S. hospitals. Am. J. Infect. Control. 2016;44:381–386. doi: 10.1016/j.ajic.2015.10.033. - DOI - PubMed
    1. Tacconelli E, et al. Discovery, research, and development of new antibiotics: the WHO priority list of antibiotic-resistant bacteria and tuberculosis. Lancet Infect. Dis. 2017;17:1–10. - PubMed
    1. Pier GB. CFTR mutations and host susceptibility to Pseudomonas aeruginosa lung infection. Curr. Opin. Microbiol. 2002;5:81–86. doi: 10.1016/S1369-5274(02)00290-4. - DOI - PubMed
    1. Ghafoor A, Hay ID, Rehm BHA. Role of exopolysaccharides in Pseudomonas aeruginosa biofilm formation and architecture. Appl. Environ. Microbiol. 2011;77:5238–5246. doi: 10.1128/AEM.00637-11. - DOI - PMC - PubMed

MeSH terms