

Multi-omic integration of microbiome data for identifying disease-associated modules
- PMID: 38521774
- PMCID: PMC10960825
- DOI: 10.1038/s41467-024-46888-3
Multi-omic integration of microbiome data for identifying disease-associated modules
Abstract
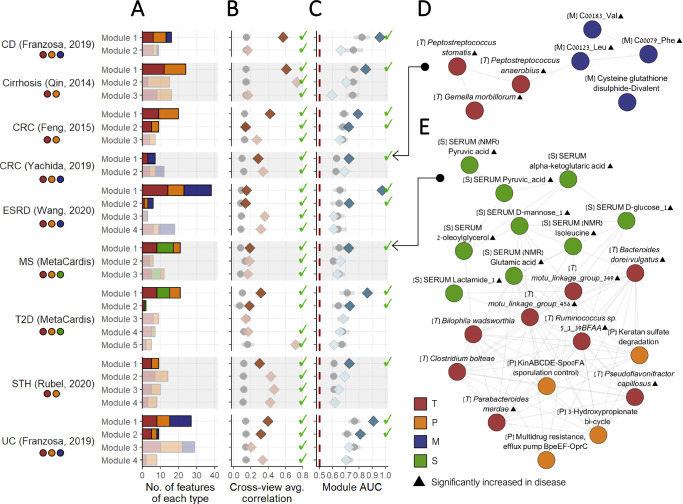
Multi-omic studies of the human gut microbiome are crucial for understanding its role in disease across multiple functional layers. Nevertheless, integrating and analyzing such complex datasets poses significant challenges. Most notably, current analysis methods often yield extensive lists of disease-associated features (e.g., species, pathways, or metabolites), without capturing the multi-layered structure of the data. Here, we address this challenge by introducing "MintTea", an intermediate integration-based approach combining canonical correlation analysis extensions, consensus analysis, and an evaluation protocol. MintTea identifies "disease-associated multi-omic modules", comprising features from multiple omics that shift in concord and that collectively associate with the disease. Applied to diverse cohorts, MintTea captures modules with high predictive power, significant cross-omic correlations, and alignment with known microbiome-disease associations. For example, analyzing samples from a metabolic syndrome study, MintTea identifies a module with serum glutamate- and TCA cycle-related metabolites, along with bacterial species linked to insulin resistance. In another dataset, MintTea identifies a module associated with late-stage colorectal cancer, including Peptostreptococcus and Gemella species and fecal amino acids, in line with these species' metabolic activity and their coordinated gradual increase with cancer development. This work demonstrates the potential of advanced integration methods in generating systems-level, multifaceted hypotheses underlying microbiome-disease interactions.
© 2024. The Author(s).
Conflict of interest statement
The authors declare no competing interests.
Figures


Update of
-
Multi-omic integration of microbiome data for identifying disease-associated modules.bioRxiv [Preprint]. 2024 Jan 23:2023.07.03.547607. doi: 10.1101/2023.07.03.547607. bioRxiv. 2024. Update in: Nat Commun. 2024 Mar 23;15(1):2621. doi: 10.1038/s41467-024-46888-3. PMID: 37461534 Free PMC article. Updated. Preprint.
Similar articles
-
Multi-omic integration of microbiome data for identifying disease-associated modules.bioRxiv [Preprint]. 2024 Jan 23:2023.07.03.547607. doi: 10.1101/2023.07.03.547607. bioRxiv. 2024. Update in: Nat Commun. 2024 Mar 23;15(1):2621. doi: 10.1038/s41467-024-46888-3. PMID: 37461534 Free PMC article. Updated. Preprint.
-
Unfolding and de-confounding: biologically meaningful causal inference from longitudinal multi-omic networks using METALICA.mSystems. 2024 Oct 22;9(10):e0130323. doi: 10.1128/msystems.01303-23. Epub 2024 Sep 6. mSystems. 2024. PMID: 39240096 Free PMC article.
-
Multi-omic approaches for host-microbiome data integration.Gut Microbes. 2024 Jan-Dec;16(1):2297860. doi: 10.1080/19490976.2023.2297860. Epub 2024 Jan 2. Gut Microbes. 2024. PMID: 38166610 Free PMC article. Review.
-
Bacterial community structure alterations within the colorectal cancer gut microbiome.BMC Microbiol. 2021 Mar 31;21(1):98. doi: 10.1186/s12866-021-02153-x. BMC Microbiol. 2021. PMID: 33789570 Free PMC article.
-
Metaproteomic and Metabolomic Approaches for Characterizing the Gut Microbiome.Proteomics. 2019 Aug;19(16):e1800363. doi: 10.1002/pmic.201800363. Epub 2019 Jul 31. Proteomics. 2019. PMID: 31321880 Review.
Cited by
-
Integrating the milk microbiome signatures in mastitis: milk-omics and functional implications.World J Microbiol Biotechnol. 2025 Jan 18;41(2):41. doi: 10.1007/s11274-024-04242-1. World J Microbiol Biotechnol. 2025. PMID: 39826029 Free PMC article. Review.
-
Microbiota-Gut-Brain Axis: Mass-Spectrometry-Based Metabolomics in the Study of Microbiome Mediators-Stress Relationship.Biomolecules. 2025 Feb 7;15(2):243. doi: 10.3390/biom15020243. Biomolecules. 2025. PMID: 40001546 Free PMC article. Review.
-
AI in microbiome-related healthcare.Microb Biotechnol. 2024 Nov;17(11):e70027. doi: 10.1111/1751-7915.70027. Microb Biotechnol. 2024. PMID: 39487766 Free PMC article. Review.
-
Potential of gut microbiota metabolites in treating COPD: network pharmacology and Mendelian randomization approaches.Front Microbiol. 2024 Nov 25;15:1416651. doi: 10.3389/fmicb.2024.1416651. eCollection 2024. Front Microbiol. 2024. PMID: 39654679 Free PMC article.
-
NMFGOT: a multi-view learning framework for the microbiome and metabolome integrative analysis with optimal transport plan.NPJ Biofilms Microbiomes. 2024 Nov 24;10(1):135. doi: 10.1038/s41522-024-00612-7. NPJ Biofilms Microbiomes. 2024. PMID: 39582023 Free PMC article.
References
MeSH terms
Grants and funding
LinkOut - more resources
Full Text Sources
