. 2024 Mar 23;15(1):2612.
doi: 10.1038/s41467-024-46855-y.

Non-catalytic role of phosphoinositide 3-kinase in mesenchymal cell migration through non-canonical induction of p85β/AP2-mediated endocytosis

Affiliations

Non-catalytic role of phosphoinositide 3-kinase in mesenchymal cell migration through non-canonical induction of p85β/AP2-mediated endocytosis

Hideaki T Matsubayashi et al. Nat Commun. .

Abstract

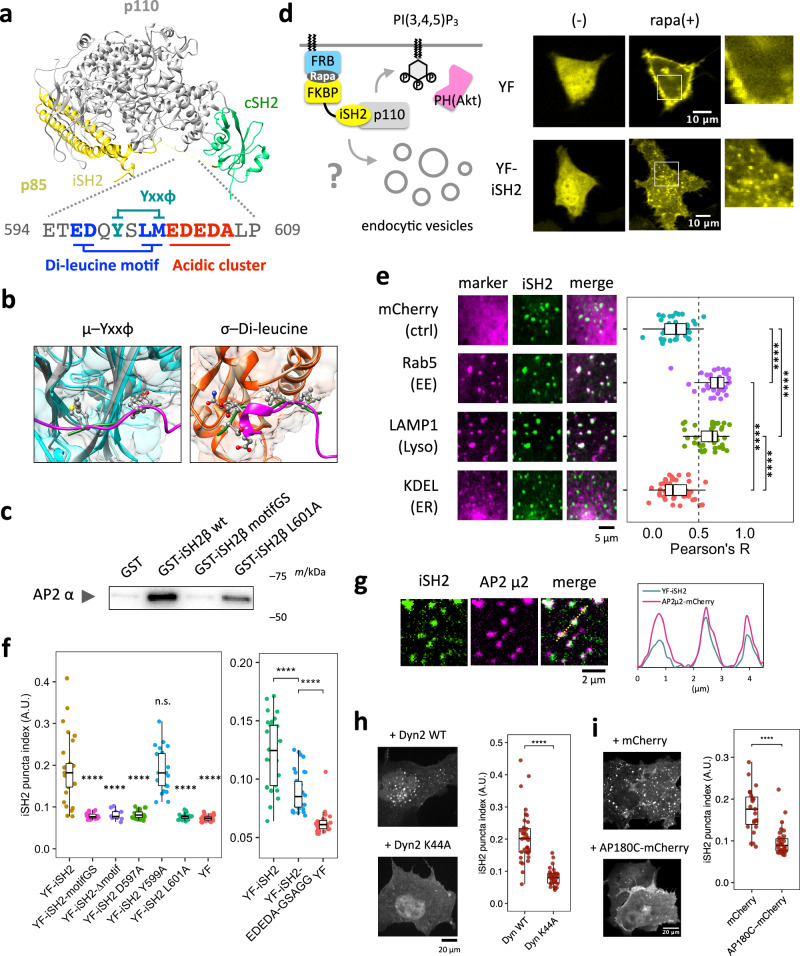
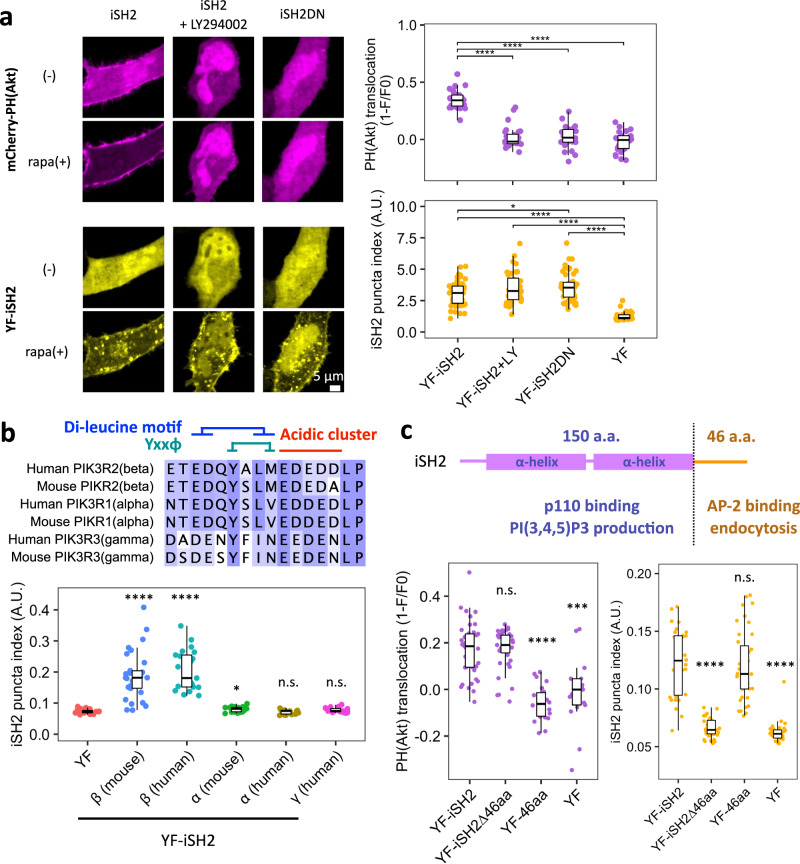
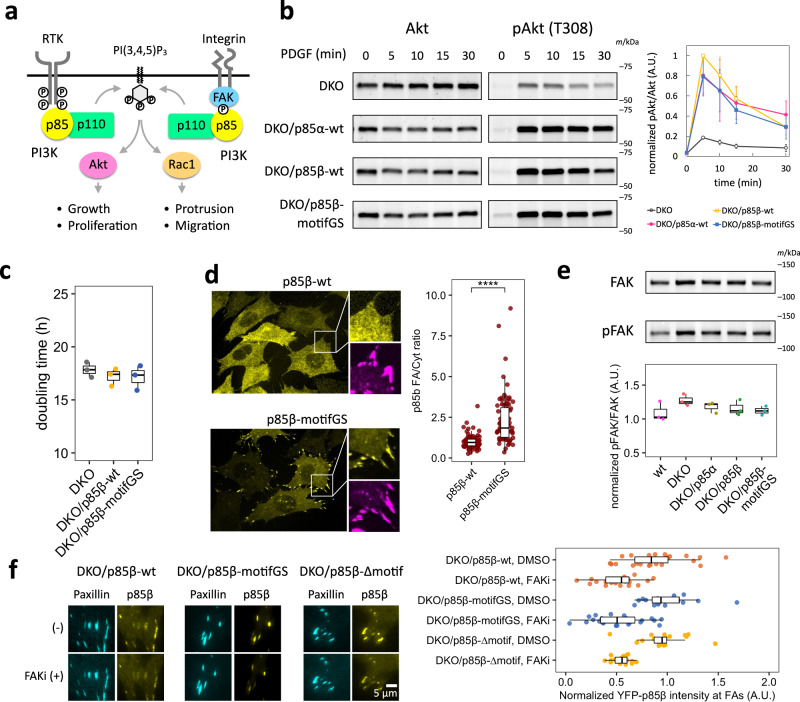
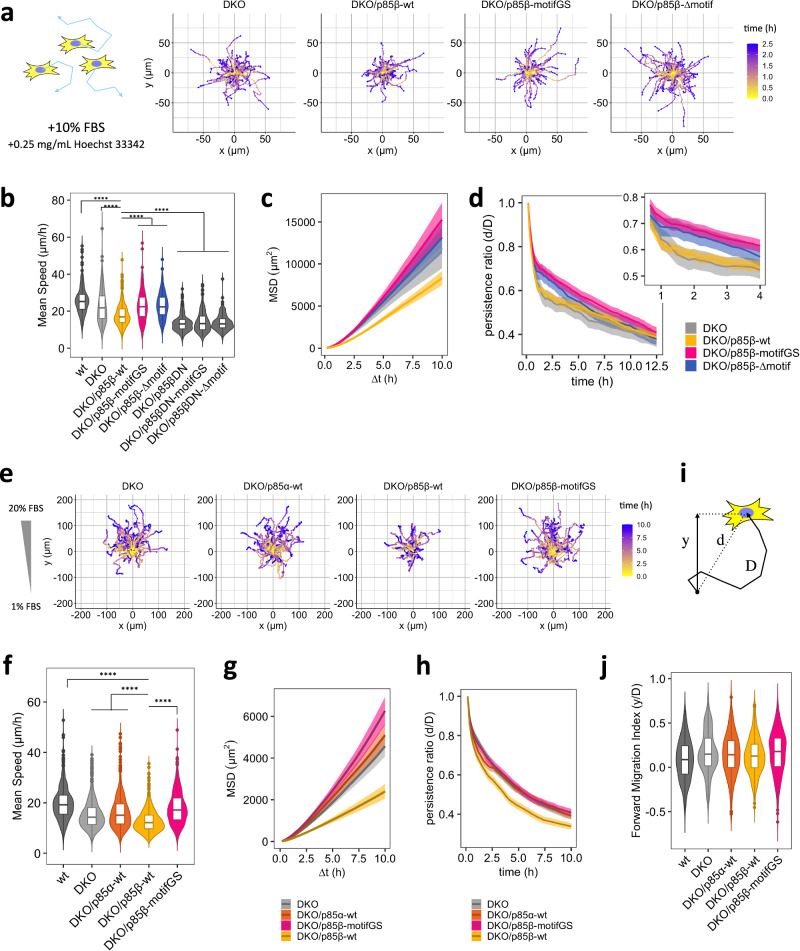
Class IA phosphoinositide 3-kinase (PI3K) galvanizes fundamental cellular processes such as migration, proliferation, and differentiation. To enable these multifaceted roles, the catalytic subunit p110 utilizes the multi-domain, regulatory subunit p85 through its inter SH2 domain (iSH2). In cell migration, its product PI(3,4,5)P3 generates locomotive activity. While non-catalytic roles are also implicated, underlying mechanisms and their relationship to PI(3,4,5)P3 signaling remain elusive. Here, we report that a disordered region of iSH2 contains AP2 binding motifs which can trigger clathrin and dynamin-mediated endocytosis independent of PI3K catalytic activity. The AP2 binding motif mutants of p85 aberrantly accumulate at focal adhesions and increase both velocity and persistency in fibroblast migration. We thus propose the dual functionality of PI3K in the control of cell motility, catalytic and non-catalytic, arising distinctly from juxtaposed regions within iSH2.


Conflict of interest statement

The authors declare no competing interests.

Figures

Fig. 1
Fig. 1. Plasma membrane recruitment of the iSH2 domain induces clathrin and dynamin dependent endocytosis.
a Crystal structure of PI3K (PDB 2Y3A) and the AP2 binding motifs of mouse p85β iSH2 domain. b AF2-predicted structures of the 16 aa iSH2 peptide binding to AP2. Left: rank 2 structure showing the iSH2 YxxΦ motif binding to µ subunit. Right: rank 5 structure showing the iSH2 di-Leucine motif binding to the σ subunit. Gray: AF2-predicted µ subunit, Orange: AF2-predicted σ subunit, Magenta: AF2-predicted 16 aa iSH2 peptide, Cyan and Green (left): µ subunit and TGN38 peptide from PDB 2XA7. Tan and Green (right): σ subunit and CD4 peptide from PDB 2JKR. Motif amino acids are represented in ball-stick model. c Western blot of the AP2 α subunit for pulldown assay using GST-iSH2 and AP2 core. Similar results were obtained from 3 independent experiments. d Confocal images of endocytic vesicles produced by plasma membrane targeting of the iSH2 domain. HeLa cells were transiently transfected with Lyn-ECFP-FRB, mCherry-PH(Akt), and EYFP-FKBP or EYFP-FKBP-iSH2. Images show before and after 100 nM rapamycin addition. Similar results were obtained from more than 3 independent experiments. e Confocal images of iSH2-induced vesicles colocalized with endocytosis marker molecules: mCherry-Rab5 (early endosome) and LAMP1-mRFP (lysosome). mCherry (cytosol) and mCherry-KDEL (ER) were used as negative controls. The graph shows Pearson’s correlation between iSH2 and marker molecules. mCherry, n = 40 cells. Rab5, n = 39 cells. LAMP1, n = 41 cells. KDEL, n = 41 cells. P values: mCherry–Rab5, <1.0 × 10⁻¹². mCherry–LAMP1, <1.0 × 10⁻¹². Rab5–KDEL, <1.0 × 10⁻¹². LAMP–KEDL, 2.4 × 10⁻¹². f Quantified iSH2-mediated endocytosis indices (see Methods) of wild type iSH2 and mutants in AP2 binding motifs. YF-iSH2, n = 29 cells. motifGS, n = 24 cells. ∆motif, n = 12 cells. D597A, n = 24 cells. Y599A, n = 24 cells. L601A, n = 21 cells. YF, n = 31 cells. YF-iSH2, n = 32 cells. EDEDA-GSAGG, n = 33 cells. YF, n = 31 cells. P values: (left) motifGS, 1.1 × 10⁻⁷. ∆motif, 1.0 × 10⁻⁴. D597A, 5.4 × 10⁻⁷. Y599A, 1.0. L601A, 3.1 × 10⁻⁷. YF, 1.7 × 10⁻⁹. (right) YFiSH2–EDEDA-GSAGG, 9.5×10⁻⁶. EDEDA-GSAGG–YF, 3.3 × 10⁻¹⁰. g TIRF images of iSH2 vesicles colocalized with AP2. Similar results were obtained from more than 3 independent experiments. h, i Confocal images of iSH2 vesicles showing dynamin and clathrin dependency. Vesicle formation was suppressed in the presence of the dominant negative form of dynamin (K44A) or AP180C. Dyn WT, n = 37 cells. Dyn K44A, n = 37 cells. mCherry, n = 30 cells. AP180C-mCherry, n = 40 cells. P values: (h) 5.3 × 10⁻¹², (i) 1.2 × 10⁻⁷. Box whisker plots represent median, 1st, 3rd quartiles and 1.5×inter-quartile range. P values: *: <0.05, **: <0.01, ***: <0.001, ****: <0.0001. n.s.: not significant. e, f Steel-Dwass test (two sided). In the left panel of (f), only p values against YF-iSH2 are shown. h, i Wilcoxon rank sum test (two sided).
Fig. 2
Fig. 2. iSH2-mediated endocytosis is independent of PI3K catalytic activity and the C-terminal 46 aa region is necessary and sufficient.
a Confocal images of PI(3,4,5)P3 sensor PH(Akt) and iSH2 vesicles. Quantifications are shown on the right. LY294002: PI3K inhibitor (50 µM), iSH2(DN): deletion mutant lacking p110 binding site. YF-iSH2, n = 59 cells. YF-iSH2+LY, n = 36 cells. YF-iSH2DN, n = 47 cells. YF, n = 43 cells. P value of PH(Akt) translocation: YF-iSH2–YFiSH2-LY, 8.6×10⁻¹⁰. YF-iSH2–YFiSH2DN, 7.0×10⁻¹⁰. YF-iSH2–YF, 8.8×10⁻¹⁰. P value of iSH2 puncta index: YF-iSH2–YFiSH2DN, 0.049. YF-iSH2–YF, <1.0×10⁻¹². YF-iSH2+LY–YF, <1.0×10⁻¹². YF-iSH2DN–YF, <1.0×10⁻¹². b Top: Amino acid sequence alignment of the AP2 binding motif region of human and mouse p85α, p85β, p55γ isoforms. Bottom: Quantification of iSH2 vesicles produced by each isoform. YF, n = 31 cells. β (mouse), n = 29 cells. β (human), n = 21 cells. α (mouse), n = 23 cells. α (human), n = 17 cells. γ (mouse), n = 19 cells. P values: β (mouse), 1.2×10⁻⁹. β (human), 1.9×10⁻⁸. α (mouse), 0.029. α (human), 0.99. γ (mouse)=0.29. c Secondary structure of the mouse p85β iSH2 domain and quantification of PH(Akt) translocation and iSH2 vesicles. YF-iSH2, n = 32 cells. YF-iSH2∆46aa, n = 38 cells. YF-46aa, n = 39 cells. YF, n = 31 cells. P value of PH(Akt) translocation: YF-iSH2∆46aa, 0.99. YF-46aa, 1.6×10⁻⁸. YF, 2.0×10⁻⁴. P value of iSH2 puncta index: YF-iSH2∆46aa, 4.4×10⁻¹¹. YF-46aa, 0.96. YF, 3.1×10⁻¹⁰. Box whisker plots represent median, 1st, 3rd quartiles and 1.5×inter-quartile range. P values: *: <0.05, **: <0.01, ***: <0.001, ****: <0.0001. n.s.: not significant. Only p values against YF are shown in (b). Only p values against YF-iSH2 are shown in (c). ac Steel-Dwass test (two sided).
Fig. 3
Fig. 3. Mutation in AP2 binding motifs of p85β increases focal adhesion localization.
a Schematic of receptor tyrosine kinase-dependent and focal adhesion-dependent PI3K pathways. b Western blot of total- and phospho-Akt (T308) and its quantification. Cells were treated with 50 ng/mL PDGF for indicated time. pAkt/Akt level was normalized to DKO/p85β-wt 5 min. Data are presented as mean ± standard deviations. c Doubling time of DKO and p85 rescued MEF cells. d Confocal images of p85β-wt and p85β-motifGS cells and their quantification. Yellow: EYFP-p85β, Magenta: immunofluorescence against vinculin. p85β-wt, n = 70 cells. p85β-motifGS, n = 80 cells. P value: 6.8×10⁻¹⁵. e Western blot of total- and phospho-FAK (Y397) and its quantification. f FAK activity dependency of p85 focal adhesion localization. Cells were treated with DMSO or 10 µM PF-573228 (FAK inhibitor; FAKi) for 5 min and EYFP-p85β intensity were divided by the values of time=0. p85β-wt DMSO, n = 27 cells. p85β-wt FAKi, n = 20 cells. p85β-motifGS DMSO, n = 16 cells. p85β-motifGS FAKi, n = 23 cells. p85β-∆motif, n = 20 cells. p85β-∆motif FAKi, n = 18 cells. b, c, e n = 3 independent experiments. Box whisker plots represent median, 1st, 3rd quartiles and 1.5×inter-quartile range. P value: ****: <0.0001. d Wilcoxon rank sum test (two sided).
Fig. 4
Fig. 4. Mutation in AP2 binding motifs of p85β enhances cell motility in random and chemotactic migration.
a Representative tracks of 2D random migration on fibronectin coated plates. Cells were allowed to migrate at 37 °C with 5% CO2 and 10% FBS. 0.25 mg/mL Hoechst 33342 was used for tracking cells. b, c, d Quantification of migration parameters. MSD: mean square displacement. Error bars in (c) and (d) represent 2×SEM (95% CI). e Representative tracks of chemotaxis in µ-Slide chemotaxis chamber (ibidi). Cells were allowed to migrate at 37 °C with 5% CO2 in the presence of 1–20% FBS gradient. 0.25 mg/mL Hoechst 33342 was used for tracking cells. f, g, i, j Quantification of migration parameters. Error bars in (g and i) represent 2×SEM (95% CI). h Schematic of displacement: d, distance: D, and forward displacement: y. Persistence ratio was defined as d/D, while Forward migration index was defined as y/D. Box whisker plots represent median, 1st, 3rd quartiles and 1.5×inter-quartile range. b, f, j Data were obtained from 3 or more independent experiments. In each experiment, n > 100 cells were analyzed for each cell lines. Steel-Dwass test (two sided) was performed and p values against DKO/p85β-wt were indicated. P values indicated as **** in (b) and (f) were <1.0×10⁻¹². In (j), p values of Steel-Dwass test were 6.0×10⁻⁴ for wt-DKO, 0.041 for wt-DKO/p85α-wt, and 9.0 × 10⁻⁴ for wt-DKO/p85β-motifGS, respectively, while the other pairs were not significant.

Update of

References

    1. Vanhaesebroeck B, Guillermet-Guibert J, Graupera M, Bilanges B. The emerging mechanisms of isoform-specific PI3K signalling. Nat. Rev. Mol. Cell Biol. 2010;11:329–341. doi: 10.1038/nrm2882. - DOI - PubMed
    1. Fruman DA, et al. The PI3K pathway in human disease. Cell. 2017;170:605–635. doi: 10.1016/j.cell.2017.07.029. - DOI - PMC - PubMed
    1. Marat AL, Haucke V. Phosphatidylinositol 3‐phosphates—at the interface between cell signalling and membrane traffic. EMBO J. 2016;35:561–579. doi: 10.15252/embj.201593564. - DOI - PMC - PubMed
    1. Bilanges B, Posor Y, Vanhaesebroeck B. PI3K isoforms in cell signalling and vesicle trafficking. Nat. Rev. Mol. Cell Biol. 2019;20:515–534. doi: 10.1038/s41580-019-0129-z. - DOI - PubMed
    1. Bear JE, Haugh JM. Directed migration of mesenchymal cells: Where signaling and the cytoskeleton meet. Curr. Opin. Cell Biol. 2014;30:74–82. doi: 10.1016/j.ceb.2014.06.005. - DOI - PMC - PubMed

MeSH terms

Substances