. 2024 Mar 23;15(1):2627.
doi: 10.1038/s41467-024-45977-7.

Expression of USP25 associates with fibrosis, inflammation and metabolism changes in IgG4-related disease

Affiliations

Expression of USP25 associates with fibrosis, inflammation and metabolism changes in IgG4-related disease

Panpan Jiang et al. Nat Commun. .

Abstract

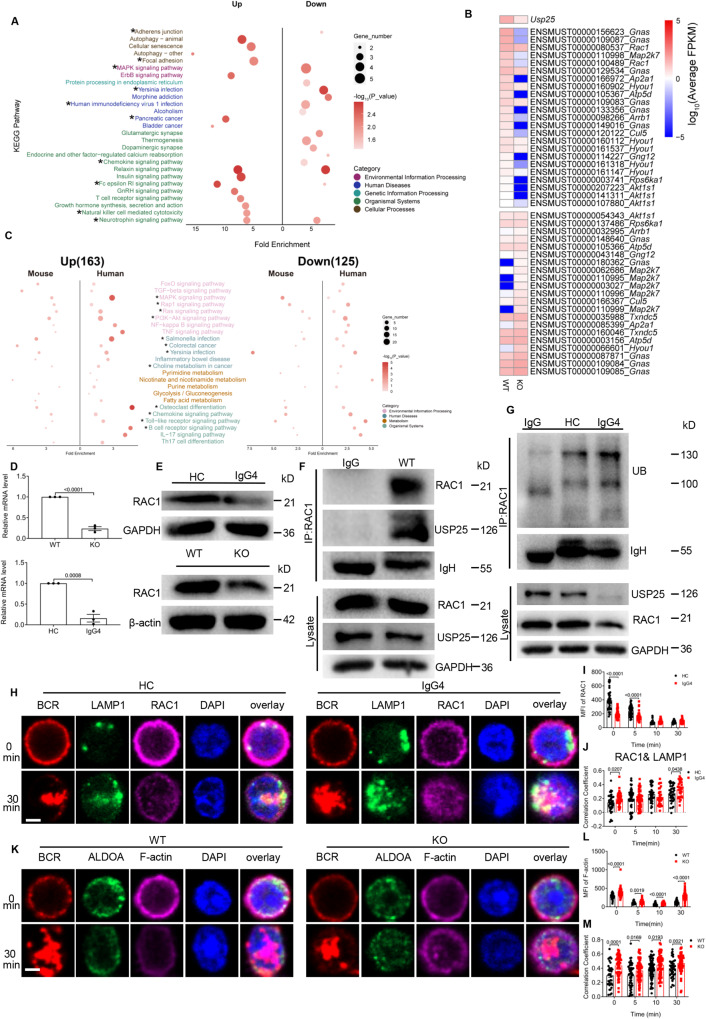
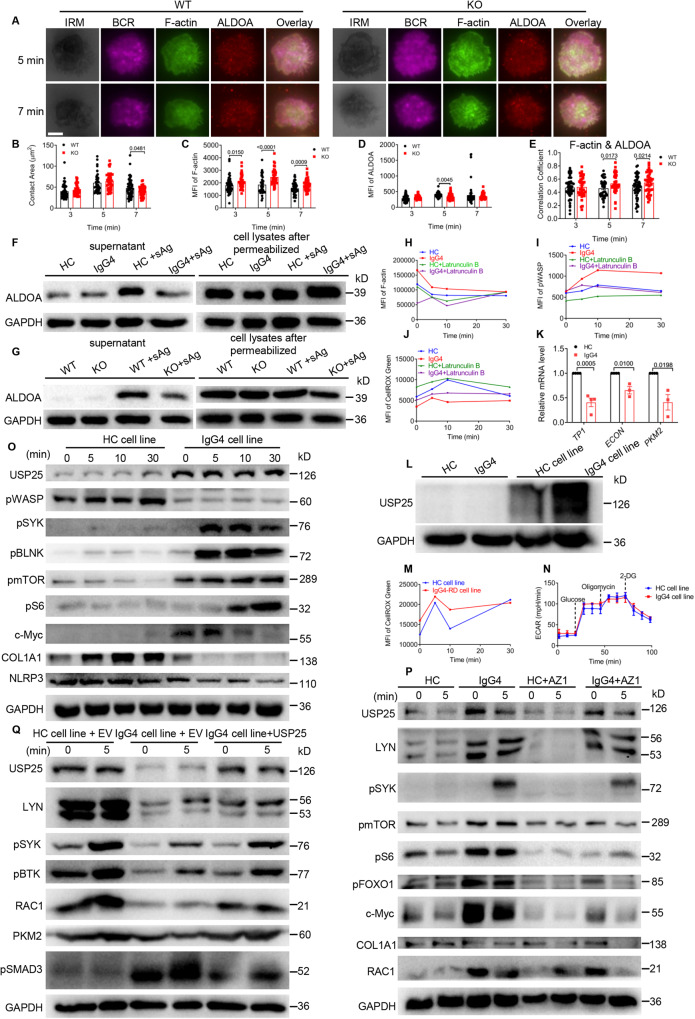
IgG4-related disease (IgG4-RD) has complex clinical manifestations ranging from fibrosis and inflammation to deregulated metabolism. The molecular mechanisms underpinning these phenotypes are unclear. In this study, by using IgG4-RD patient peripheral blood mononuclear cells (PBMCs), IgG4-RD cell lines and Usp25 knockout mice, we show that ubiquitin-specific protease 25 (USP25) engages in multiple pathways to regulate fibrotic and inflammatory pathways that are characteristic to IgG4-RD. Reduced USP25 expression in IgG4-RD leads to increased SMAD3 activation, which contributes to fibrosis and induces inflammation through the IL-1β inflammatory axis. Mechanistically, USP25 prevents ubiquitination of RAC1, thus, downregulation of USP25 leads to ubiquitination and degradation of RAC1. Decreased RAC1 levels result in reduced aldolase A release from the actin cytoskeleton, which then lowers glycolysis. The expression of LYN, a component of the B cell receptor signalosome is also reduced in USP25-deficient B cells, which might result in B cell activation deficiency. Altogether, our results indicate a potential anti-inflammatory and anti-fibrotic role for USP25 and make USP25 a promising diagnostic marker and potential therapeutic target in IgG4-RD.


Conflict of interest statement

Xin.Zh., Xia.Zh., and J.L. were employed by GeneMind Biosciences Company Limited, Shenzhen, China. Heather Miller was employed by Cytek Biosciences, R&D Clinical Reagents, Fremont, CA, United States. The remaining authors declare no competing interests.

Figures

Fig. 1
Fig. 1. IgG4-RD patients have altered B cell homeostasis in the peripheral blood.
AD Flow cytometry analysis of subpopulations of B cells from PBMCs of HCs and patients. The percentages of B cell subsets (C) (HCs=24, patients=25) and MFI of CD19 (D) (n = 21) were analyzed in PBMCs from HCs and patients. E Relative mRNA level of CD19 was measured in total B cells, memory B cells and naive B cells from HCs and patients after sorting by RT-PCR (n = 3). FH Analysis of the MFI of BAFF-R (F) (n = 6), the percentages of annexin V (G) (n = 8) and KI-67 (H) (n = 5) of the subpopulations of PBMCs from patients and HCs by Flow cytometry. IK Memory B (CD27+) cells and naive (CD27) B cells of HCs and patients were incubated with tethered to lipid bilayers for 3 and 5 min at 37 °C. Then cells were fixed, permeabilized and stained for AF647 anti-CD27, pBTK, and pY. The B cells were analyzed for the MFI of pY (K) and pBTK (J) by TIRFm (scale bar = 2.5 μm). L Western blot showing the levels of pBTK, pSHIP, BTK, and SHIP in B cells of patients and HCs. Representative results are shown. MO B cells of patients and HCs were treated in the same way as in (I) except stained for pWASP and F-actin. The MFI of F-actin (N) and pWASP (O) were analyzed by TIRFm (scale bar = 2.5 μm). P Immunoblot showing the levels of pWASP and WASP in PBMCs of patients and HCs. Representative results are shown. QS Filopodia dilatation visualized using SEM (Q). Cells were analyzed for the number (R) (HCs=13, patients = 9) and length (S) (HCs = 33, patients = 34) of filopodia (scale bar = 5 μm). All images were representative images from 3 independent experiments. Data points in (CH, J, K, N, O, R, and S) are represented as Mean ± SED. Statistical significance was based on two-tailed unpaired Student’s t-test. Relevant p values are given in the graph. *P < 0.05; **P < 0.01; ***P < 0.001. Source data are provided as a Source Data file.
Fig. 2
Fig. 2. IgG4-RD patients have immunocompromise corresponding to reduced USP25 expression.
A Enriched KEGG pathway interaction networks in B cells from HCs and patients (n = 5). B, C Integration analysis results of IgG4-RD and HCs, showing the B cell clusters (B) and status (C) (n = 3). D Dot plot showing the expression of selected canonical cell markers in the 11 B cell subsets in patients and HCs. E The expression level of USP25 on B cell subsets in IgG4-RD and HCs showed by UMAP separately (n = 3). F Relative mRNA level of USP25 was measured in total B cells (n = 5), memory B cells (n = 3) and naive B cells (n = 3) from HCs and patients after sorting. G, H Purified B cells of patients and HCs were stimulated, fixed, permeabilized, and stained for USP25 (scale bar = 2.5 μm). The correlation coefficient between BCR and USP25 was quantified using more than 47–101 individual cells (H). I Western blots of USP25 in purified B cells from HCs and patients. J Western blots of USP25, LYN, pSYK, SYK, pBLNK and BLNK in PBMCs. K Western blots of USP25 levels in purified B cells from WT and Usp25 KO mice. L Western blots of LYN, pSYK, SYK, pBLNK, BLNK, pSHIP, SHIP, pWASP, and WASP in B cells of WT and Usp25 KO. M Immunoassay of lysates of WT cells treated with 10 µg/ml sAg for 5 min, followed by immunoprecipitation with LYN and immunoblot analysis of USP25. N Immunoassay of lysates of WT and Usp25 KO B cells treated in the same way as in (M), followed by immunoprecipitation with LYN and immunoblot analysis with Ubiquitin. O Immunoblot showing the levels of USP25, LYN, pAKT, pFOXO1 and pS6. PBMCs were treated with 25 μM of MG132 at 37 °C for 30 min before incubating in the same way as in (Fig. 1J) for 5 min. All images were representative images from 3 independent experiments. Data points in (E, F, and H) are represented as Mean ± SED. Statistical significance was based on two-tailed unpaired Student’s t-test and wilcoxon rank sum test. Relevant p values are given in the graph. *P < 0.05; **P < 0.01; ***P < 0.001. Source data are provided as a Source Data file.
Fig. 3
Fig. 3. USP25 deficiency causes the increase of IgG1.
AC Flow cytometry analysis of IgG1 in B cells, PC and PBC from WT and Usp25 KO mice after stimulating with 8 ng/ml IL4 plus 10 μg/ml of CD40 for 120 h and 10 μg/ml of LPS for 72 h and shown are representative dot plots (A). The percentages of B cells (B), PC and PBC (C) were analyzed from WT and Usp25 KO mice (n = 6). D The level of IgG1 in PC and PBCs culture supernatant of WT and Usp25 KO mice was quantified by ELISA (n = 4). E B cells of Usp25 KO and WT mice were cultured with LPS (10 μg /mL). Total RNA was isolated after 2 days of culture and the GLTγ1 and GAPDH levels were measured by RT-PCR (n = 3). F-H Flow cytometry analysis of IgG1 in PBC (G) and PC (H) from Usp25 KO and WT mice after LCMV infection (n = 5). Shown are representative dot plots (F). I Quantification of IgG1 antibody levels in the serum of WT and Usp25 KO mice after infection with LCMV by ELISA (n = 5). J The OD of NP-IgG1 after immunized mice was quantified using ELISA (n = 4). KM Flow cytometry analysis of IgG1 in B cells (L), PC and PBC (M) from Mb1cre+/-Btkfl/+ and Mb1cre+/-Btkfl/fl mice after stimulating in the same way as in (3 A) (n = 4). Shown are representative dot plots (K). N The level of IgG1 in PC and PBC culture supernatant of Mb1cre+/-Btkfl/+ and Mb1cre+/-Btkfl/fl mice was quantified by ELISA (n = 5). O The GLTγ1 level was measured in the same way as in (3E) in Mb1cre+/-Btkfl/+ and Mb1cre+/-Btkfl/fl mice (n = 3). P IgG1 antibody levels in the serum of Mb1cre+/-Btkfl/+ and Mb1cre+/-Btkfl/fl mice were quantified by ELISA (n = 5). Data points in (B, C, D, E, G, I, J, L, M, N, and O) are represented as Mean ± SED. Statistical significance was based on two-tailed unpaired Student’s t-test. Relevant p values are given in the graph. *P < 0.05; **P < 0.01; ***P < 0.001. Source data are provided as a Source Data file.
Fig. 4
Fig. 4. Inflammation in IgG4-RD patients is mediated via the IL-1β inflammasome axis.
AD Masson staining of pancreatic (B, n = 4), kidney (C, n = 5), and liver (D, n = 5) tissues and the percentage of the fibrotic area from WT and Usp25 KO mice (scale bar = 100 μm). Shown are representative dot plots (A). E IL-13 levels in the serum of Usp25 KO and WT mice were quantified by ELISA (n = 15). F, G Purified B cells from HCs and IgG4-RD patients were pre-incubated with 25 μM of MG132 at 37 °C for 30 min and then stimulated in the same way as in (Fig. 2G) except stained for pSMAD3 and nuclei using DAPI (scale bar = 2.5 μm) and shown are representative images captured using confocal (F). The MFI of pSMAD3 was analyzed (G). H Western blots of pSMAD3, SMAD3, COL1A1, and fibronectin (FN) in PBMCs of IgG4-RD patients and HCs stimulated with sAg for designated times. I Immunoblot showing the levels of TRAF6, caspase-1, NLRP3, and IL-1β in PBMCs from HCs and IgG4-RD patients. J Western blots of pNF-κB, pIKKB, NF-κB, and IKKB in PBMCs from HCs and IgG4-RD patients stimulated with sAg for designated times. K IL-1β levels in the serum of Usp25 KO and WT mice were quantified by ELISA (n = 13). L, M H&E staining results of lung tissues from WT and Usp25 KO mice (L) and western blot analysis of the levels of caspase-1, NLRP3, and IL-1β in B cells from WT and Usp25 KO mice (M) after being injected (i.p.) with 10 mg/kg of LPS for 24 h (Scale bar, 200 μm). All images were representative images from 3 independent experiments. Data points in (B, C, D, E, G, and K) are represented as Mean ± SED. Statistical significance was based on two-tailed unpaired Student’s t-test. Relevant p values are given in the graph. *P < 0.05; **P < 0.01; ***P < 0.001. Source data are provided as a Source Data file.
Fig. 5
Fig. 5. USP25 deficiency affects B cell metabolism in IgG4-RD patients through the PI3K-AKT pathway.
A Western blot of pPI3K, pAKT, PI3K, AKT, PKM2, HIF-1α, c-Myc, pSTAT5 and STAT5 in PBMCs. B, C OCR (B) and ECAR (C) detection of B cells (n = 3). D The mitochondrial structure of B cells were analyzed by TEM (scale bar = 1 μm-500 nm). EI Purified B cells were stimulated in the same way as in (Fig. 2G) except stained for Mito and ER (scale bar = 2.5 μm). The B cells were analyzed for MFI of ER (F) and Mito (G). The correlation coefficient of ER/BCR (H) and Mito/BCR was analyzed (I). J, K Purified B were pre-incubated with 10 µg/ml sAg for 24 h at 37 °C and then stained for anti-CD19 and PK Mito. Confocal analysis of the MFI of PK Mito in CD19+ cells (scale bar = 2.5 μm) (K). L Purified splenic B cells were stimulated with 10 μg/ml sAg for 24 h at 37 °C, stained for anti-B220 and mitotracker, and then analyzed for the MFI of mitotracker Green in B220 + B cells (n = 3). M PBMCs were stimulated in the same way as in (5 J) except stained for anti-CD19 and mitotracker, and then CD19 + B cells were analyzed for the MFI of mitotracker Green (n = 3). N PBMCs were stimulated, and stained for anti-CD19 and CellIROX Green, and then CD19 + B cells were analyzed for the MFI of CellIROX Green using flow cytometry (n = 3). O Cluster analysis of the differentially expressed genes in the serum of WT and Usp25 KO mice is presented in the form of a heatmap (n = 3). P Top enriched up-regulated and down-regulated KEGG pathways for differentially expressed metabolite in the serum of Usp25 KO and WT mice. QT The serum levels of glutamic (n = 4) and cysteine (n = 15) were detected in mice and patients respectively. All images were representative images from 3 independent experiments. Data points in (B, C, F, G, HI, K, L, Q, R, S, and T) are represented as Mean ± SED. Statistical significance was based on two-tailed unpaired Student’s t-test. Relevant p values are given in the graph. *P < 0.05; **P < 0.01; ***P < 0.001. Source data are provided as a Source Data file.
Fig. 6
Fig. 6. RAC1 participates in the regulation of glucose metabolism in B cells.
A Top 15 enriched up-regulated and down-regulated KEGG pathways for DETs in Usp25 KO mice models (n = 3). Asterisks represent the pathways associated with the RAC1 transcripts. B Heatmap showing the expression change of transcripts involved in the down-regulated KEGG pathways in mouse models. C KEGG pathway enrichment analysis of DETs in patients and mouse models. Asterisks represent the pathways associated with the RAC1 gene (n = 5). D, E The mRNA levels (D) and protein (E) levels of HCs and IgG4-RD patients / Usp25 KO and WT were analyzed by RT-PCR and Western blot, respectively (n = 3). F WT B cell lysates immunoprecipitated with RAC1 and immunoblotted for USP25. G HCs and IgG4-RD patients B cell lysates immunoprecipitated with RAC1 and immunoblotted for Ubiquitin. HJ Purified B cells of IgG4-RD patients and HCs were stimulated in the same way as in (Fig. 2G) except stained for LAMP1 and RAC1 (scale bar = 2.5 μm) and shown are representative images captured using confocal (H). The B cells were analyzed for the MFI of RAC1 (I) and the correlation coefficient of LAMP1/ RAC1 (J). KM Purified B cells from Usp25 KO and WT were stimulated with 10 μg/ml AF 594-F(ab′)2 Ig (M  + G), fixed, permeabilized, and stained for ALDOA, F-actin, and nuclei using DAPI (scale bar =2.5 μm) and shown are representative images captured using confocal (K). B cells were analyzed for the MFI of F-actin (L) and the correlation coefficient between F-actin and ALDOA (M). All images were representative images from 3 independent experiments. Data points in (D, I, J, L, and M) are represented as Mean ± SED. Statistical significance was based on two-tailed unpaired Student’s t-test. Relevant p values are given in the graph. *P < 0.05; **P < 0.01; ***P < 0.001. Source data are provided as a Source Data file.
Fig. 7
Fig. 7. Overexpressing USP25 in IgG4-RD cell line rescues the clinical phenotype of IgG4-RD patients.
AE TIRFm analysis of the MFI of F-actin, ALDOA and the correlation coefficient between F-actin and ALDOA (scale bar = 2.5 μm). F, G PBMCs and splenic B cells were pre-incubated with sAg for 24 h and then permeabilized with 30 μg/ml of digitonin for 5 min and the protein levels of ALDOA in the supernatant and lysates were analyzed. H, I PBMCs were pre-incubated with 10 μM of Latrunculin B for 2 h at 37 °C and then incubated with anti-CD19, followed by stimulation with sAg. PBMCs were stained with F-actin and pWASP after fixation and permeabilisation, and analyzed (n = 3). J PBMCs were pre-incubated in the same way as in (Fig. 7H) except stained for anti-CD19 and CellIROX Green and the MFI of CellIROX Green were analyzed (n = 3). K RT-PCR was used to analyze the mRNA levels of TP1, ECON, and PKM2 in purified B cells (n = 3). L Western blot of USP25 in PBMCs and cell lines. M Cell lines were analyzed for the MFI of CellIROX Green in the same way as in (Fig. 5N). N ECAR detection of B cells from HC cell line and IgG4-RD cell line (n = 3). O Western blot of USP25, pWASP, pSYK, pBLNK, pmTOR, pS6, c-MYC, COL1A1, and NLRP3 in B cells of HC cell line and IgG4-RD cell line stimulated with sAg for designated times. P HC cell line and IgG4-RD cell line were pre-incubated with 10 µM of AZ1 for 1 h at 37 °C and then stimulated with sAg for 5 min. The protein levels of USP25, LYN, pSYK, pmTOR, pS6, pFOXO1, c-MYC, COL1A1 and RAC1 were analyzed. Q After overexpression of phage-6tag-USP25 or the empty vector in IgG4-RD cell line or HC cell line by lentiviral transfection, the protein levels of USP25, pBTK, LYN, pSYK, RAC1, PKM2, and pSMAD3 were analyzed (EV=Empty Vector). All images were representative images from 3 independent experiments. Data points in (BE, K) are represented as Mean ± SED. Statistical significance was based on two-tailed unpaired Student’s t-test. Relevant p values are given in the graph. *P < 0.05; **P < 0.01; ***P < 0.001. Source data are provided as a Source Data file.

Similar articles

Cited by

References

    1. Al-Khalili OM, Erickson AR. IgG-4 related disease: an introduction. Mol. Med. 2018;115:253–256. - PMC - PubMed
    1. Umehara H, et al. A novel clinical entity, IgG4-related disease (IgG4RD): general concept and details. Mod. Rheumatol. 2012;22:1–14. doi: 10.3109/s10165-011-0508-6. - DOI - PMC - PubMed
    1. Pillai S, Perugino C, Kaneko N. Immune mechanisms of fibrosis and inflammation in IgG4-related disease. Curr. Opin. Rheumatol. 2020;32:146–151. doi: 10.1097/BOR.0000000000000686. - DOI - PubMed
    1. Della-Torre E, et al. B lymphocytes directly contribute to tissue fibrosis in patients with IgG(4)-related disease. J. Allergy Clin. Immunol. 2020;145:968–981.e914. doi: 10.1016/j.jaci.2019.07.004. - DOI - PMC - PubMed
    1. De Sainte Marie B, et al. Pathophysiology of IgG4-related disease: A T follicular helper cells disease? Presse Med. 2020;49:104013. doi: 10.1016/j.lpm.2020.104013. - DOI - PubMed