. 2024 Mar 23;15(1):2609.
doi: 10.1038/s41467-024-46990-6.

Activation of the insulin receptor by insulin-like growth factor 2

Affiliations

Activation of the insulin receptor by insulin-like growth factor 2

Weidong An et al. Nat Commun. .

Abstract

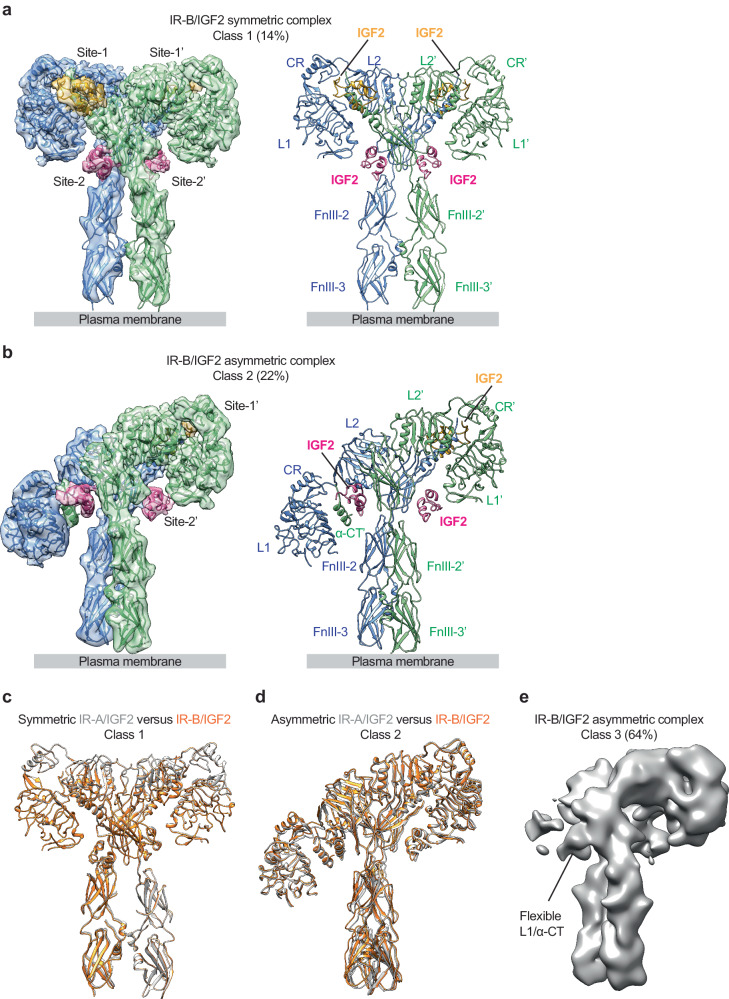
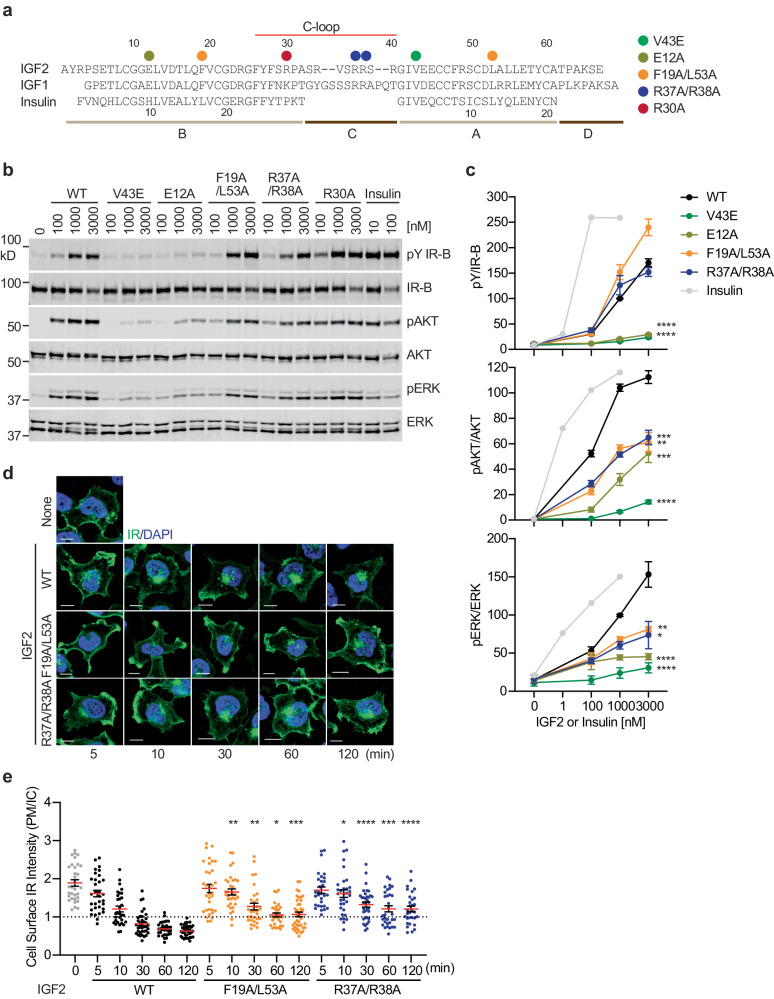
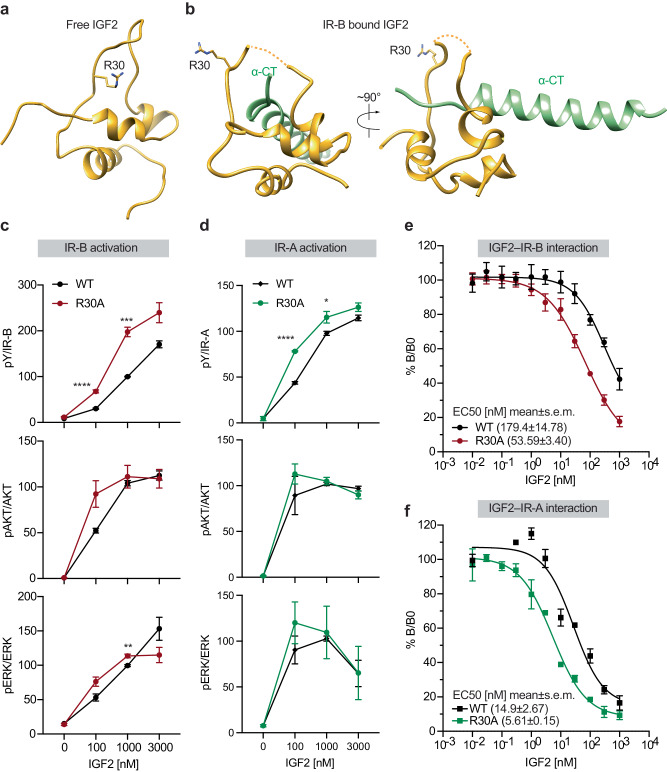
Insulin receptor (IR) controls growth and metabolism. Insulin-like growth factor 2 (IGF2) has different binding properties on two IR isoforms, mimicking insulin's function. However, the molecular mechanism underlying IGF2-induced IR activation remains unclear. Here, we present cryo-EM structures of full-length human long isoform IR (IR-B) in both the inactive and IGF2-bound active states, and short isoform IR (IR-A) in the IGF2-bound active state. Under saturated IGF2 concentrations, both the IR-A and IR-B adopt predominantly asymmetric conformations with two or three IGF2s bound at site-1 and site-2, which differs from that insulin saturated IR forms an exclusively T-shaped symmetric conformation. IGF2 exhibits a relatively weak binding to IR site-2 compared to insulin, making it less potent in promoting full IR activation. Cell-based experiments validated the functional importance of IGF2 binding to two distinct binding sites in optimal IR signaling and trafficking. In the inactive state, the C-terminus of α-CT of IR-B contacts FnIII-2 domain of the same protomer, hindering its threading into the C-loop of IGF2, thus reducing the association rate of IGF2 with IR-B. Collectively, our studies demonstrate the activation mechanism of IR by IGF2 and reveal the molecular basis underlying the different affinity of IGF2 to IR-A and IR-B.


Conflict of interest statement

The authors declare no competing interests.

Figures

Fig. 1
Fig. 1. Overall structures of IR-B/IGF2 and IR-A/IGF2 complex.
a 3D reconstruction of IR-B/IGF2 complex in symmetric conformation fitted into a cryo-EM map at 3.7 Å resolution (left). Ribbon representation of the symmetric IR-B/IGF2 complex (right). The two IR protomers are colored in blue and green. IGF2s at site-1 and site-2 are colored in yellow and purple, respectively. b 3D reconstruction of IR-B/IGF2 complex in asymmetric conformation fitted into a cryo-EM map at 4.7 Å resolution (left). Ribbon representation of the asymmetric IR-B/IGF2 complex (right). c Superposition between IR-B/IGF2 (orange) and IR-A/IGF2 (gray) complex in their symmetric conformation (class 1). d Superposition between IR-B/IGF2 (orange) and IR-A/IGF2 (gray) complex in their asymmetric conformation (class 2). e Cryo-EM density maps of the IR-B/IGF2 complex in asymmetric conformation (class 3).
Fig. 2
Fig. 2. Functional importance of IGF2 binding to two distinct sites.
a Close-up view of the binding of IGF2 (yellow) at the L1 (blue) and α-CT’/FnIII-1’ (green) domains of IR. b Close-up view of the binding of insulin (yellow) at the L1(blue) and α-CT’/FnIII-1’ (green) domains of IR. c Autophosphorylation of IR-B by 100 nM IGF2 and 10 nM insulin for 10 min in IR/IGF1R double knockout 293FT cells expressing IR-B WT or the indicated IR-B mutants. Levels of pY IR-B were normalized to total IR-B levels and shown as intensities relative to that of IR-B WT in cells treated with IGF2 (for IGF2-treated group) or insulin (for insulin-treated group). Mean±sem. N = 4 independent experiments. Significance calculated using two-tailed Student’s t-test. Source data are provided as a Source Data file. d Autophosphorylation of IR-B by 100 nM IGF2 and 10 nM insulin for 10 min in IR/IGF1R double knockout 293FT cells expressing IR-B WT or IR-B R539A. Levels of pY IR-B were normalized to total IR-B levels and shown as intensities relative to that of IR-B WT in cells treated with IGF2 (for IGF2-treated group) or insulin (for insulin-treated group). Mean±sem. N = 4 independent experiments. Significance calculated using two-tailed Student’s t-test. Source data are provided as a Source Data file. e Close-up view of the binding of IGF2 (purple) at the FnIII-1’ domain of IR-B (green). f Close-up view of the binding of insulin (purple) at the FnIII-1’ domain of IR-B (green). g Autophosphorylation of IR-B by 100 nM IGF2 and 10 nM insulin for 10 min in IR/IGF1R double knockout 293FT cells expressing IR-B WT or IR-B K484E/L552A. Levels of pY IR-B were normalized to total IR-B levels and shown as intensities relative to that of IR-B WT in cells treated with IGF2 (for IGF2-treated group) or insulin (for insulin-treated group). Mean±sem. N = 3 independent experiments. Significance calculated using two-tailed Student’s t-test. Source data are provided as a Source Data file.
Fig. 3
Fig. 3. Functional importance of IGF2-IR interfaces on IR activation and trafficking.
a Sequences and domains of human insulin, IGF1, and IGF2. Mutations of IGF2 are noted in colors. b IR signaling in IR and IGF1R double knockout preadipocytes expressing only human IR-B (DKO-IR-B) treated with the indicated ligands for 10 min. Cell lysates were blotted with the indicated antibodies. Source data are provided as a Source Data file. c Quantification of the western blot data shown in (b). Levels of protein phosphorylation were normalized to total protein levels and shown as intensities relative to that in 1000 nM IGF2 WT-treated cells. Mean±sem. For pY IR: IGF2 WT, N = 18; V43E, N = 7; E12A, N = 6; F19A/L53A, N = 5; R37A/R38A, N = 5; insulin, N = 2; For pAKT/AKT: WT, N = 17; V43E, N = 6; E12A, N = 6; F19A/L53A, N = 4; R37A/R38A, N = 4; insulin, N = 2; For pERK/ERK: WT, N = 17; V43E, N = 6; E12A, N = 6; F19A/L53A, N = 4; R37A/R38A, N = 4; insulin, N = 2. Significance calculated using two-tailed Student’s t-test. *p < 0.05, **p < 0.01, ***p < 0.001, and ****p < 0.0001. The exact p values are provided in the source data. d HeLa cells expressing IR-A WT-GFP were starved, treated with 100 nM IGF2 WT or mutants for indicated times, and stained with anti-GFP (IR, green) and DAPI (blue). Scale bar, 10 μm. e Quantification of the ratios of plasma membrane (PM) and intracellular (IC) IR-A-GFP signals of cells in (d). Mean±sem. 0 min, N = 32; For IGF2 WT: 5 min, N = 32; 10 min, N = 31; 30 min, N = 37; 60 min, N = 31; 120 min, N = 36; For R37A/R38A: 5 min, N = 30; 10 min, N = 32; 30 min, N = 35; 60 min, N = 32; 120 min, N = 31; For F19A/L53A, 5 min, N = 33; 10 min, N = 32; 30 min, N = 31; 60 min, N = 31; 120 min, N = 40. Significance calculated using two-tailed Student’s t-test; between IGF2 WT and mutants in the same time points. *p < 0.05, **p < 0.01, ***p < 0.001, and ****p < 0.0001. The exact p values are provided in the source data.
Fig. 4
Fig. 4. IGF2 R30A mutation enhances IR binding and activation.
a NMR solution structure of IGF2 (PDB:1IGL). b Close-up view of the binding of IGF2 (yellow) at the α-CT of IR-B (green). c Quantification of the western blot data for IGF2 WT and R30A mutant shown in Fig. 3b. Levels of protein phosphorylation were normalized to total protein levels and shown as intensities relative to that in 1000 nM IGF2 WT-treated cells. Mean±sem. For IGF2 R30A, N = 6; For IGF2 WT same as Fig. 3c. Significance calculated using two-tailed Student’s t-test. **p = 0.0073, ***p = 0.0009, and ****p < 0.0001. Source data are provided as a Source Data file. d IR signaling in IR and IGF1R double knockout preadipocytes expressing only mouse IR-A (DKO-IR-A) treated with the indicated ligands for 10 min. Levels of protein phosphorylation were normalized to total protein levels and shown as intensities relative to that in 1000 nM IGF2 WT-treated cells. N = 4 independent experiments. Significance calculated using two-tailed Student’s t-test; *p = 0.03956 and ****p < 0.0001. Source data are provided as a Source Data file. e Competition-binding assay with full-length IR-B. Mean±sd. N = 4 independent experiments. EC50 were calculated with best-fit values. Source data are provided as a Source Data file. f Competition-binding assay with full-length IR-A. Mean±sd. N = 3 independent experiments. EC50 were calculated with best-fit values. Source data are provided as a Source Data file.
Fig. 5
Fig. 5. Overall structure of apo-IR-B.
a Sequences of the C-terminal region of α-chains in IR-A and IR-B. Disulfide bonds are marked in red. Structural regions identified in previous and current studies were noted. b The 3D reconstruction of IR-B fitted into a cryo-EM map at 3.9 Å resolution. c Ribbon representation of IR-B. d Close-up view of α-CT of apo-IR-B. e Close-up view of α-CT of apo-IR-A (PDB 4ZXB). f Superposition between α-CT of apo-IR-B (green) and α-CT of apo-IR-A (orange). g Autophosphorylation of IR-B (pY IR-B) by 100 nM IGF2 and 10 nM insulin for 10 min in IR/IGF1R double knockout 293FT cells expressing IR-B wild-type (WT) or the indicated IR-B mutants. h Quantification of the western blot data shown in Fig. 5g. Levels of pY IR-B were normalized to total IR-B levels and shown as intensities relative to that of IR-B WT in cells treated with IGF2 (for IGF2-treated group) or insulin (for insulin-treated group). Mean±sem. N = 3 independent experiments. Significance calculated using two-tailed Student’s t-test. Source data are provided as a Source Data file.
Fig. 6
Fig. 6. Metabolic and mitogenic effects of IGF2-IR interfaces.
a Function of IGF2 WT and mutants on glucose production inhibition in primary hepatocytes. Mean±sd. N = 3 independent cells. Significance calculated using two-tailed Student’s t-test. Source data are provided as a Source Data file. b Function of IGF2 WT and mutants on cell growth and viability. C2C12 cells were treated with 100 nM ligands for 48 h. The outcomes were presented relative to the cell viability observed in cells treated with PBS. Mean±sd. Control (PBS) and insulin, N = 12; IGF2 WT, V43E, R37A/R38A, and F19A/L53A, N = 6. Significance calculated using two-tailed Student’s t-test; ****p < 0.0001. Source data are provided as a Source Data file.
Fig. 7
Fig. 7. The activation mechanism of IR by IGF2.
a Insulin-induced IR-B activation at saturated insulin concentrations. Two IR-B protomers are colored in blue and green. Insulin at the site-1 and site-2 are colored in yellow and purple, respectively. The C-terminal extension of α-chains in IR-B are marked in red. b IGF2-induced IR-B activation at saturated IGF2 concentrations. IGF2 at the site-1 and site-2 are colored in yellow and purple, respectively (top). The C-terminal extension of α-chains contacts the FnIII-2 domain of IR-B, thus hindering its threading into the C-loop of IGF2 (bottom). The side chain of Arg30 of IGF2 is marked in cyan. c A comparison of insulin or IGF2-bound α-CT in IR-A and IR-B. Insulin and IGF2 (yellow); α-CT domain (green); the C-terminal extension of α-CT in IR-B (red). The side chain of Arg30 of IGF2 is marked in cyan.

Similar articles

Cited by

References

    1. Ullrich A, et al. Human insulin receptor and its relationship to the tyrosine kinase family of oncogenes. Nature. 1985;313:756–761. doi: 10.1038/313756a0. - DOI - PubMed
    1. Shier P, Watt VM. Primary structure of a putative receptor for a ligand of the insulin family. J. Biol. Chem. 1989;264:14605–14608. doi: 10.1016/S0021-9258(18)63737-8. - DOI - PubMed
    1. Abbott AM, Bueno R, Pedrini MT, Murray JM, Smith RJ. Insulin-like growth factor I receptor gene structure. J. Biol. Chem. 1992;267:10759–10763. doi: 10.1016/S0021-9258(19)50083-7. - DOI - PubMed
    1. Ebina Y, et al. The human insulin receptor cDNA: the structural basis for hormone-activated transmembrane signalling. Cell. 1985;40:747–758. doi: 10.1016/0092-8674(85)90334-4. - DOI - PubMed
    1. Ullrich A, et al. Insulin-like growth factor I receptor primary structure: comparison with insulin receptor suggests structural determinants that define functional specificity. EMBO J. 1986;5:2503–2512. doi: 10.1002/j.1460-2075.1986.tb04528.x. - DOI - PMC - PubMed

MeSH terms