. 2024 Mar 23;14(1):6933.
doi: 10.1038/s41598-024-55934-5.

Community detection in hypergraphs via mutual information maximization

Affiliations

Community detection in hypergraphs via mutual information maximization

Jürgen Kritschgau et al. Sci Rep. .

Abstract

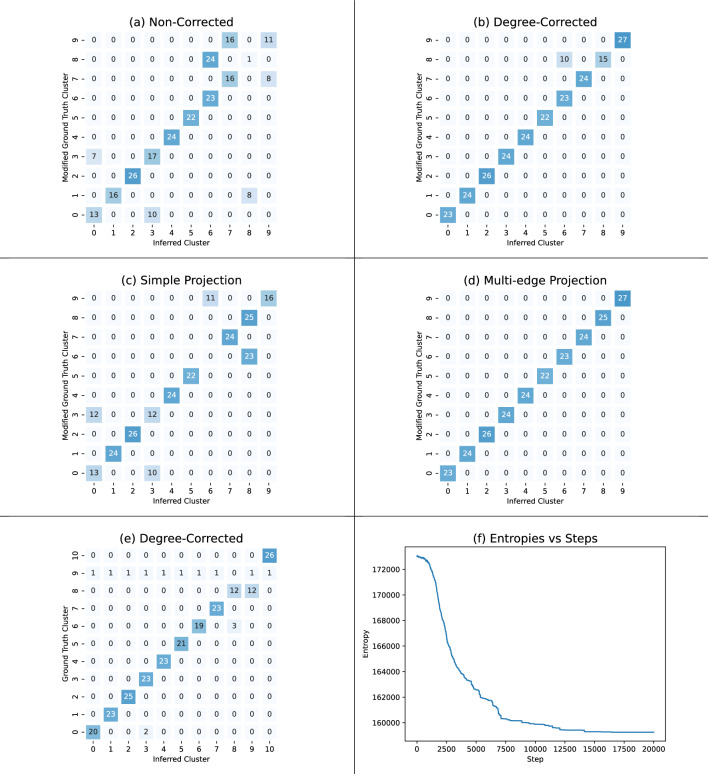
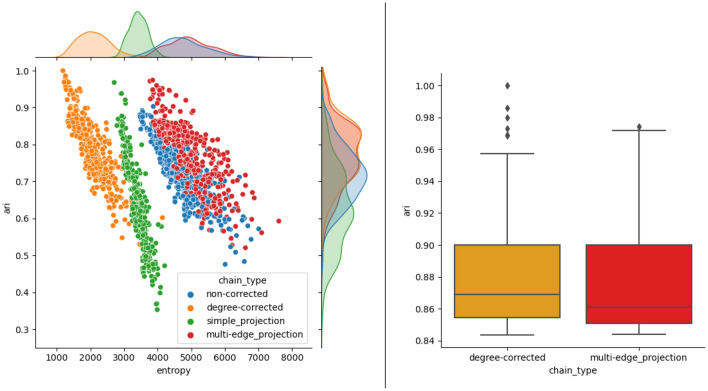
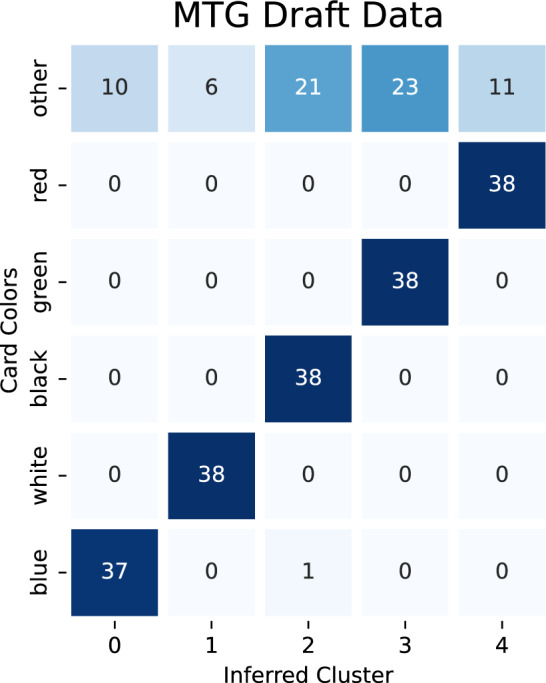
The hypergraph community detection problem seeks to identify groups of related vertices in hypergraph data. We propose an information-theoretic hypergraph community detection algorithm which compresses the observed data in terms of community labels and community-edge intersections. This algorithm can also be viewed as maximum-likelihood inference in a degree-corrected microcanonical stochastic blockmodel. We perform the compression/inference step via simulated annealing. Unlike several recent algorithms based on canonical models, our microcanonical algorithm does not require inference of statistical parameters such as vertex degrees or pairwise group connection rates. Through synthetic experiments, we find that our algorithm succeeds down to recently-conjectured thresholds for sparse random hypergraphs. We also find competitive performance in cluster recovery tasks on several hypergraph data sets.


Conflict of interest statement

The authors declare no competing interests.

Figures

Figure 1
Figure 1
Example of a hypergraph whose vertices have been partitioned into four clusters.
Figure 2
Figure 2
Visualization of each of the constituent counting steps for Eq. (7). Here, bold curves demarcate clusters, colored regions illustrate assigning stubs to λ types, and colored curves illustrate packet assignment.
Algorithm 1
Algorithm 1
This algorithm will use simulated annealing to find a cluster assignment with low entropy. Note that Z implicitly depends on the hypergraph H.
Figure 3
Figure 3
Each heatmap has 51×51 pixels, where each pixel represents the average ARI across 5 hypergraphs. Each hypergraph underwent 20 independent clustering attempts, of which we used the results from the run which achieved the lowest entropy. The same hypergraphs are used across all four plots. The white ellipse in plots (a) and (b) are the conjectured detection threshold for Belief-Propagation Spectral Clustering for hypergraphs. The white lines in plots (c) and (d) are the conjectured detection threshold for Non-Backtracking Spectral Clustering for hypergraphs. The orange lines in plots (c) and (d) are the proven detection threshold for the graph stochastic blockmodel for edge densities of the multi-edge projection parameterized by p2 and p3.
Figure 4
Figure 4
From left to right, a hypergraph, its simple clique projection, and its multi-edge clique projection.
Figure 5
Figure 5
Plot (a) compares the degree-corrected hypergraph chain against the non-corrected chain. Interestingly, p2,p3[0.00,0.32] range appears to favor the degree-corrected chain, while the rest of the circular boundary region favors the non-corrected chain. Plots (b) and (c) are a comparison of hypergraph native results with multi-edge and simple projection results; red indicates a superior performance by the degree-corrected hypergraph chain, while blue indicates that the degree-corrected algorithm on the projection performed better.
Figure 6
Figure 6
The non-corrected and degree-corrected chains were given 10 runs with 20, 000 steps, where we keep the inferred clustering with maximum mutual information observed over all runs. Plot (a) shows the inferred clusters from the non-corrected chain, which scored an ARI of -0.006. Plot (b) shows the inferred clusters from the degree-corrected chain, which scored an ARI of 1.00. Plot (c) shows the degrees of vertices (vertices are sorted by degree), with a color-coding that corresponds to the inferred cluster from plot (a). Plot (d) shows the degrees of vertices with a color-coding that corresponds to the ground truth cluster.
Figure 7
Figure 7
On the left hand side, we applied the degree-corrected mutual information clustering (best of 20 runs with 20, 000 steps), simple projection spectral clustering, and multi-edge projection spectral clustering on a 200 vertex hypergraph stochastic block model sampled with parameters p2=1 and p3=0.97; this achieved ARIs of 1.00, 1.00, and 1.00 for (a), (c), and (e), respectively. On the right hand side, we applied the degree-corrected mutual information clustering, simple projection spectral clustering, and multi-edge projection spectral clustering on a 200 vertex hypergraph stochastic block model sampled with parameters p2=1 and p3=0; this achieved ARIs of 1.00, 0.00, and 0.00 for (b), (d), and (f), respectively. Representative run times for the degree-corrected, simple projection spectral clustering, and multi-edge projection spectral clustering in seconds are 35.551 s, 0.036 s, and 0.043 s, respectively.
Figure 8
Figure 8
Inferred and ground-truth clusters for the primary school contact data set. Each matrix is the lowest entropy of 50 independent runs of 20,000 steps. The cluster heatmap for (e) uses collected ground truth; this includes a cluster label for teachers within the primary school. The cluster heatmaps for (b), (c), and (d) are compared against a modified ground truth where the teachers’ cluster from the ground truth is divided up among the classrooms according to the assignments in (a). The ARI values are (a) 0.66, (b) 0.93, (c) 0.76, (d) 1.00, and (e) 0.88. The line graph in (f) shows the entropy at each step of the simulated annealing minimization process. The sharp drop in entropy is typical behavior. We tuned the number of steps and the annealing schedule so that the early portion of simulation explores the state space, the descent is (relatively) gradual, and the end of the simulation settles into a local minimum.
Figure 9
Figure 9
As in Figure 8, using the high-school contact data set. The ARI values are (a) 0.84, (b) 0.94, (c) 0.97, and (d) 0.93.
Figure 10
Figure 10
(Left) Each scatter plot consists of 400 points and plots the entropy against the ARI. Each point is obtained by running the corresponding chain for 20,000 steps and keeping the lowest entropy observed on that run. Then, the ARI is calculated using the corresponding clustering. Entropy values are shifted to fall within the interval [0, 10000). We see that the distributions of ARI between degree-corrected and multi-edge clustering are similar, with slight differences occuring in the regime of high ARI. (Right) A box and whisker plot of the top quartile of ARI for degree-corrected and multi-edge clustering. We see that degree-corrected clustering produces the top ARI, is more likely to have exceptional high ARI outcomes, and has a larger mean than the multi-edge clustering.
Figure 11
Figure 11
Results from running the degree-corrected chain on the Dominaria United Premier Draft data for 10, 000 steps. The clustering algorithm was looking for 5 clusters, which we break apart into the 5 mono-colored classes and “other” which includes multi-colored and colorless cards.

References

    1. Newman M. Networks: An Introduction. Oxford University Press; 2018.
    1. Bick C, Gross E, Harrington HA, Schaub MT. What are higher-order networks? SIAM Rev. 2023;65:686–731. doi: 10.1137/21M1414024. - DOI
    1. Torres L, Blevins AS, Bassett D, Eliassi-Rad T. The why, how, and when of representations for complex systems. SIAM Rev. 2021;63:435–485. doi: 10.1137/20M1355896. - DOI
    1. Ke, Z. T., Shi, F. & Xia, D. Community detection for hypergraph networks via regularized tensor power iteration. arXiv:1909.06503 (2019).
    1. Chodrow PS, Veldt N, Benson AR. Generative hypergraph clustering: From blockmodels to modularity. Sci. Adv. 2021;7:eabh1303. doi: 10.1126/sciadv.abh1303. - DOI - PMC - PubMed