. 2024 Mar 23;7(1):363.
doi: 10.1038/s42003-024-06038-3.

Maternal RNA transcription in Dlk1-Dio3 domain is critical for proper development of the mouse placental vasculature

Affiliations

Maternal RNA transcription in Dlk1-Dio3 domain is critical for proper development of the mouse placental vasculature

Ximeijia Zhang et al. Commun Biol. .

Abstract

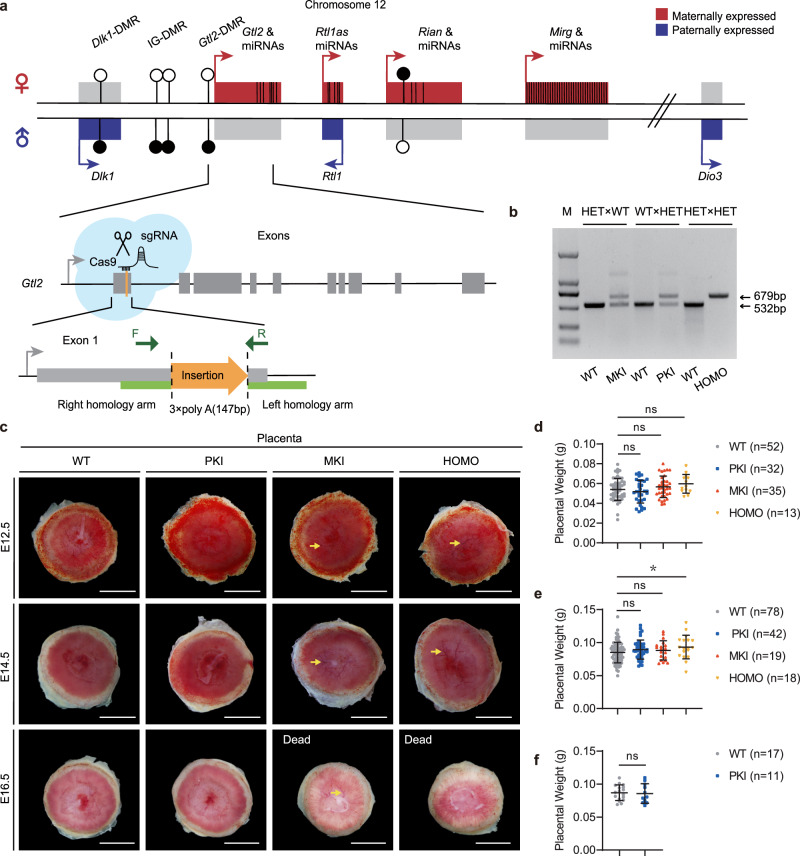
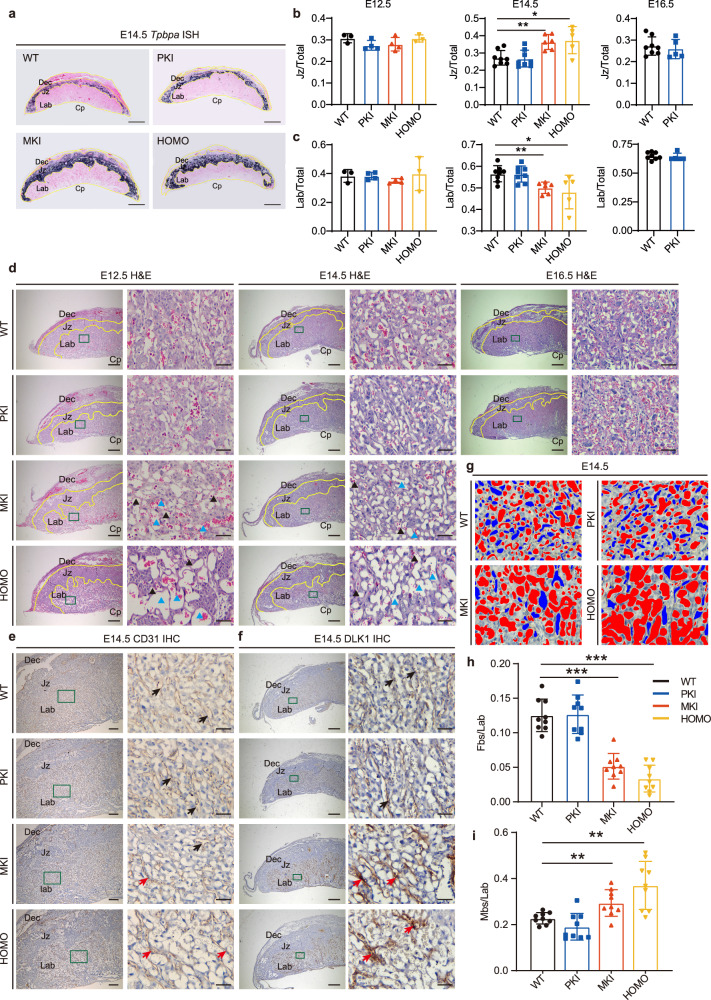
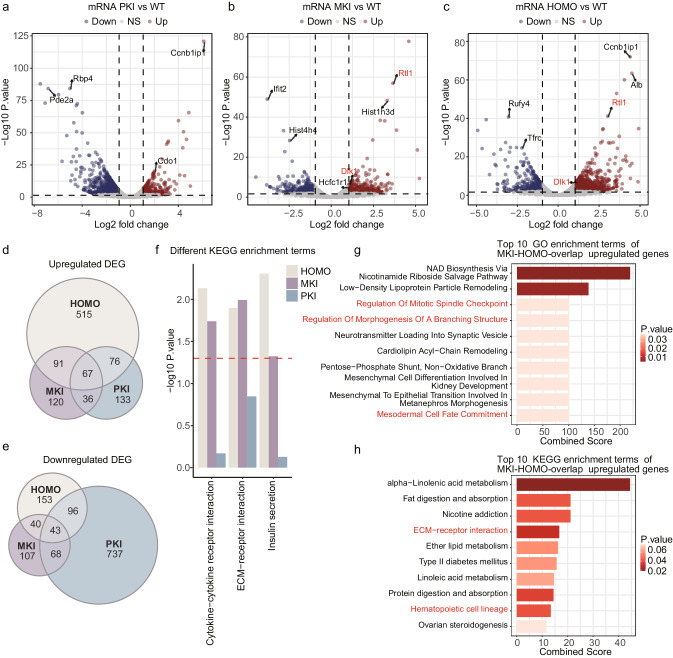
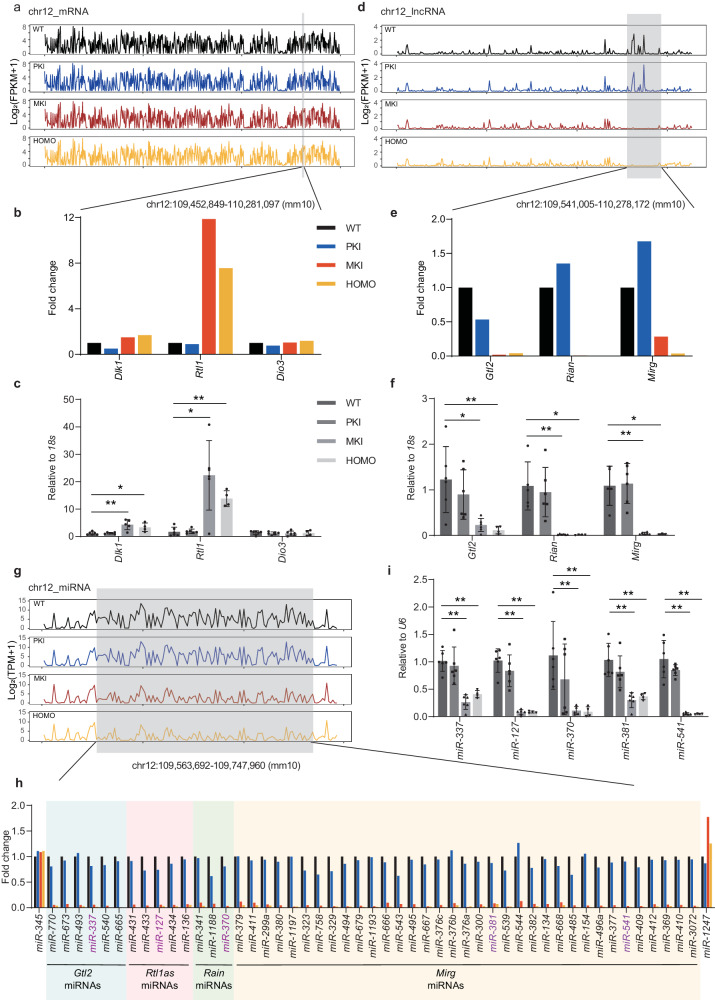
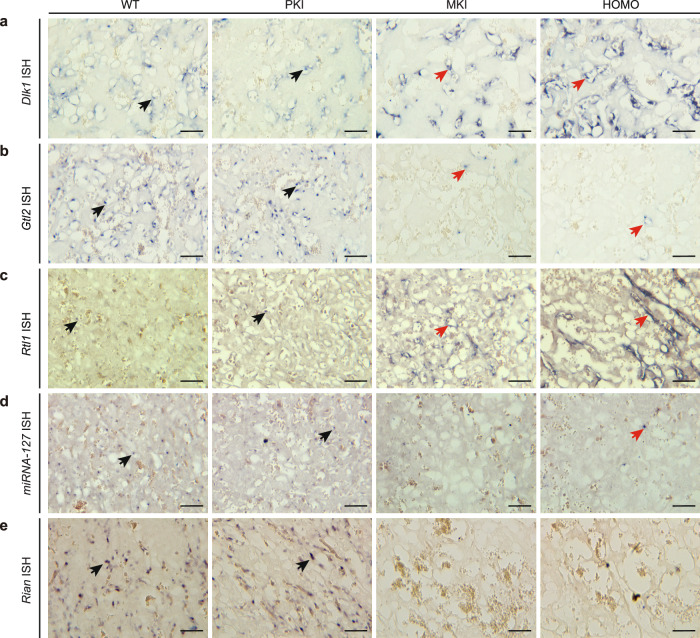
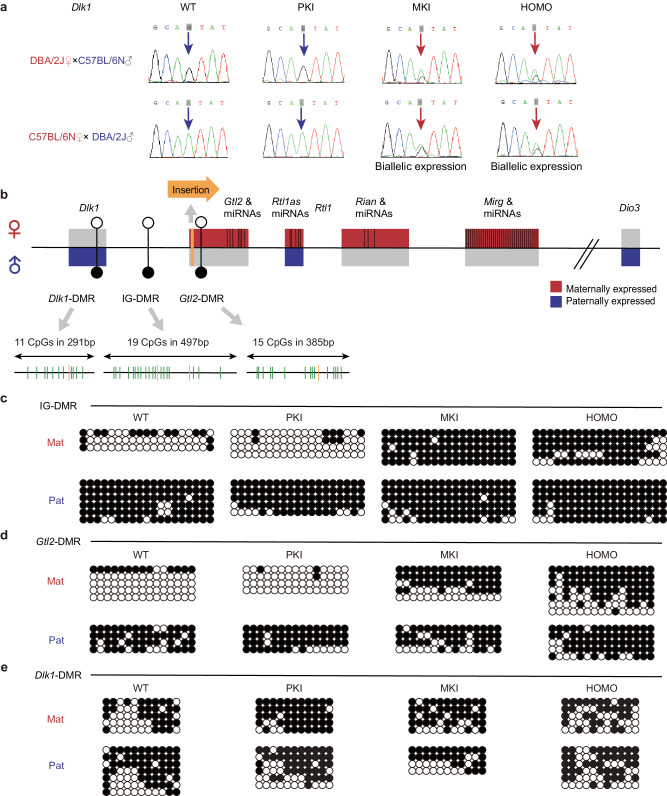
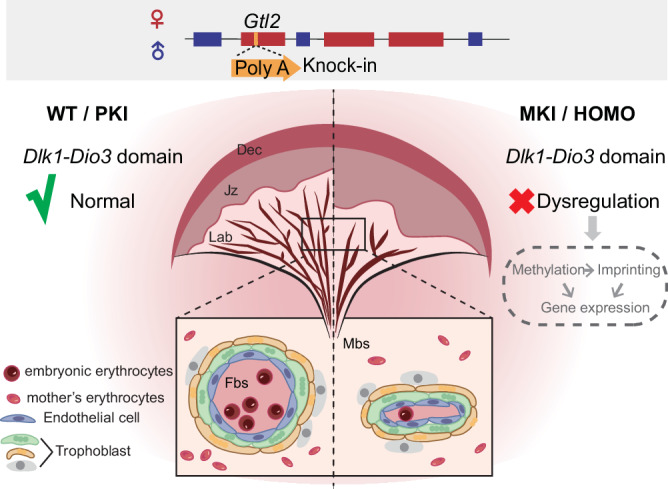
The placenta is a unique organ for ensuring normal embryonic growth in the uterine. Here, we found that maternal RNA transcription in Dlk1-Dio3 imprinted domain is essential for placentation. PolyA signals were inserted into Gtl2 to establish a mouse model to prevent the expression of maternal RNAs in the domain. The maternal allele knock-in (MKI) and homozygous (HOMO) placentas showed an expanded junctional zone, reduced labyrinth and poor vasculature impacting both fetal and maternal blood spaces. The MKI and HOMO models displayed dysregulated gene expression in the Dlk1-Dio3 domain. In situ hybridization detected Dlk1, Gtl2, Rtl1, miR-127 and Rian dysregulated in the labyrinth vasculature. MKI and HOMO induced Dlk1 to lose imprinting, and DNA methylation changes of IG-DMR and Gtl2-DMR, leading to abnormal gene expression, while the above changes didn't occur in paternal allele knock-in placentas. These findings demonstrate that maternal RNAs in the Dlk1-Dio3 domain are involved in placental vasculature, regulating gene expression, imprinting status and DNA methylation.


Conflict of interest statement

The authors declare no competing interests.

Figures

Fig. 1
Fig. 1. Establish Gtl2 polyA knock-in mouse model and analyze placental weights.
a Schematic representation of the Dlk1-Dio3 imprinted domain and 3x polyA insertion position in Gtl2 gene locus. Genes are shown as rectangles with their allelic expression state, maternally expressed genes are symbolized in red, paternally expressed genes in blue and not expressed genes in light gray. Arrows depict their transcription directions. The black vertical lines represent miRNAs. Differential methylation in the Dlk1-Dio3 domain are shown with filled circles representing methylated allele and hollow circles representing unmethylated allele. Dark gray rectangles represent exons of Gtl2. The inserted sequence is in orange shape, and the green rectangles on both sides are the left and right homology arms separately. The positions of the primers for genotyping are indicated by the dark green arrows. b Three mouse mating ways for getting the placentas and PCR confirmation of appropriate polyA knock-in. The wild type is 532 bp, and after right insertion the type is 679 bp. M: DL2000 DNA ladder (bp). c Gross phenotypes of WT and Gtl2 polyA knock-in placentas at E12.5, E14.5 and E16.5. Scale bars: 2 mm. The yellow arrows indicate thicker and more obvious vessels in the labyrinth sides in MKI and HOMO placentas. df Comparison among WT and Gtl2 polyA knock-in placental weights at E12.5 (WT n = 52, PKI n = 32, MKI n = 35, HOMO n = 13), E14.5 (WT n = 78, PKI n = 42, MKI n = 19, HOMO n = 18) and E16.5 (WT n = 17, PKI n = 11). The mean weight ± SD of each genotype is plotted. Studen t-test is used to analyze the p-value. *p < 0.05.
Fig. 2
Fig. 2. Gtl2 polyA knock-in alters placental architecture and leads to vasculature defect in the labyrinth.
a In situ hybridization of Tpbpa on E14.5 placenta to distinguish the three-layer structure of the mature placentas. Tpbpa, which is the marker gene of spongiotrophoblast can mark the junctional zone of the placenta. Yellow lines distinguish three layers of placentas. Dec: decidua, Jz: junctional zone, Lab: labyrinth, Cp: chorionic plate. Scale bars: 1000 μm. b, c Proportions of the labyrinth area and junctional zone area compared to the total placental area at E12.5 (WT n = 3, PKI n = 4, MKI n = 4, HOMO n = 3), E14.5 (WT n = 8, PKI n = 8, MKI n = 6, HOMO n = 5), and E16.5 (WT n = 8, PKI n = 5). The mean proportion ± SD of each genotype is plotted. Student t-test is used to analyze the p values. *p < 0.05, **p < 0.01. d H&E staining of placentas at E12.5, E14.5, and E16.5. Dark green boxes show high-magnification images of labyrinth area (right). Blue triangles: maternal blood space (Mbs), black triangles: fetal blood space (Fbs). Scale bars of the first, third and fifth columns: 500 μm, scale bars of the second, fourth and sixth columns: 50 μm. e CD31 IHC of E14.5 placentas. CD31 is the marker of vascular endothelial cells. Dark green boxes show high-magnification images of labyrinth areas (right). Black arrows indicate CD31 express normally in the fetal vascular endothelial cells. Red arrows indicate aggregation distribution of CD31 in MKI and HOMO abnormal fetal vascular endothelial cells. Scale bars of the first column: 500μm, scale bars of the second column: 50 μm. f DLK1 IHC of E14.5 placentas. Dark green boxes show high-magnification images of labyrinth areas (right). Black arrows indicate DLK1 express normally in the fetal vascular endothelial cells, red arrows indicate aggregation distribution and increased expression of DLK1 in MKI and HOMO abnormal fetal vascular endothelial cells. Scale bars of the first column: 500 μm, scale bars of the second column: 50 μm. g According to the images of CD31 IHC of E14.5 placentas, the Fbs (blue) are surrounded by CD31, and filled with larger nucleated erythrocytes, and the Mbs (red) are not surrounded by CD31 and filled with smaller no nucleus erythrocytes. h, i The proportions of Fbs and Mbs compare to labyrinth at E14.5, respectively. Images of 3 microscopic views of one placental labyrinth are calculated to quantify the vascular area using ImageJ software. Numbers of placentas: WT n = 3, PKI n = 3, MKI n = 3, HOMO n = 3. The mean proportion ± SD of each genotype is plotted. Student t-test is used to analyze the p values. *p < 0.05, **p < 0.01, ***p < 0.001.
Fig. 3
Fig. 3. Differential expression of mRNAs in Gtl2 polyA knock-in placentas at E12.5.
ac Volcano plots showing differentially expressed mRNAs (DEGs) in PKI, MKI, and HOMO compared to WT. The DEGs labeled in red are located in Dlk1-Dio3 domain. The DEGs with significant changes and labeled in black are verified by qRT-PCR. d, e Venn diagrams of upregulated and downregulated DEGs in PKI, MKI and HOMO placentas, respectively. f The KEGG enrichment terms of upregulated DEGs are significant in MKI and HOMO, and not significant in PKI. The red dashed line represents the p is 0.05. g The top 10 GO enrichment terms of MKI and HOMO overlapped upregulated DEGs. Terms in red related to MKI and HOMO phenotypes. h The top 10 KEGG enrichment terms of MKI and HOMO overlapped upregulated DEGs. Terms in red related to MKI and HOMO phenotypes.
Fig. 4
Fig. 4. Gtl2 polyA knock-in results in dysregulation of placental genes in the Dlk1-Dio3 imprinted domain at E12.5.
a RNA-seq demonstrates mRNA expression in Gtl2 polyA knock-in and WT placentas overall chr12. Dlk1-Dio3 imprinted domain is annotated in gray shade. b Compare gene expression of Dlk1, Rtl1 and Dio3 in the Dlk1-Dio3 domain among Gtl2 polyA knock-in and WT placentas using RNA-seq data. c qRT-PCR analysis confirm the expression of Dlk1, Rtl1 and Dio3 to 18s in Gtl2 polyA knock-in placentas. d RNA-seq demonstrates lncRNA expression in Gtl2 polyA knock-in and WT placentas overall chr12. Dlk1-Dio3 domain is annotated in gray shade. e Compared gene expression of Gtl2, Rian, and Mirg in the Dlk1-Dio3 domain among Gtl2 polyA knock-in and WT placentas using RNA-seq data. f qRT-PCR analysis confirm the expression of Gtl2, Rian, and Mirg to 18s in Gtl2 polyA knock-in placentas. g Small RNA-seq demonstrates miRNA expression in Gtl2 polyA knock-in and WT placentas overall chr12. Dlk1-Dio3 domain is annotated in gray shade. h Compare expression of miRNAs in Dlk1-Dio3 domain detected by small RNA-seq in four genotype placentas. Seven miRNAs shown in light blue shade are located in Gtl2 locus, five miRNAs shown in light pink shade are located in Rtl1 antisense locus, three miRNAs shown in light green shade are located in Rian locus, and twenty-six miRNAs showed in light yellow shade are located in Mirg locus. The miRNAs shown in purple have been detected by qRT-PCR. i qRT-PCR analysis confirm the expression of miR-337, miR-127, miR-370, miR-381 and miR-541, which we select from each locus in Dlk1-Dio3 domain whose expression abolish in MKI and HOMO placentas but are normal in PKI placentas. In (c, f, i), biological duplication: WT n = 6, PKI n = 6, MKI n = 6, HOMO n = 4. The mean expression ± SD of each genotype is plotted. Student t-test is used to analyze the p values. *p < 0.05, **p < 0.01. In (b, c, e, f, h, i), gene expression levels in WT are arbitrarily set to 1.
Fig. 5
Fig. 5. Dysregulation of genes in the Dlk1-Dio3 imprinted domain in the labyrinth of Gtl2 polyA knock-in placentas at E12.5.
ae In situ hybridization results show the expression pattern of Dlk1, Gtl2, Rtl1, miR-127 and Rian in the labyrinth of Gtl2 polyA knock-in and WT placentas, separately. Black arrows indicate gene expression normally in WT and PKI vasculature and red arrows indicate upregulated or downregulated gene expression in MKI and HOMO vasculature. In (ae), scale bars: 50 μm.
Fig. 6
Fig. 6. Imprinting status analysis of Dlk1 and DNA methylation analysis of DMRs in the Dlk1-Dio3 imprinted domain in Gtl2 polyA knock-in placentas at E12.5.
a Monoallelic expression of Dlk1 in WT and PKI placentas and biallelic expression of Dlk1 in MKI and HOMO placentas. Allelic-specific gene expression is determined by the SNP between C57BL/6 N (B6) and DBA/2 J (DBA) mice. Total RNA are extracted from Gtl2 polyA knock-in placentas and their WT control. After purifying RNA and RT-PCR, PCR products containing the SNP for Dlk1 are sequenced. Blue arrows indicate monoallelic Dlk1 expression exclusively from the paternal allele and red arrows indicate detected biallelic Dlk1 expression. b Schematic representation of DMRs (IG-DMR, Gtl2-DMR, Dlk1-DMR) in Dlk1-Dio3 domain. The inserted sequence is in orange arrow. Filled circles represent methylated DMRs and hollow circles represent unmethylated DMRs. Green vertical lines represent the CpG dinucleotides in each DMR, and the yellow vertical lines represent SNPs between B6 and DBA mice. ce Methylation status of IG-DMR, Gtl2-DMR and Dlk1-DMR in Gtl2 polyA knock-in and WT placentas separately. Each row represents one clone. SNPs are used to distinguish paternal allele clones from maternal allele clones. Filled and hollow circles indicate methylated and unmethylated CpG sites, respectively.
Fig. 7
Fig. 7. A schematic illustrating the changes in Gtl2 polyA knock-in placentas in this study.
PloyA signal is inserted into Gtl2. PKI placenta shows the similar phenotypes in placental morphology with WT, and Dlk1-Dio3 imprinted domain works normally. MKI and HOMO placentas show the similar phenotypes, with expanded junctional zones and reduced labyrinth areas. Fetal blood spaces are reduced, and maternal blood spaces are larger in the labyrinth. Then, the DNA methylation and imprinted status are affected, leading to gene expression disregulated in the Dlk1-Dio3 domain.

Similar articles

Cited by

References

    1. Rossant J, Cross JC. Placental development: lessons from mouse mutants. Nat. Rev. Genet. 2001;2:538–548. doi: 10.1038/35080570. - DOI - PubMed
    1. Watson ED, Cross JC. Development of structures and transport functions in the mouse placenta. Physiology (Bethesda) 2005;20:180–193. - PubMed
    1. Perez-Garcia V, et al. Placentation defects are highly prevalent in embryonic lethal mouse mutants. Nature. 2018;555:463–468. doi: 10.1038/nature26002. - DOI - PMC - PubMed
    1. Hanna CW. Placental imprinting: emerging mechanisms and functions. PLoS Genet. 2020;16:e1008709. doi: 10.1371/journal.pgen.1008709. - DOI - PMC - PubMed
    1. Cassidy, F. C. & Charalambous, M. Genomic imprinting, growth and maternal-fetal interactions. J. Exp. Biol.221, 10.1242/jeb.164517 (2018). - PubMed

Publication types

MeSH terms

Substances