. 2024 Mar 23;21(1):72.
doi: 10.1186/s12974-024-03069-9.

Inflammation-induced TRPV4 channels exacerbate blood-brain barrier dysfunction in multiple sclerosis

Affiliations

Inflammation-induced TRPV4 channels exacerbate blood-brain barrier dysfunction in multiple sclerosis

Cathrin E Hansen et al. J Neuroinflammation. .

Abstract

Background: Blood-brain barrier (BBB) dysfunction and immune cell migration into the central nervous system (CNS) are pathogenic drivers of multiple sclerosis (MS). Ways to reinstate BBB function and subsequently limit neuroinflammation present promising strategies to restrict disease progression. However, to date, the molecular players directing BBB impairment in MS remain poorly understood. One suggested candidate to impact BBB function is the transient receptor potential vanilloid-type 4 ion channel (TRPV4), but its specific role in MS pathogenesis remains unclear. Here, we investigated the role of TRPV4 in BBB dysfunction in MS.

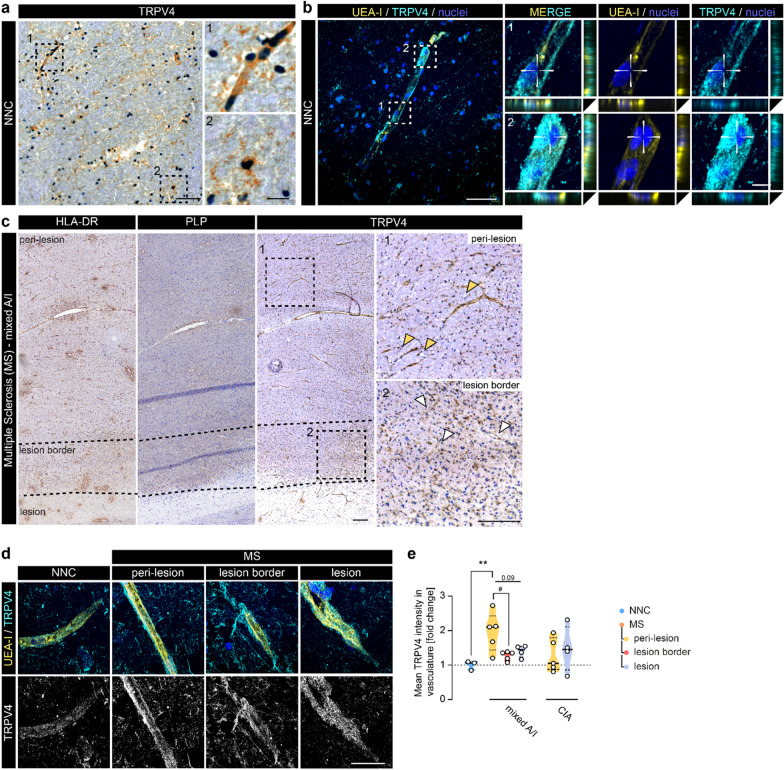
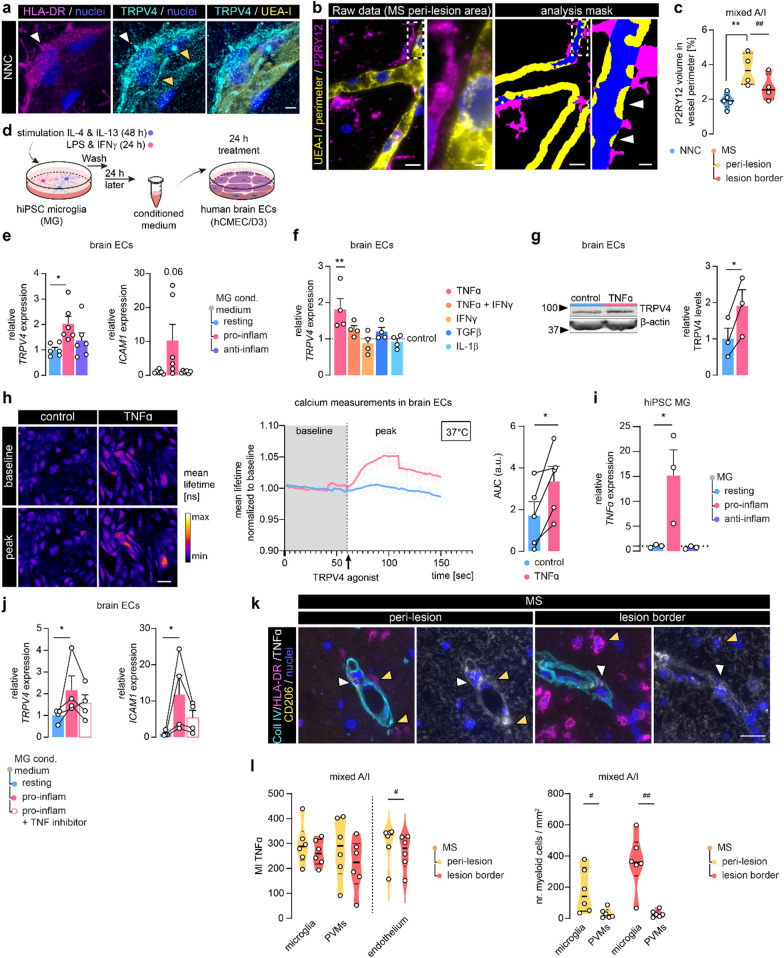
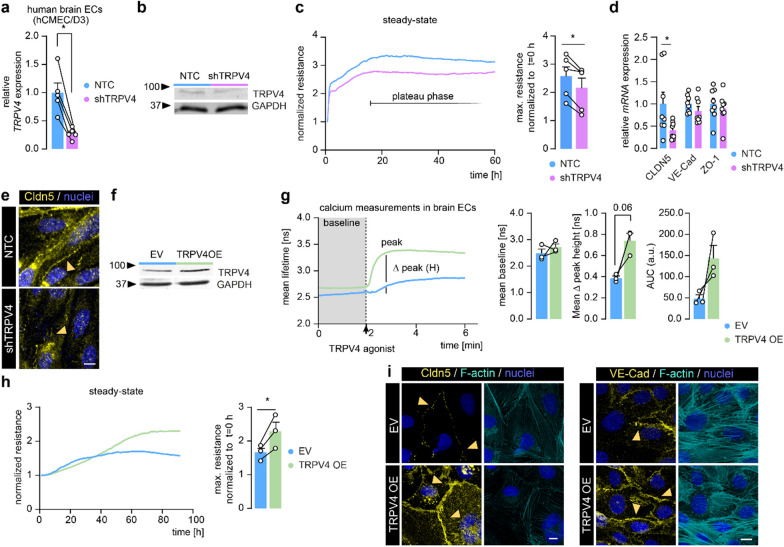
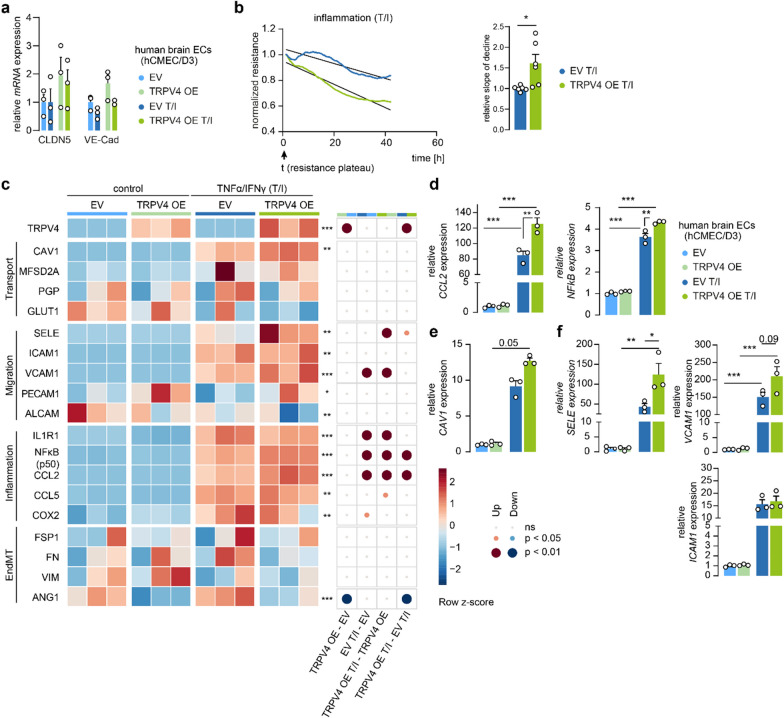
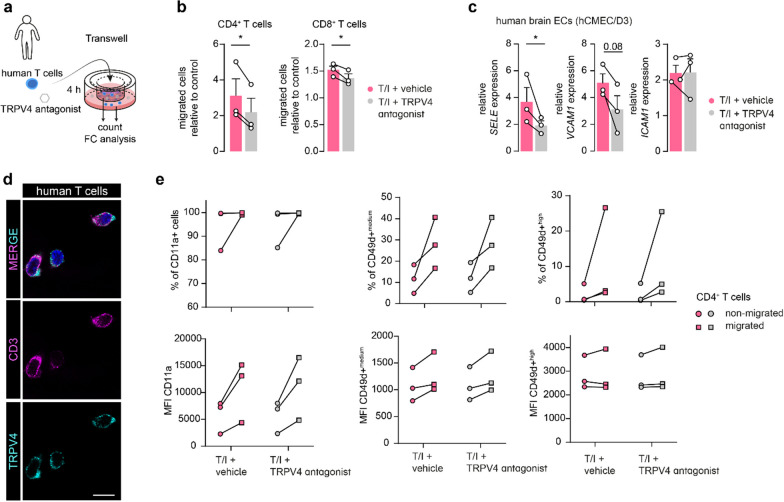
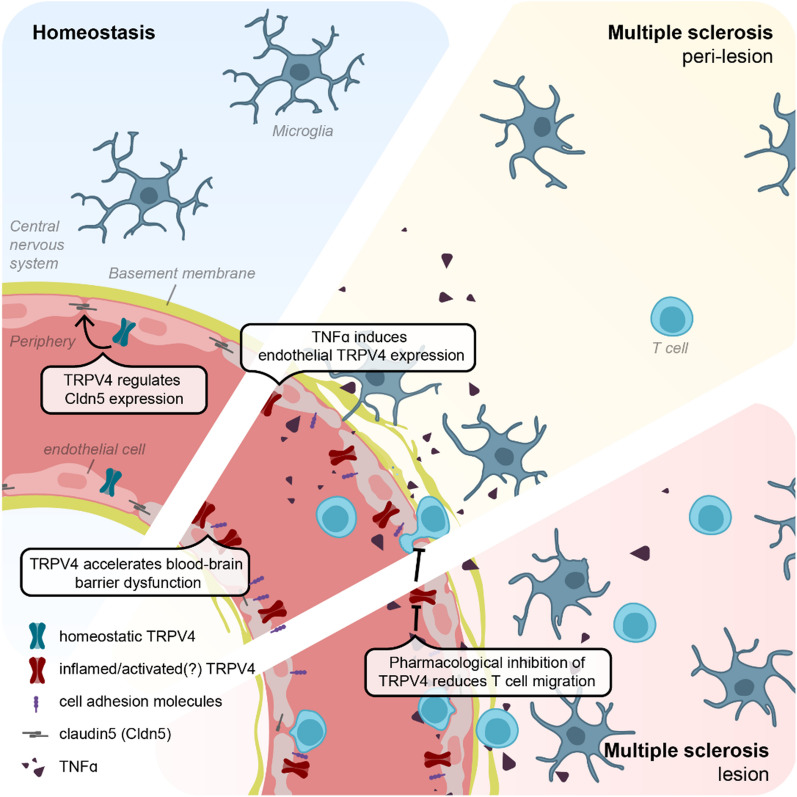
Main text: In human post-mortem MS brain tissue, we observed a region-specific increase in endothelial TRPV4 expression around mixed active/inactive lesions, which coincided with perivascular microglia enrichment in the same area. Using in vitro models, we identified that microglia-derived tumor necrosis factor-α (TNFα) induced brain endothelial TRPV4 expression. Also, we found that TRPV4 levels influenced brain endothelial barrier formation via expression of the brain endothelial tight junction molecule claudin-5. In contrast, during an inflammatory insult, TRPV4 promoted a pathological endothelial molecular signature, as evidenced by enhanced expression of inflammatory mediators and cell adhesion molecules. Moreover, TRPV4 activity mediated T cell extravasation across the brain endothelium.

Conclusion: Collectively, our findings suggest a novel role for endothelial TRPV4 in MS, in which enhanced expression contributes to MS pathogenesis by driving BBB dysfunction and immune cell migration.

Keywords: Blood–brain barrier; Multiple sclerosis; T cells; TNFα; TRPV4; Vessel-associated microglia.


Conflict of interest statement

The authors declare the absence of any potential conflict of interest.

Figures

Fig. 1
Fig. 1
Vascular TRPV4 expression is increased in areas around inflammatory MS lesions. a Representative image of TRPV4 immunoreactivity in NNC WM tissue; scale bar: 100 µm. Panels highlight morphologically different types of TRPV4+ cells including glial and vascular cells; scale bar: 25 µm. b Representative confocal image of UEA-I (endothelial marker) and TRPV4 immunoreactivity in NNC; scale bar: 50 µm. Panels demonstrate TRPV4-UEA-I co-localization; scale bar: 5 µm. c Representative images of HLA-DR, PLP, and TRPV4 immunoreactivity in mixed active/inactive (A/I) WM lesion tissue. Overview TRPV4 image shows the staining pattern at low magnification of peri-lesional, lesion border, and lesion tissue respectively (dotted line indicates areas, squares indicate location of panels); scale bar: 200 µm. Panels demonstrate TRPV4 staining in peri-lesional (orange arrowheads) and lesion border tissue (white arrowheads). d Representative confocal images of TRPV4-UEA-I immunoreactivity in NNC and MS cases; scale bar: 50 µm. e Quantification of TRPV4 mean fluorescent intensity measured within the UEA-I signal (endothelium) in NNC (N cases = 3) and MS (mixed A/I): N cases = 3, N lesions = 5; chronic inactive (CIA): N cases = 4, N lesions = 5). Statistical analysis was performed using one-way ANOVA with Dunnett’s multiple comparisons test, followed by paired one-way ANOVA analysis within the MS cases (#). Violin plots show median ± quartiles (*p < 0.05, **p < 0.01; #p < 0.05)
Fig. 2
Fig. 2
Microglia-derived TNFα induces TRPV4 expression in brain endothelial cells. a Representative confocal image of UEA-I, HLA-DR, and TRPV4 immunoreactivity in NNC tissue. The white arrowhead demonstrates TRPV4 in HLA-DR+ cells; orange arrowheads highlight endothelial, junctional TRPV4 reactivity; scale bar: 5 µm. b Representative images of UEA-I and P2RY12 (microglia) immunoreactivity in MS tissue (left); masks for 3D microglia-vasculature proximity analysis (right). Arrowheads indicate microglia volume (blue) within the vascular perimeter (yellow: 5 µm); scale bar: 10 µm, panel: 2 µm. c Quantification of microglia volume within vessel perimeter, N cases = 4–5. d Schematic of human brain ECs (hCMEC/D3) treatment with hiPSC microglia conditioned medium (MG cond. medium). e TRPV4 and ICAM1 measured in brain ECs treated with MG cond. medium, N = 6. f TRPV4 in brain ECs treated with cytokines relative to control, N = 4. g Protein levels of TRPV4 measured in TNFα-treated brain ECs normalized to a reference protein, N = 3. h Quantification of TRPV4 agonist-mediated calcium response in brain ECs treated with TNFα by the area under the curve (AUC) (GSK1016790A, 100 nM). Measurements were performed at 37 °C and normalized to baseline, N experiments = 5, N cells = 30–40; scale bar: 50 µm. i TNFα measured in hiPSC MG, N = 3. j TRPV4 and ICAM1 measured in brain ECs treated with pro-inflammatory cond. MG medium with/without TNF inhibitor, N = 4 k Representative images of TNFα, HLA-DR, CD206, and Coll IV immunoreactivity in MS tissue; white arrowheads indicate CD206+ perivascular macrophages (PVMs), orange arrowheads indicate microglia (HLA-DR+,CD206, outside Coll IV); scale bar: 25 µm. l Quantification of TNFα mean intensity in microglia, PVMs, and endothelium and myeloid cell count. Data is shown as the mean ± SEM and statistics were calculated for three groups by one-way ANOVA with Bonferroni or Dunnett's multiple comparisons test or non-parametric Kruskal–Wallis with Dunns test. Comparison of two groups was performed using paired Student’s t-test indicated by connecting lines or within MS tissues (*p < 0.05, **p < 0.01; #p < 0.05, ##p < 0.01)
Fig. 3
Fig. 3
TRPV4 regulates barrier resistance and Cldn5 expression in human brain ECs. a TRPV4 measured in knock down of TRPV4 (shTRPV4) compared to non-targeting shRNA control human brain ECs (NTC), N = 5. b Protein levels of TRPV4 in shTRPV4 cells compared to NTC cells. c TEER measurement of shTRPV4 and NTC brain ECs and quantification of max. resistance normalized to cell attachment (t = 0), N = 5. d mRNA expression of CLDN5, VE-Cad and ZO-1 in shTRPV4 and NTC cells, N = 8. e Representative images of Cldn5 immunoreactivity in shTRPV4 cells and NTC cells, orange arrowheads indicate cell–cell junctions; scale bar: 25 µm. f Protein levels of TRPV4 in TRPV4 OE compared to EV cells. g Calcium baseline and TRPV4 agonist-mediated calcium response in TRPV4 OE compared to EV cells (GSK1016790A, 100 nM). Quantification of TRPV4 agonist-mediated calcium response, N = 3. h TEER measurement of TRPV4 OE and EV brain ECs and quantification of max. resistance normalized to t = 0, N = 3. i Representative images of Cldn5, VE-Cad, and F-actin immunoreactivity in TRPV4 OE and EV cells, orange arrowheads indicate cell–cell junctions; scale bar: 10 µm. Data is shown as mean ± SEM and an average of technical replicates in each biological replicate. Statistics were performed by paired Student’s t-test indicated by connecting lines (*p < 0.05)
Fig. 4
Fig. 4
Enhanced TRPV4 expression in human brain ECs intensifies inflammatory phenotype during inflammatory insult. a CLDN5 and VE-Cad in TRPV4 OE compared to EV cells under homeostatic (control) and inflammatory [TNFα/IFNγ (T/I)] conditions normalized to EV control. b TEER measurement of TRPV4 OE and EV brain ECs under inflammatory conditions normalized to resistance plateau and quantification of declining slope relative to EV cells, N = 6. c Heatmap visualizes gene expression profile of TRPV4 OE and EV brain ECs under homeostasis and inflammation. Accessed categories cover transporters, immune cell migration, inflammatory and EndMT markers, N = 3 df Examples of differentially expressed targets were re-plotted as bar graphs to visualize effect size. Data represents mean ± SEM. Comparison of four groups was performed using one-way ANOVA with Bonferroni multiple comparisons test or non-parametric Kruskal–Wallis test with Dunn’s test (*p < 0.05; **p < 0.01; ***p < 0.001)
Fig. 5
Fig. 5
Inhibition of TRPV4 activity reduces T cell migration across the BBB in vitro. a Schematic of the static transwell set-up of 4 h T cell migration across human brain ECs treated with vehicle or TRPV4 antagonist. b Number of CD4+ and CD8+ T cells that migrated across stimulated (TNFα/IFNγ (T/I)) brain ECs treated with TRPV4 antagonist or vehicle normalized to unstimulated control, N experiments = 3, N CD4+ T cell donor = 2, N CD8+ T cell donor = 3. c SELE, VCAM1, and ICAM1 expression in brain ECs treated equally to migration assay for 4 h, N = 3. d Representative image of CD3 and TRPV4 immunoreactivity in human T cells; scale bar: 10 µm. e Cell surface expression of CD11a and CD49d on migrated and non-migrated human CD4+ T cells quantified as an abundance of positive cells and median fluorescent intensity (MFI), N = 3. Data are shown as mean ± SEM and a comparison of two groups was performed using (ratio) paired Student’s t-test indicated by connecting lines (*p < 0.05)
Fig. 6
Fig. 6
Schematic summary of the proposed mechanism underlying TRPV4 expression and function at the BBB in MS

References

    1. Izquierdo G, Hauw JJ, Lyon-Caen O, Marteau R, Escourolle R, Buge A, et al. Clinical analysis of 70 neuropathologic cases of multiple sclerosis. Rev Neurol (Paris) 1985;141(8–9):546–552. - PubMed
    1. Kilsdonk ID, Lopez-Soriano A, Kuijer JP, de Graaf WL, Castelijns JA, Polman CH, et al. Morphological features of MS lesions on FLAIR* at 7 T and their relation to patient characteristics. J Neurol. 2014;261(7):1356–1364. doi: 10.1007/s00415-014-7351-6. - DOI - PubMed
    1. Van Der Valk P, De Groot CJA. Staging of multiple sclerosis (MS) lesions: pathology of the time frame of MS. Neuropathol Appl Neurobiol. 2000;26(1):2–10. doi: 10.1046/j.1365-2990.2000.00217.x. - DOI - PubMed
    1. Van Waesberghe JHTM, Kamphorst W, De Groot CJA, Van Walderveen MAA, Castelijns JA, Ravid R, et al. Axonal loss in multiple sclerosis lesions: magnetic resonance imaging insights into substrates of disability. Ann Neurol. 1999;46(5):747–754. doi: 10.1002/1531-8249(199911)46:5<747::AID-ANA10>3.0.CO;2-4. - DOI - PubMed
    1. Brightman MW, Reese TS. Junctions between intimately apposed cell membranes in the vertebrate brain. J Cell Biol. 1969;40(3):648–677. doi: 10.1083/jcb.40.3.648. - DOI - PMC - PubMed

MeSH terms