. 2024 Jun 11;8(11):2777-2789.
doi: 10.1182/bloodadvances.2023012367.

SARS-CoV-2 infection modifies the transcriptome of the megakaryocytes in the bone marrow

Affiliations

SARS-CoV-2 infection modifies the transcriptome of the megakaryocytes in the bone marrow

Isabelle Allaeys et al. Blood Adv. .

Abstract

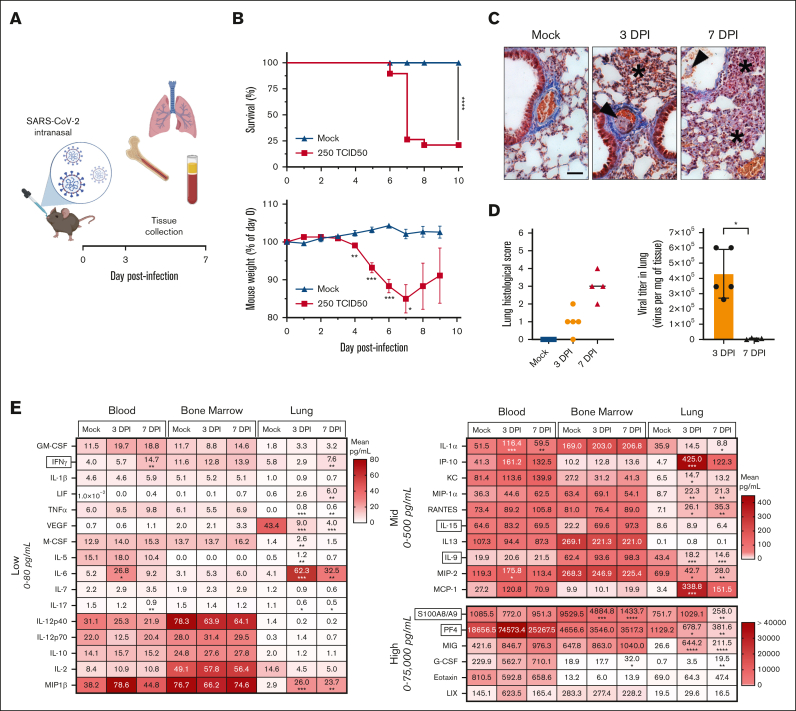
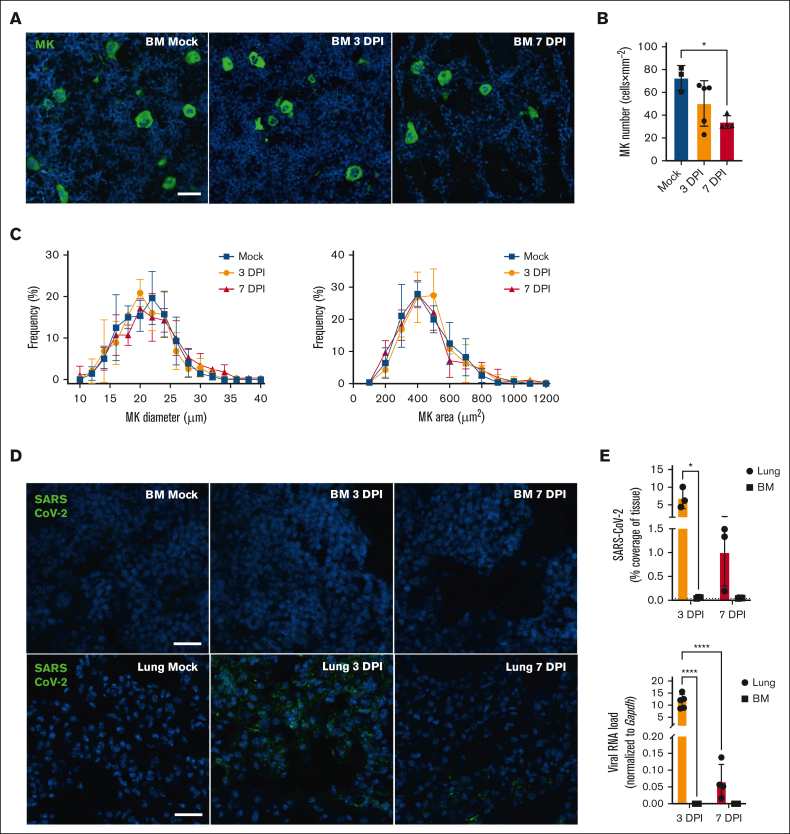
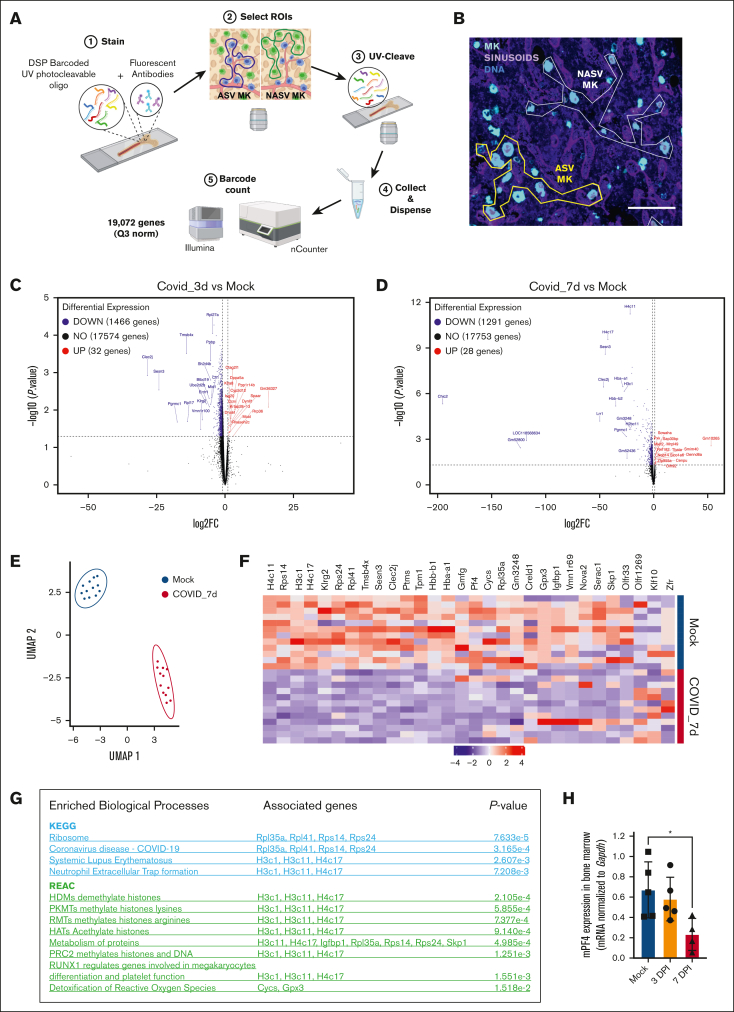
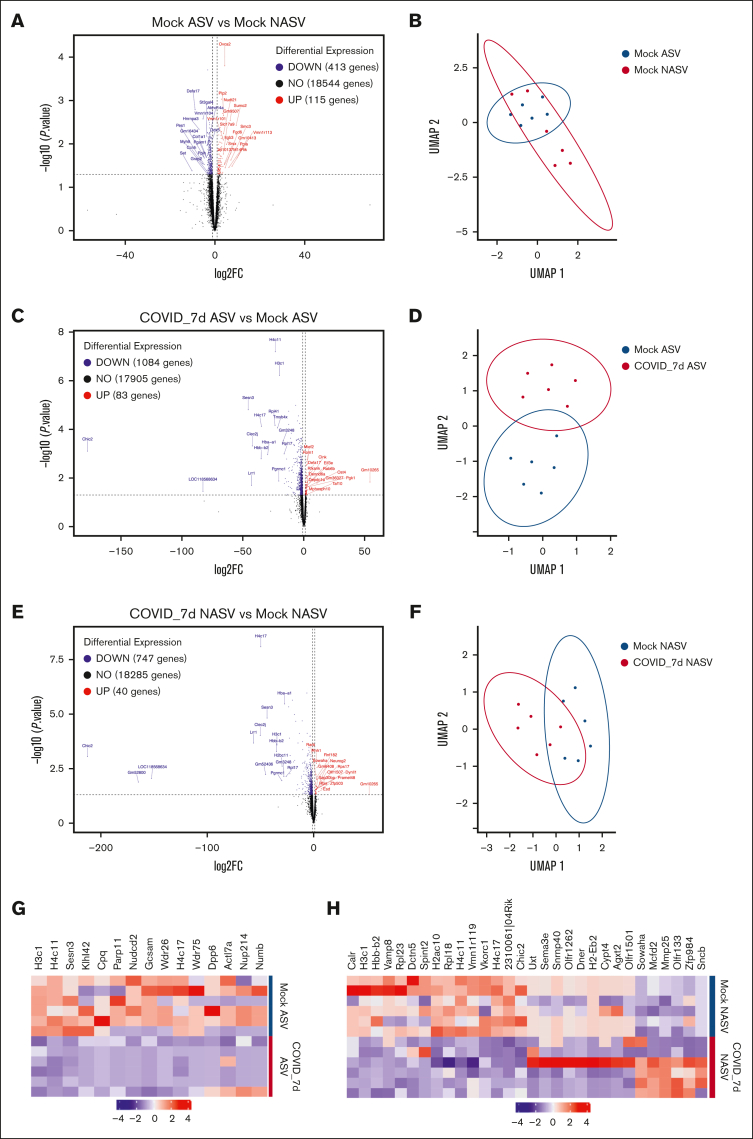
Megakaryocytes (MKs), integral to platelet production, predominantly reside in the bone marrow (BM) and undergo regulated fragmentation within sinusoid vessels to release platelets into the bloodstream. Inflammatory states and infections influence MK transcription, potentially affecting platelet functionality. Notably, COVID-19 has been associated with altered platelet transcriptomes. In this study, we investigated the hypothesis that severe acute respiratory syndrome coronavirus 2 (SARS-CoV-2) infection could affect the transcriptome of BM MKs. Using spatial transcriptomics to discriminate subpopulations of MKs based on proximity to BM sinusoids, we identified ∼19 000 genes in MKs. Machine learning techniques revealed that the transcriptome of healthy murine BM MKs exhibited minimal differences based on proximity to sinusoid vessels. Furthermore, at peak SARS-CoV-2 viremia, when the disease primarily affected the lungs, MKs were not significantly different from those from healthy mice. Conversely, a significant divergence in the MK transcriptome was observed during systemic inflammation, although SARS-CoV-2 RNA was never detected in the BM, and it was no longer detectable in the lungs. Under these conditions, the MK transcriptional landscape was enriched in pathways associated with histone modifications, MK differentiation, NETosis, and autoimmunity, which could not be explained by cell proximity to sinusoid vessels. Notably, the type I interferon signature and calprotectin (S100A8/A9) were not induced in MKs under any condition. However, inflammatory cytokines induced in the blood and lungs of COVID-19 mice were different from those found in the BM, suggesting a discriminating impact of inflammation on this specific subset of cells. Collectively, our data indicate that a new population of BM MKs may emerge through COVID-19-related pathogenesis.


Conflict of interest statement

Conflict-of-interest disclosure: The authors declare no competing financial interests.

Figures

None
Graphical abstract
Figure 1.
Figure 1.
SARS-CoV-2 infection in the K18-hACE2 mouse model. (A) Schematic representation of the mouse experimental protocol. K18-hACE2 mice were inoculated intranasally with SARS-CoV-2 (250 TCID50) or control media. Tissues (plasma [blood], bone marrow, and lung) were collected at 3 and 7 days after infection (DPI). (B) Survival curve of K18-hACE2 mice upon challenge with SARS-CoV-2 (250 TCID50, red color) or with control media (Mock, black color). Mortality (end point requiring euthanasia) expressed as percentage of survival was monitored every day for 10 days (top; n = 17-19 per group). Survival curve statistical analysis was calculated with Log-rank (Mantel-Cox) test; ∗∗∗∗P < .0001. Weight change (bottom; n = 4-40) was also reported every day for 10 days and expressed as mean (± SD) percentage of weight at day 0; the average weight before infection was 19.55 ± 2.95 g. Unpaired t-test with Welch correction was used to determine significance (P < .05; ∗∗P < .01; and ∗∗∗P < .001). (C) Lung sections were stained with a Modified Carstairs method for fibrin and platelets detection: fibrin (bright red), platelets (gray-blue), collagen (bright blue), and red blood cells (orange-yellow). Platelet thrombus (arrow head) and cell infiltration (asterix) are indicated (scale bar, 100 μm). (D) Lung damage was evaluated using a histological score (left) and lung virus titer (right) was quantified at 3 and 7 DPI using lung homogenate on vero cells and expressed in TCID50 per mg of tissue (n = 4-5 per group). Statistics: Mann-Whitney test; P < .05. (E) Heat map of cytokine and growth factor profiles in blood plasma (blood), bone marrow plasma (bone marrow), and lung during SARS-CoV2 infection (3 DPI, 7 DPI, or Mock). Cytokine levels (pg/mL) were subdivided into 3 groups: 0 to 80 pg/mL (low), 0 to 450 pg/mL (mid), and 0 to 75 000 pg/mL (high). The mean concentration for each cytokine is indicated (n = 4-5). Statistics: 1-way analysis of variance (ANOVA) with Dunnett multiple comparisons (compared with Mock); P <  .05; ∗∗P <  .01; ∗∗∗P < .001; and ∗∗∗∗P < .0001; n = 4-5 per group.
Figure 2.
Figure 2.
Megakaryocyte and SARS-CoV-2 detection in tissue during COVID-19. (A) Representative immunofluorescence images of BM MK during SARS-CoV-2 infection. Femurs of mice inoculated with SARS-CoV-2 (3 DPI or 7 DPI) or Mock-infected were stained with anti-CD41 (green) and the nuclei counterstained with Hoechst (blue; scale bar, 20 μm). (B) Megakaryocyte number was quantified in femurs and expressed as mean (± SD) × mm–2 of tissue. Statistics: 1-way ANOVA with Tukey's multiple comparisons, P < .05; n = 3-5 per group. (C) Frequency distribution of MK size (diameter in μm; left) and area (surface in μm2 right panel) were analyzed, percentages of frequency are expressed as mean (± SD). Statistics, 2-way ANOVA, Mixed-effects analysis with Tukey's multiple comparisons test; n = 4-5 per group. (D) Representative immunofluorescence images of BM or lung during SARS-CoV-2 infection. SARS-CoV-2 was detected using anti–SARS-CoV-2 nucleocapsid (green), and nuclei were counterstained with Hoechst (blue) (scale bar, 25 μm). (E) Tissues from mice uninfected (Mock) or infected with SARS-CoV-2 for 3 days or 7 days were analyzed for the presence of SARS-CoV-2. Results are expressed as mean (± SD) of SARS-CoV-2 coverage (% of tissue; top; dotted line indicates the mean value obtained for mock tissues). Viral RNA levels were determined in BM by RT-ddPCR and compared with those in the lungs (bottom). SARS-CoV-2 E gene copies were normalized with Gapdh mRNA copies (n = 4-5 mice per condition). Results are expressed as mean (± SD). Statistics: 2-way ANOVA, mixed-effects analysis with uncorrected Fisher's LSD, P < .05; ∗∗∗∗P < .0001; n = 3-5 per group. BM, bone marrow; DPI, day post-infection; LSD, least significant difference; MK, megakaryocytes; RT-ddPCR, reverse transcription digital droplet polymerase chain reaction.
Figure 3.
Figure 3.
Spatial transcriptomic analysis of bone marrow megakaryocytes during SARS-CoV-2 infection. Femurs were analysed from K18-hACE2 mice infected with SARS-CoV2 (500 TCID50) for 3 days (COVID_3d) or 7 days (COVID_7d) or with conditioned media (Mock) for 7 days. Ten-μm sections of paraffin-embedded femurs were used to perform spatial transcriptomic analysis. (A) Schematic illustration of NanoString’s GeoMx Digital Spatial Profiler (DSP) workflow. Different steps are indicated: (1) stain: femur sections were hybridized with UV photocleavable probes from the whole mouse genome and fluorescent morphology markers; (2) ROI were selected based on the fluorescence of interest (CD41) and whether MK were adjacent to sinusoid vessels (ASV-MK) or nonadjacent to sinusoid vessels (NASV-MK); (3) ROI were illuminated with UV light that released the barcodes; (4) Each ROI was collected independently using microcapillaries; (5) Sequencing libraries were generated followed by sequencing and counting. A total of 19 072 genes normalized by third quartile (Q3) were expressed above Limit of Quantitation (LOQ) in at least 10% of ROI. (B) Immunofluorescence staining of bone marrow (femur) using morphology markers. Anti-CD41 antibody (turquoise) was used to stain MK, anti-endomucin antibody (purple) to stain sinusoids, and SYTO dye (blue) to stain nuclei; scale bar, 125 μm. Representative ROI (6-8 megakaryocytes per ROI) are illustrated in the right panel. ROI with ASV-MK is yellow, and ROI with NASV-MK is white. (C, D) Volcano Plots comparing COVID_3d (C) or COVID_7d (D) vs Mock. The log2 fold change of each gene is plotted against its statistical significance (−log10 P value). Red dots represent genes significantly upregulated and blue dots, genes significantly downregulated in MK during COVID-19. Thresholds are indicated with dotted lines. (E) UMAP plot of the short (30) gene signature of MK-ROI colored by class (blue circles: Mock [n = 12]; red circles: COVID_7d [n = 12]). (F) Heat map showing differences of the 30-gene signature between Mock and COVID_7d. Each row represents a MK-ROI, and each column represents a gene obtained from the short signature. (G) Relevant enriched biological processes using the 30-gene signature and their P values are presented. The 30-gene signature was obtained using a machine learning approach. BioDiscML was used to classified “Mock” and “COVID_7d” groups, and the best model was variable feature importance (VFI) optimized with false discovery rate (FDR). MCC for the model was 0.997. (H) PF4 mRNA expression was evaluated in bone barrow by RT-ddPCR. PF4 mRNA copies were normalized with Gapdh mRNA copies (n = 4-5 mice per condition). Results are expressed as mean (± SD). Statistics: unpaired t-test with Welch correction; P < .05 (n = 4-5 per condition). MK, megakaryocytes; mPF4, mouse platelet factor 4; mRNA, messenger RNA; RT-ddPCR, reverse transcription digital droplet polymerase chain reaction.
Figure 4.
Figure 4.
Spatial transcriptomic analysis of megakaryocytes within the bone marrow. MK-ROI were selected depending on their position: ASV- or NASV-MK. (A) Volcano plots (Mock ASV-MK [n = 6] vs Mock NASV-MK [n = 6]) shows the log2 fold-change of each gene plotted against its statistical significance (−log10 P value). Red dots represent genes significantly upregulated and blue dots, genes significantly downregulated in megakaryocytes depending on their position. Thresholds are indicated with dotted lines. (B) UMAP plot of the short gene signature of MK-ROI colored by class in Mock condition (blue circles: Mock ASV [n = 6]; red circles: Mock NASV [n = 6]). (C) Volcano plot of COVID_7d ASV-MK (n = 6) vs Mock ASV-MK (n = 6) (left) and COVID_7d NASV-MK (n = 6) vs Mock NASV-MK (n = 6) (right) showing the log2 fold-change of each gene plotted against its statistical significance (−log10 P value). Red dots represent genes significantly upregulated and blue dots, genes significantly downregulated in megakaryocytes during COVID-19. Thresholds are indicated with dotted lines. (D) UMAP plot of the short gene signature of MK-ROI colored by class in Mock ASV-MK (blue circles [n = 6]; and COVID_7d ASV-MK red circles [n = 6]). (E) Volcano plot (COVID_7d NASV-MK [n = 6] vs Mock NASV-MK [n = 6]) show the log2 fold-change of each gene plotted against its statistical significance (−log10 P value). Red dots represent genes significantly upregulated and blue dots, genes significantly downregulated in megakaryocytes depending on their position. Thresholds are indicated with dotted lines. (F) UMAP plot of the short gene signature of MK-ROI colored by class in Mock NASV-MK (blue circles [n = 6]) and COVID_7d NASV-MK (red circles [n = 6]). (G) Heat map showing differences of the 15-gene signature between ASV-MK in Mock and COVID_7d. Each row represents a MK-ROI and each column represents a gene obtained from the short signature. The 15-gene signature was obtained using a machine learning approach. BioDiscML was used to classify “Mock ASV-MK” and “COVID_7d ASV-MK.” The best model was the Functions Logistic optimized with BER (Balanced Error Rate), and MCC for the model was 0.922 ± 0.113. (H) Heat map showing differences of the 30-gene signature between NASV-MK in Mock and COVID_7d. Each row represents a MK-ROI, and each column represents a gene obtained from the short signature. The 15-gene signature was obtained using a machine learning approach. BioDiscML was used to classified “Mock NASV-MK” and “COVID_7d NASV-MK.” The best model was the complement Naïve Bayes with FDR; MCC for the model was 0.922 ± 0.114.

Similar articles

Cited by

References

    1. Machlus KR, Italiano JE., Jr. The incredible journey: from megakaryocyte development to platelet formation. J Cell Biol. 2013;201(6):785–796. - PMC - PubMed
    1. Tilburg J, Becker IC, Italiano JE. Don’t you forget about me(gakaryocytes) Blood. 2022;139(22):3245–3254. - PMC - PubMed
    1. Schulze H, Stegner D. Imaging platelet biogenesis in vivo. Res Pract Thromb Haemost. 2018;2(3):461–468. - PMC - PubMed
    1. Bruns I, Lucas D, Pinho S, et al. Megakaryocytes regulate hematopoietic stem cell quiescence through CXCL4 secretion. Nat Med. 2014;20(11):1315–1320. - PMC - PubMed
    1. Gong Y, Zhao M, Yang W, et al. Megakaryocyte-derived excessive transforming growth factor beta1 inhibits proliferation of normal hematopoietic stem cells in acute myeloid leukemia. Exp Hematol. 2018;60:40–46.e2. - PubMed

Publication types