. 2024 May-Jun:137:100765.
doi: 10.1016/j.diff.2024.100765. Epub 2024 Mar 11.

Cell cycle perturbation uncouples mitotic progression and invasive behavior in a post-mitotic cell

Affiliations

Cell cycle perturbation uncouples mitotic progression and invasive behavior in a post-mitotic cell

Michael A Q Martinez et al. Differentiation. 2024 May-Jun.

Abstract

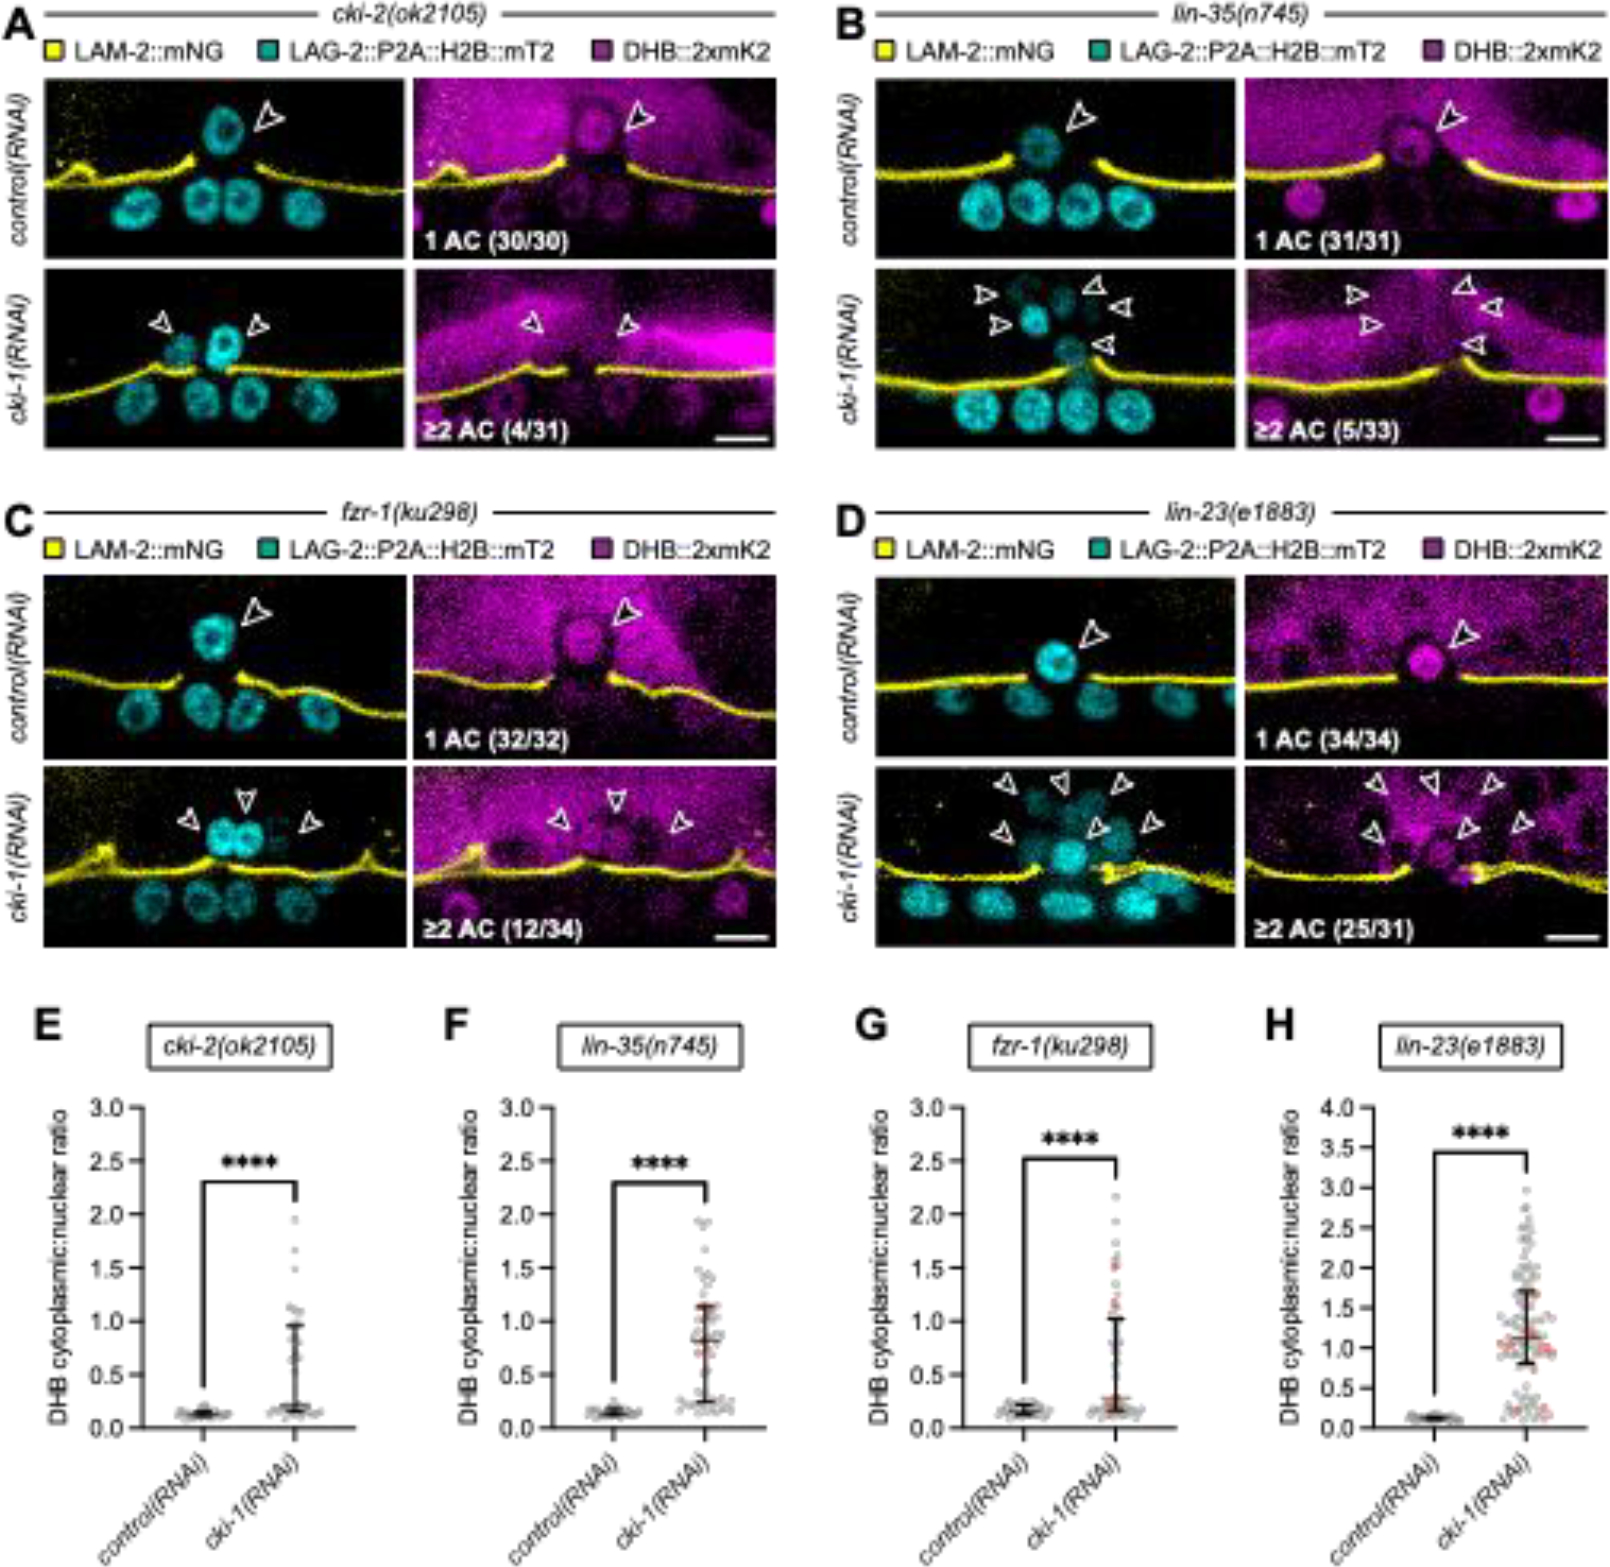
The acquisition of the post-mitotic state is crucial for the execution of many terminally differentiated cell behaviors during organismal development. However, the mechanisms that maintain the post-mitotic state in this context remain poorly understood. To gain insight into these mechanisms, we used the genetically and visually accessible model of C. elegans anchor cell (AC) invasion into the vulval epithelium. The AC is a terminally differentiated uterine cell that normally exits the cell cycle and enters a post-mitotic state before initiating contact between the uterus and vulva through a cell invasion event. Here, we set out to identify the set of negative cell cycle regulators that maintain the AC in this post-mitotic, invasive state. Our findings revealed a critical role for CKI-1 (p21CIP1/p27KIP1) in redundantly maintaining the post-mitotic state of the AC, as loss of CKI-1 in combination with other negative cell cycle regulators-including CKI-2 (p21CIP1/p27KIP1), LIN-35 (pRb/p107/p130), FZR-1 (Cdh1/Hct1), and LIN-23 (β-TrCP)-resulted in proliferating ACs. Remarkably, time-lapse imaging revealed that these ACs retain their ability to invade. Upon examination of a node in the gene regulatory network controlling AC invasion, we determined that proliferating, invasive ACs do so by maintaining aspects of pro-invasive gene expression. We therefore report that the requirement for a post-mitotic state for invasive cell behavior can be bypassed following direct cell cycle perturbation.

Keywords: C. elegans; CKI-1; Dichotomy; Invasion; Proliferation.


Conflict of interest statement

Competing interests

The authors declare no competing interests.

Figures

Figure 1.
Figure 1.. Moderate increase in AC proliferation is observed upon systemic depletion of CKI-1.
(A) Schematic of the C. elegans invasion/proliferation dichotomy. (B) Schematic of the CDK activity sensor, DHB, which is phosphorylated by CDK and translocates from the nucleus to the cytoplasm in response to CDK activity during cell cycle progression. The equation used to quantify CDK activity is shown. (C) DIC (left) and confocal images merging LAM-2::mNeonGreen with LAG-2::P2A::H2B::mTurquoise2 (middle) and DHB::2xmKate2 (right) from the P6.p 1-cell stage to the P6.p 4-cell stage are shown. Arrowheads and brackets indicate the position of the AC and P6.p cells, respectively. The scale bar represents 5 μm. (D) Confocal images merging LAM-2::mNeonGreen with LAG-2::P2A::H2B::mTurquoise2 (left) and DHB::2xmKate2 (right) from the P6.p 4-cell stage are shown. Arrowheads indicate the position of the AC(s) in rrf-3(pk1426) animals following control(RNAi) and cki-1(RNAi) treatment. The scale bar represents 5 μm. (E) Scatter plot displays the median and IQR of DHB::2xmKate2 ratios in the AC(s) of rrf-3(pk1426) animals following control(RNAi) and cki-1(RNAi) treatment (N ≥ 30 animals per treatment). Gray dots correspond to cells where the BM is broken, and red dots correspond to cells where the BM is intact. Statistical significance was determined by a Mann-Whitney test (P < 0.0004). See also Figure S1, S2.
Figure 2.
Figure 2.. CKI-1 is critical for maintaining the post-mitotic state of the AC.
(A-D) Confocal images merging LAM-2::mNeonGreen with LAG-2::P2A::H2B::mTurquoise2 (left) and DHB::2xmKate2 (right) from the P6.p 4-cell stage are shown. Arrowheads indicate the position of the AC(s) in cki-2(ok2105) (A), lin-35(n745) (B), fzr-1(ku298) (C), and lin-23(e1883) (D) animals following control(RNAi) and cki-1(RNAi) treatment. Scale bars represent 5 μm. (E-H) Scatter plots display the median and IQR of DHB::2xmKate2 ratios in the AC(s) of cki-2(ok2105) (E), lin-35(n745) (F), fzr-1(ku298) (G), and lin-23(e1883) (H) animals following control(RNAi) and cki-1(RNAi) treatment (N ≥ 30 animals per treatment). Gray dots correspond to cells where the BM is broken, and red dots correspond to cells where the BM is intact. Statistical significance was determined by a Mann-Whitney test (P < 0.0001).
Figure 3.
Figure 3.. Maintenance of the post-mitotic state is not required for AC invasion.
(A) Static images of cdh-3p::mCherry::moesinABD (left), LAM-2::mNeonGreen (middle), and DHB::2xmTurquoise2 (right) from the P6.p 4-cell stage are shown. Arrowheads indicate the position of the AC in a fzr-1(ku298); control(RNAi) animal. The DHB::2xmTurquoise2 ratio of the AC is 0.26. The scale bar represents 5 μm. (B) Time-lapse images of cdh-3p::mCherry::moesinABD (left), LAM-2::mNeonGreen (middle), and DHB::2xmTurquoise2 (right) from pre-AC invasion to post-AC invasion are shown. Arrowheads indicate the position of multiple invading ACs in a fzr-1(ku298); cki-1(RNAi) animal. At the initiation of invasion time-point, the DHB::2xmTurquoise2 ratio is 1.56 for the AC on the left and 1.76 for the AC on the right, values that are most consistent with the G2 phase of the cell cycle (Adikes et al., 2020). The scale bar represents 5 μm. See also Movie 1 and Figure S3.
Figure 4.
Figure 4.. Proliferating, invasive ACs retain a functionally intact pro-invasive GRN.
(A) Confocal images of LAG-2::P2A::H2B::mTurquoise2 (left), NHR-67::mNeonGreen (middle), LAM-2::mNeonGreen (middle), and DHB::2xmKate2 (right) from the P6.p 4-cell stage are shown. Arrowheads indicate the position of the AC(s) in fzr-1(ku298) animals following control(RNAi) and cki-1(RNAi) treatment. The scale bar represents 5 μm. (B) Plot displays mean and SD of normalized NHR-67::mNeonGreen intensity in the AC(s) of fzr-1(ku298) animals following control(RNAi) and cki-1(RNAi) treatment (N ≥ 30 animals per treatment). Statistical significance was determined by a one-way ANOVA (ns = non-significant, *P = 0.0176, ****P < 0.0001). (C) Confocal images of zmp-1p::CFP (left), LAM-2::mNeonGreen (middle), and DHB::2xmKate2 (right) from the P6.p 4-cell stage are shown. Arrowheads indicate the position of the AC(s) in fzr-1(ku298) animals following control(RNAi) and cki-1(RNAi) treatment. The scale bar represents 5 μm. (D) Plot displays mean and SD of normalized zmp-1p::CFP intensity in the AC(s) of fzr-1(ku298) animals following control(RNAi) and cki-1(RNAi) treatment (N ≥ 31 animals per treatment). Statistical significance was determined by a one-way ANOVA (**P = 0.0034, ****P < 0.0001).
Figure 5.
Figure 5.. Model for breaking the invasion/proliferation dichotomy.
Schematic depicts a summary of previously reported data (left top and bottom) and data from this study (right top and bottom). Wild-type single ACs can only invade in a G0 state (top left, grey box). Loss of single negative cell cycle regulators fail to trigger cell cycle entry, the AC remains in a G0 state, and still invades (top right, grey box). We hypothesize that CKI-1 levels increase to prevent cell cycle entry in response to loss of the other negative cell cycle regulators. Loss of the transcription factor, NHR-67, results in cycling ACs that proliferate and do not invade (bottom left, white box). Dual loss of cell cycle regulators results in proliferative ACs that retain some invasive capacity (bottom right, white box), likely due to core components of the AC invasion GRN remaining functional.

Update of

References

    1. Adikes RC, Kohrman AQ, Martinez MAQ, Palmisano NJ, Smith JJ, Medwig-Kinney TN, Min M, Sallee MD, Ahmed OB, Kim N, Liu S, Morabito RD, Weeks N, Zhao Q, Zhang W, Feldman JL, Barkoulas M, Pani AM, Spencer SL, Martin BL, Matus DQ, 2020. Visualizing the metazoan proliferation-quiescence decision in vivo. eLife 9, e63265. 10.7554/eLife.63265 - DOI - PMC - PubMed
    1. Ajioka I, Martins RAP, Bayazitov IT, Donovan S, Johnson DA, Frase S, Cicero SA, Boyd K, Zakharenko SS, Dyer MA, 2007. Differentiated Horizontal Interneurons Clonally Expand to Form Metastatic Retinoblastoma in Mice. Cell 131, 378–390. 10.1016/j.cell.2007.09.036 - DOI - PMC - PubMed
    1. Boxem M, van den Heuvel S, 2002. C. elegans Class B Synthetic Multivulva Genes Act in G1 Regulation. Current Biology 12, 906–911. 10.1016/S0960-9822(02)00844-8 - DOI - PubMed
    1. Boxem M, van den Heuvel S, 2001. lin-35 Rb and cki-1 Cip/Kip cooperate in developmental regulation of G1 progression in C. elegans. Development 128, 4349–4359. 10.1242/dev.128.21.4349 - DOI - PubMed
    1. Brenner S, 1974. The genetics of Caenorhabditis elegans. Genetics 77, 71–94. 10.1093/genetics/77.1.71 - DOI - PMC - PubMed

Publication types

MeSH terms

Substances

LinkOut - more resources