. 2024 Aug;20(8):1879-1894.
doi: 10.1080/15548627.2024.2334111. Epub 2024 Mar 27.

Design and validation of a reporter mouse to study the dynamic regulation of TFEB and TFE3 activity through in vivo imaging techniques

Affiliations

Design and validation of a reporter mouse to study the dynamic regulation of TFEB and TFE3 activity through in vivo imaging techniques

Electra Brunialti et al. Autophagy. 2024 Aug.

Abstract

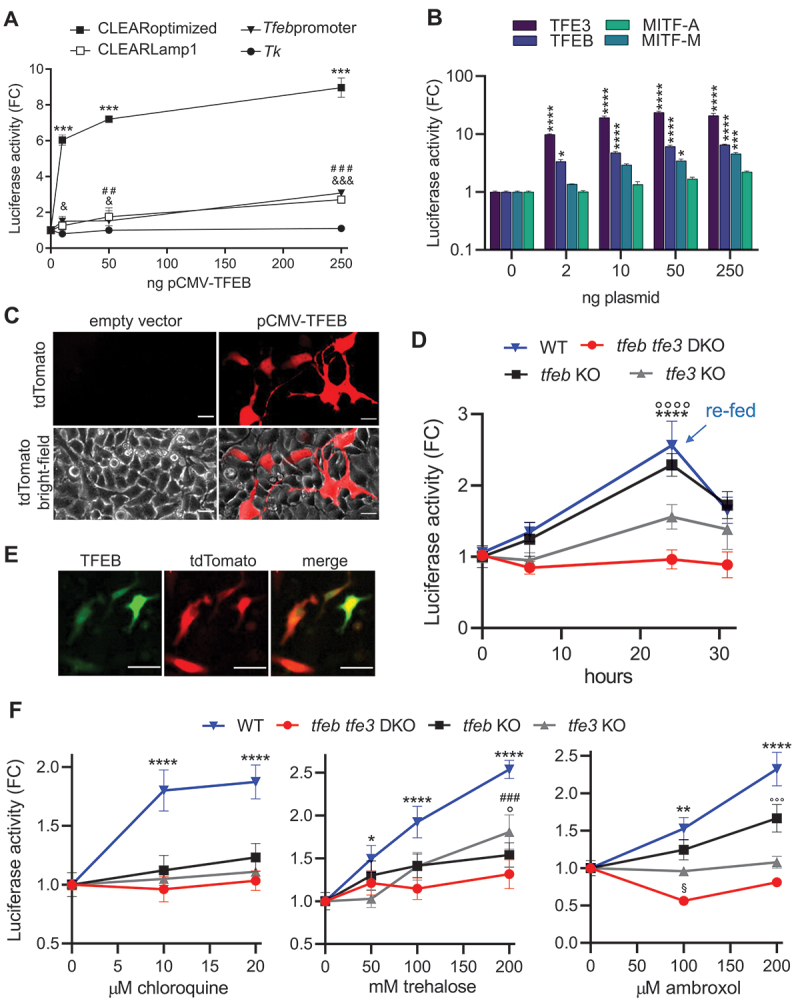
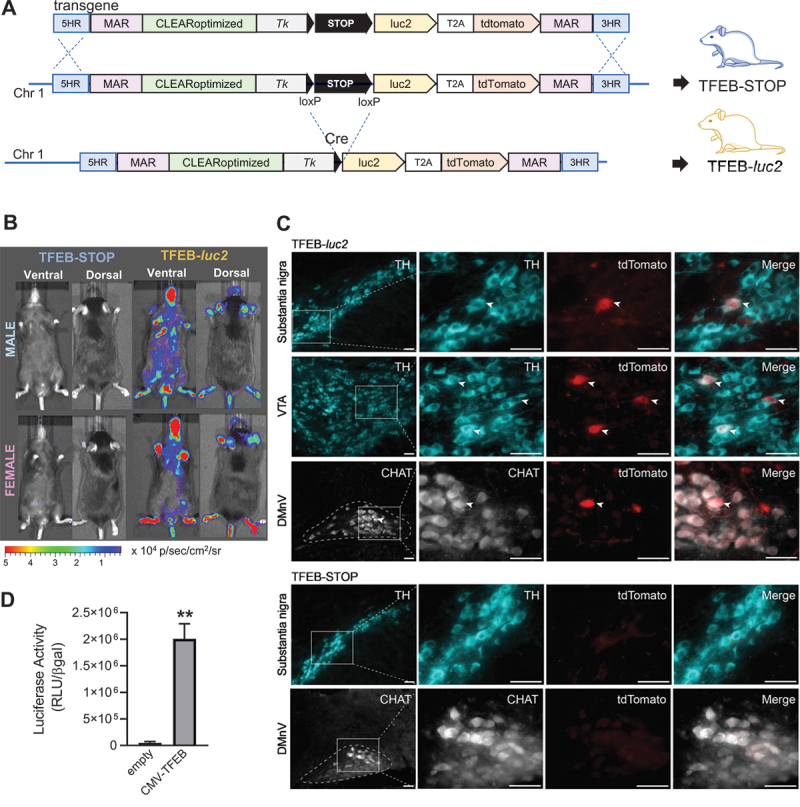
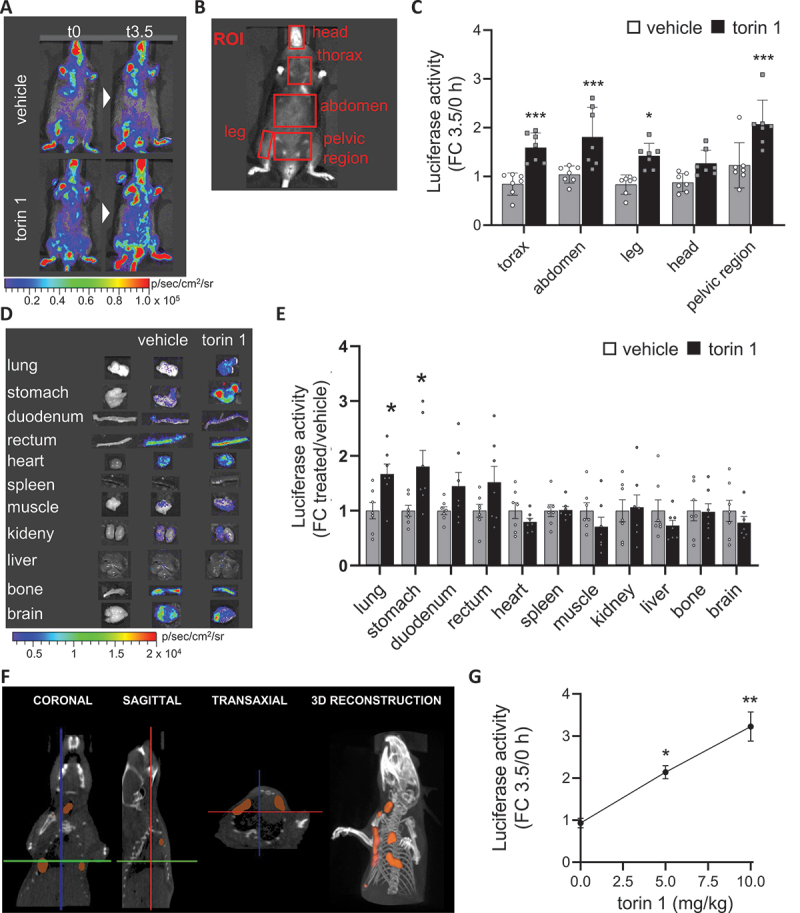
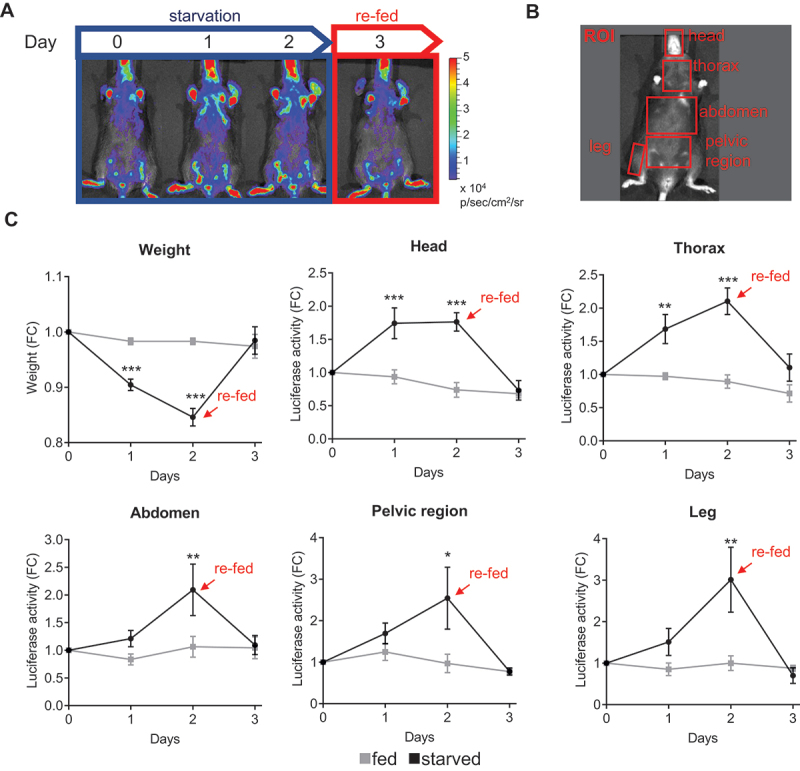
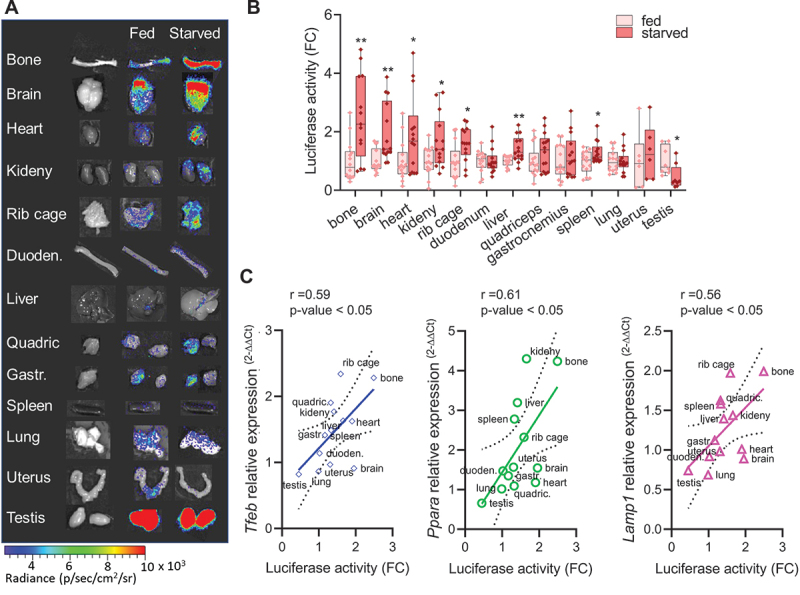
TFEB and TFE3 belong to the MiT/TFE family of transcription factors that bind identical DNA responsive elements in the regulatory regions of target genes. They are involved in regulating lysosomal biogenesis, function, exocytosis, autophagy, and lipid catabolism. Precise control of TFEB and TFE3 activity is crucial for processes such as senescence, stress response, energy metabolism, and cellular catabolism. Dysregulation of these factors is implicated in various diseases, thus researchers have explored pharmacological approaches to modulate MiT/TFE activity, considering these transcription factors as potential therapeutic targets. However, the physiological complexity of their functions and the lack of suitable in vivo tools have limited the development of selective MiT/TFE modulating agents. Here, we have created a reporter-based biosensor, named CLEARoptimized, facilitating the pharmacological profiling of TFEB- and TFE3-mediated transcription. This innovative tool enables the measurement of TFEB and TFE3 activity in living cells and mice through imaging and biochemical techniques. CLEARoptimized consists of a promoter with six coordinated lysosomal expression and regulation motifs identified through an in-depth bioinformatic analysis of the promoters of 128 TFEB-target genes. The biosensor drives the expression of luciferase and tdTomato reporter genes, allowing the quantification of TFEB and TFE3 activity in cells and in animals through optical imaging and biochemical assays. The biosensor's validity was confirmed by modulating MiT/TFE activity in both cell culture and reporter mice using physiological and pharmacological stimuli. Overall, this study introduces an innovative tool for studying autophagy and lysosomal pathway modulation at various biological levels, from individual cells to the entire organism.Abbreviations: CLEAR: coordinated lysosomal expression and regulation; MAR: matrix attachment regions; MiT: microphthalmia-associated transcription factor; ROI: region of interest; TBS: tris-buffered saline; TF: transcription factor; TFE3: transcription factor binding to IGHM enhancer 3; TFEB: transcription factor EB; TH: tyrosine hydroxylase; TK: thymidine kinase; TSS: transcription start site.

Keywords: Autophagy; drug discovery; luciferase; lysosomal pathway; non-invasive study of TFEB and TFE3; optical imaging.


Conflict of interest statement

No potential conflict of interest was reported by the author(s).

Figures

Figure 1.
Figure 1.
Validation of pCLEARoptimized. (A) Luciferase activity was measured in HeLa cells transiently co-transfected with the indicated reporter vectors and a plasmid expressing the TFEB protein (pCMV-TFEB). Data are mean values ± SD (n = 2) in duplicate, and the luciferase activity is expressed as fold change (FC) of normalized RLU compared to the mean value of the same construct co-transfected with an empty vector. ***p < 0.0001: CLEARoptimized; &<0.05, &&&<0.0001: Tfebpromoter; ##<0.005: CLEARLamp1; versus 0 ng pCMV-TFEB calculated by 2-way ANOVA followed by Tukey’s multiple comparisons test. (B) Luciferase activity was measured in RCS cells co-transfected with pCLEARoptimized and increasing concentration of a plasmid expressing TFEB, TFE3, MITF-A or MITF-M. Data represent fold change (FC) of normalized RLU versus vehicle ± SEM (n = 4) in duplicate; *p < 0.05, ***p < 0.0005, ****p < 0.0001 versus 0 ng of pCMV-plasmid calculated by 2-way ANOVA followed by Tukey’s multiple comparisons test. (C) Representative pictures of tdTomato fluorescence, and the merge with the bright-field, of the pCLEARoptimized co-transfected with 250 ng of an empty vector or pCMV-TFEB for 24 h. (D) Luciferase activity was measured in RCS cell line transiently transfected with pCLEARoptimized and grown in diluted media. At 24 h, the media was replaced with complete media (re-fed). Data represent FC of normalized RLU versus vehicle ± SD (n = 3) in triplicate; ****p < 0.0001: WT; °°°° p < 0.0001: tfeb KO versus time 0 calculated with one-way ANOVA followed by Dunnett’s multiple comparisons test. (E) Representative pictures of the fluorescence emitted by tdTomato (red) in cells co-transfected with the pCLEARoptimized vector with a vector expressing a fusion protein between TFEB and GFP (TFEB in green), and merge of the two signals. (F) Luciferase activity was measured in RCS cell lines transiently transfected with the pCLEARoptimized and treated with agents capable of eliciting TFEB activation for 16 h: chloroquine, trehalose, ambroxol. Bars represent FC of normalized RLU versus vehicle ± SD (n = 3) in triplicate; *p < 0.05, **p < 0.005, ****p < 0.0001: WT; ###p <0.001: tfe3 KO; °p < 0.05, °°°p < 0.001: tfeb KO; versus vehicle calculated with one-way ANOVA followed by Dunnett’s multiple comparisons test.
Figure 2.
Figure 2.
Characterization of TFEB-STOP and TFEB-luc2 mice. (A) Schematic representation of the transgene inserted in chromosome 1 (Chr1) of reporter mice using homologous recombination prior (upper) to and after excision of the STOP sequence (lower). The reporter mouse with the STOP sequence is called TFEB-STOP. The breeding of this line with B6.C-Tg(CMV-cre)1Cgn/J mice (cre) triggers the excision of the STOP and the generation of the TFEB-luc2 line. 5 HR, 3 HR: homologous regions for integration into chromosome 1 (Chr1); MAR: matrix attachment regions; CLEARoptimized: TFEB responsive element developed in this work; Tk: minimal thymidine kinase promoter; luc2: optimized firefly luciferase 2; T2A: self-proteolytic peptide; tdTomato: tdTomato red fluorescent protein; STOP: POLR2 (RNA polymerase II) termination signal; loxP: locus of X-over P1. (B) Representative pictures of ventral and dorsal luciferase emission of TFEB-STOP and TFEB-luc2 mice (female and male). Pseudocolor images of each mouse were obtained 15 min after the subcutaneous injection of 80 mg/kg of luciferin with a 5-min exposure time and reported with corresponding scale bars. (C) Expression of the tdTomato reporter in specific cell types of TFEB-luc2 mice. Coronal brain sections of the midbrain and medulla oblongata of TFEB-luc2 and TFEB-STOP mice were double-stained with a tdTomato antibody together with an antibody against TH (tyrosine hydroxylase; midbrain) or CHAT (choline acetyltransferase; medulla oblongata). Squares in the lower magnification images (panels on the left) encompass areas of the substantia nigra pars compacta, ventral tegmental area (VTA) and dorsal motor nucleus of the vagus nerve (DMnV; delineated by dashed lines) that are enlarged on the right. Co-immunoreactive neurons (arrowheads) were observed in sections from TFEB-luc2 but not TFEB-STOP mice. Scale bars: 50 μm. (D) Luciferase activity in lung homogenate dissected 24 h after the in vivo transfection of TFEB-luc2 mice with an empty vector (empty) or a vector allowing the heterologous expression of TFEB (pCMV-TFEB). Bars represent RLU normalized for transfection efficiency ± SD (n = 2), **p < 0.01 versus empty vector calculated with unpaired t-test.
Figure 3.
Figure 3.
TFEB-luc2 reporter mouse responds to pharmacological TFEB activation. (A) Representative in vivo imaging of TFEB-luc2 mice treated with torin 1 (5 mg/kg) or vehicle at 0 or 3.5 h after the treatment. Pseudocolor images of bioluminescence are represented according to the reported scale bar. (B) In vivo bioluminescence was quantified in selected regions of interest (ROIs: red square). (C) Quantification of the bioluminescent light from ROIs of mice treated as in A. Bars represent photon emissions (p/s/cm2/sr) expressed as fold induction versus time 0 ± SD (n = 7); *p < 0.05, ***p < 0.001 versus vehicle calculated with one-way ANOVA followed by Sidak’s multiple comparisons test. (D) Pseudocolor image of the bioluminescence emitted from representative organs dissected 3.5 h after torin 1 or vehicle treatment and (E) bioluminescence quantification. Bars represent photon emissions (p/s/cm2/sr) expressed as fold induction versus vehicle ± SD (n = 7); *p < 0.05, versus vehicle calculated with one-way ANOVA followed by Sidak’s multiple comparisons test. (F) Coronal, sagittal and, transaxial section and 3D reconstruction of the X-ray and bioluminescence signal derived from the thoracic area of a TFEB-luc2 mouse injected with 5 mg/kg of torin 1; the area of the bioluminescent signal is represented in orange. (G) Quantification of the bioluminescent light from the whole body of mice treated with 0, 5, 10 mg/kg of torin 1. Y axes represent photon emissions (p/s/cm2/sr) expressed as fold induction versus time 0 ± SD (n = 2); *p < 0.05, **p < 0.005 versus vehicle calculated with one-way ANOVA followed by Dunnett’s multiple comparisons test.
Figure 4.
Figure 4.
TFEB-luc2 reporter mouse responds to starvation. (A) Schematic representation of the experiments: TFEB-luc2 mice were subjected to starvation for 48 h, and then the food was reintroduced for 24 h. The bioluminescence signal is represented using pseudocolors according to the provided scale bar. (B) In vivo bioluminescence was quantified in selected regions of interest (ROI, red squares). (C) The weight of the mice was recorded during the experiment. Data represent the weight (g) expressed as fold induction (FC) relative to time 0. Bioluminescence imaging quantifications of the photon emission from the ROIs shown in B are reported in the respective graphs. The measurements of bioluminescence signal (luciferase activity) are presented in the graph as fold change (FC) of the radiance photons measured at different time points versus the radiance photons measured at time 0. Data are presented as mean ± SEM (n = 9). *p < 0.05, **p < 0.01, ***p < 0.001 versus fed animals calculated with one-way ANOVA followed by Sidak’s multiple comparisons test.
Figure 5.
Figure 5.
Luciferase activity correlates with TFEB target genes expression. (A) Representative ex vivo bioluminescence imaging of the organs dissected from fed or starved mice. Bioluminescence signals were acquired for each organ obtained from mice subjected to 48 h of starvation or normal feeding and are shown as radiance photons (p/s/cm2/sr) represented with pseudocolors according to the reported scale bar. Quantification of the bioluminescence signals from the organs is reported in (B). The measurements of bioluminescence signal are presented in the graph as fold change (FC) of the radiance photons of starved versus fed animals and presented as mean ± SD of n = 7 independent samples measured in duplicate (6 females, 8 males). Statistical significance was determined by one-way ANOVA followed by Sidak’s multiple comparison test versus fed animals. *p < 0.05, **p < 0.01. (C) Total RNA was purified from dissected organs (B), and the expression of TFEB target gene mRNA (Tfeb, Ppara, Lamp1) was analyzed by real-time PCR. Relative quantification of the transcript was obtained using the 2−ΔΔCt method versus the fed samples and was correlated to the luciferase activity for each organ. Pearson r and p-values for each interpolated curve are reported.

Similar articles

Cited by

References

    1. Steingrímsson E, Copeland NG, Jenkins NA.. Melanocytes and the microphthalmia transcription factor network. Ann Rev Genet. 2004;38(1):365–411. doi: 10.1146/annurev.genet.38.072902.092717 PubMed PMID: 15568981. - DOI - PubMed
    1. Palmieri M, Impey S, Kang H, et al. Characterization of the CLEAR network reveals an integrated control of cellular clearance pathways. Hum Mol Genet. 2011. Oct 1;20(19):3852–3866. doi:10.1093/hmg/ddr306 PubMed PMID: 21752829. - DOI - PubMed
    1. Sardiello M, Palmieri M, Di RA, et al. A gene network regulating lysosomal biogenesis and function. Science. 2009, Jul 24;325(5939):473–477. doi: 10.1126/science.1174447 PubMed PMID: 19556463. - DOI - PubMed
    1. Settembre C, Di Malta C, Polito VA, et al. TFEB links autophagy to lysosomal biogenesis. Science. 2011, Jun 17;332(6036):1429–1433. doi: 10.1126/science.1204592 PubMed PMID: 21617040. - DOI - PMC - PubMed
    1. Aksan I, Goding CR. Targeting the microphthalmia basic helix-loop-helix–leucine zipper transcription factor to a subset of E-box elements in vitro and in vivo. Mol Cell Biol. 1998. Dec;18(12):6930–6938. doi: 10.1128/MCB.18.12.6930 PubMed PMID: 9819381. - DOI - PMC - PubMed

Publication types

Substances