Review
. 2024 May;300(5):107220.
doi: 10.1016/j.jbc.2024.107220. Epub 2024 Mar 22.

Network switches and their role in circadian clocks

Affiliations
Review

Network switches and their role in circadian clocks

Marta Del Olmo et al. J Biol Chem. 2024 May.

Abstract

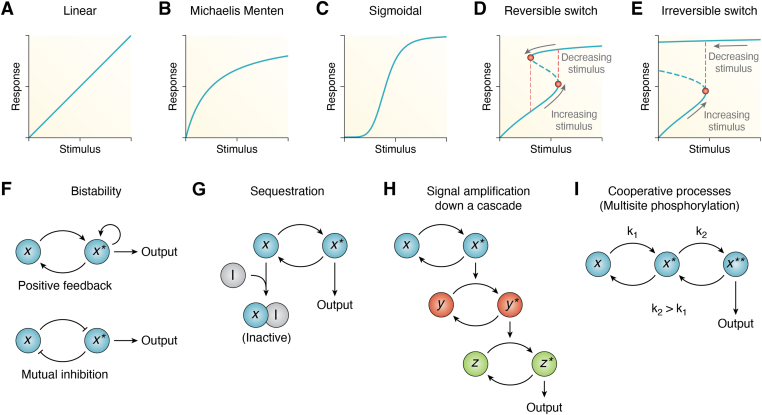
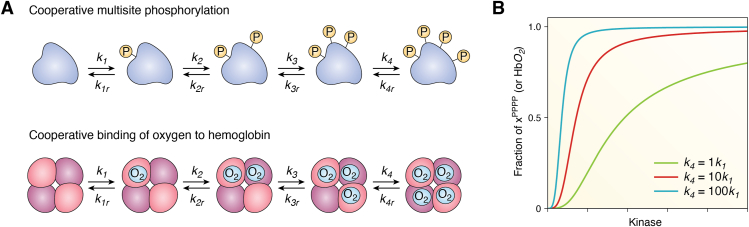
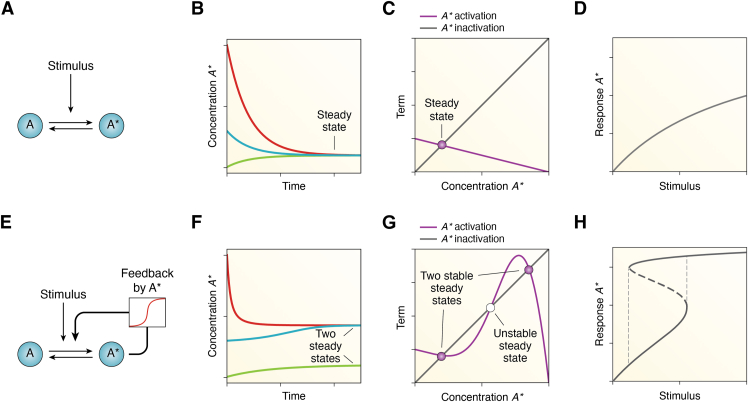
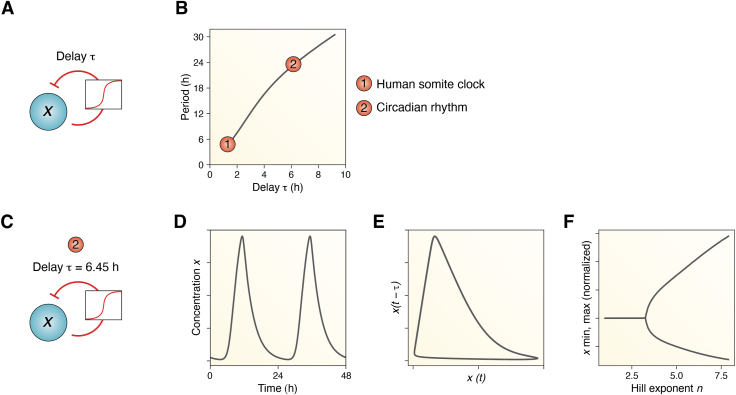
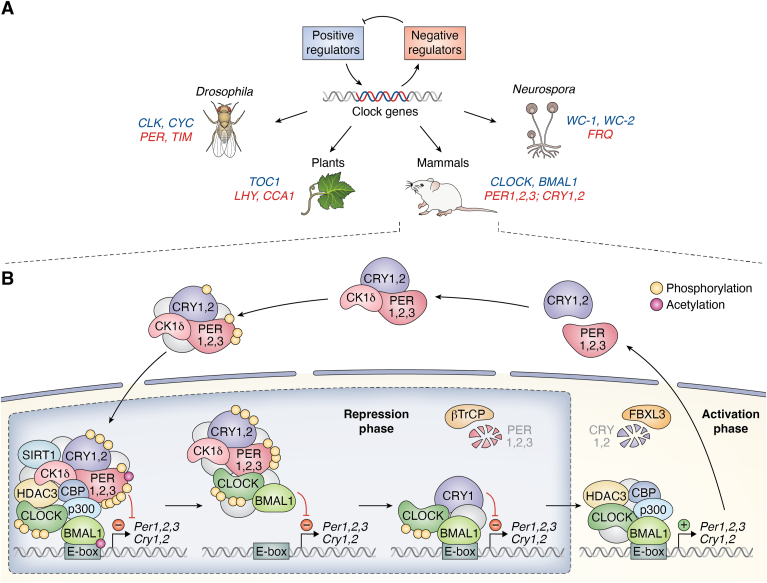
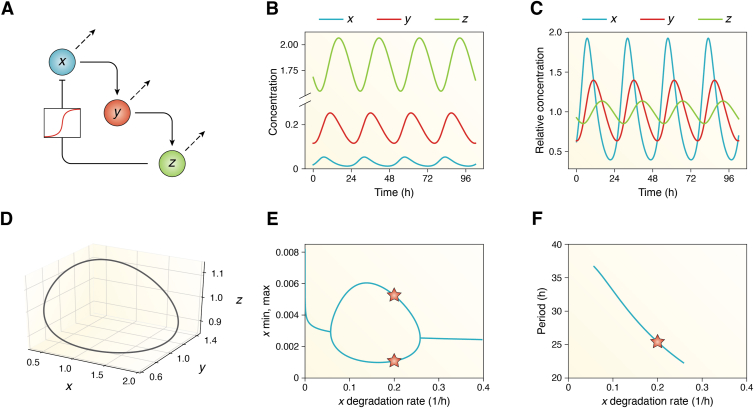
Circadian rhythms are generated by complex interactions among genes and proteins. Self-sustained ∼24 h oscillations require negative feedback loops and sufficiently strong nonlinearities that are the product of molecular and network switches. Here, we review common mechanisms to obtain switch-like behavior, including cooperativity, antagonistic enzymes, multisite phosphorylation, positive feedback, and sequestration. We discuss how network switches play a crucial role as essential components in cellular circadian clocks, serving as integral parts of transcription-translation feedback loops that form the basis of circadian rhythm generation. The design principles of network switches and circadian clocks are illustrated by representative mathematical models that include bistable systems and negative feedback loops combined with Hill functions. This work underscores the importance of negative feedback loops and network switches as essential design principles for biological oscillations, emphasizing how an understanding of theoretical concepts can provide insights into the mechanisms generating biological rhythms.

Keywords: bistability; circadian clock; feedback loops; mathematical models; network switches; ultrasensitivity.


Conflict of interest statement

Conflict of interest The authors declare that they have no conflicts of interest with the contents of this article.

Figures

Figure 1
Figure 1
Representative examples of different signal-response relationships and biochemical modules that generate network switches.A, linear signal-response curve, (B) hyperbolic Michaelis–Menten, (C) hill-type sigmoidal ultrasensitivity, (D) reversible bistable switch, and (E) irreversible bistable switch. Response curves represented by (CE) serve as examples of network switches. (D) and (E) serve as examples of bistable systems, where two stable steady states coexist for certain values of stimulus. Depending on whether the stimulus is increased or decreased, the system will follow the lower or upper curve, respectively. Such loop-like curves indicate the presence of hysteresis. The unstable steady state separating both stable branches is shown with a dashedblueline. Bifurcation points in which the steady states change stability are shown in red. In the bottom row, different biological motifs that can give rise to switch-like dose-response curves are shown: (F) bistability through positive feedback or mutual inhibition, (G) sequestration, (H) signal amplification along a cascade, and (I) cooperative processes. In all panels, x and x (or y and y; z and z) represent the inactive and active molecule counterparts, respectively, that are responsible for the output response.
Figure 2
Figure 2
Ultrasensitivity through cooperative multisite phosphorylation or cooperative binding of oxygen to hemoglobin. Cooperative multisite phosphorylation (A, top row) or cooperative binding of oxygen to hemoglobin (A, bottom row) can lead to strong network ultrasensitive switches. The steady state response of the last element of the chain (the fully phosphorylated protein or hemoglobin with the four oxygen molecules bound) is shown as a function of the kinase or the O2 concentration (B). The green curve shows the response if all phosphorylation/binding reactions occur at the same rate, but the ultrasensitivity becomes greater if cooperativity in the phosphorylation/binding is assumed (red curve: k4 = 10k1, blue curve: k4 = 100k1), as seen by the increasing Hill exponents of Hill functions fitted to all three curves: n = 2.3 (green), n = 2.9 (red), and n = 3.4 (blue). All parameters in Equation 2 are set to 1 for simplicity (i.e., phosphatase concentration, all reverse and forward reactions except k4, whose value changes depending on the degree of cooperativity assumed).
Figure 3
Figure 3
Bistability depends on an ultrasensitive positive feedback.Top row, (A), scheme of a system without positive feedback where A is reversibly activated to A by a stimulus. B, this system is monostable, and different starting initial conditions (shown in different colors) approach one steady state. C, the stable steady state of A can also be found graphically, at the points where the line representing the activation term of A as a function of A (purple) intersects with the inactivation term of A (gray). D, The stimulus-response curve is Michaelian. Bottom row, (E), same motif as in (A), now with a positive feedback where A stimulates its own production. F, this system is now bistable, and different initial conditions (shown in different colors) converge in one or the other stable fixed point over time. G, the two stable steady states of A (filled points) can be found graphically at the points where the activation term (purple) equals the inactivation term (gray) and are separated by an unstable steady state (unfilled point). H, the dose-response curve of this network becomes a reversible switch, represented by the hysteresis curve. Results are obtained for numerical integration of Equation 3 (top row) or Equation 4 (bottom row) for the following parameter values: Atot = 1, n = 5, d = 0.01, K = 1, f = 0.15, and stimulus = 0.0025 (or changing stimulus values for panels D and H).
Figure 4
Figure 4
Long delays of about a quarter of the oscillation period together with network switches are required to achieve self-sustained limit cycle oscillations.A, scheme of a simple delay-oscillator model, where a clock gene x represses its own transcription after a delay τ. The repression is modeled with a Hill-like term as described in Equation 5. B, relationship between the delay τ and the period of x. Delays of ∼1.6 h result in oscillations of 5 to 6 h period (the human segmentation clock could be an example of such oscillations), whereas circadian ∼24 h periods are obtained with longer delays of 6 to 7 h. Results are obtained through numerical integration of Equation 5 for β = 4, n = 5, d = 0.1, K = 1 and changing delays τ. C, scheme of the simple DDE model with τ = 6.45 h reproduces circadian oscillations. D, time series of the solution for τ = 6.45 h and (E) phase space, where x at the time t − τ is plotted versus x(t). F, Hopf bifurcation diagram for changing Hill exponent n: it is observed how a strong nonlinearity of n > 3 is needed to generate limit cycle oscillations. Otherwise, oscillations dampen out and converge to a stable steady state. Results are obtained through numerical integration of Equation 5 for β = 4, n = 6.5, d = 0.1, and K = 1. DDE, delay differential equation.
Figure 5
Figure 5
Circadian clocks in eukaryotic organisms are controlled through a common mechanism: a transcription-translation feedback loop.A, TTFL circuitries in different kingdoms of life: positive regulators (blue) induce the transcription of clock genes which, when translated, produce negative regulators (red) that inhibit the positive arm of the loop therefore creating a negative feedback loop. B, scheme of the transcription-translation feedback loop in the mammalian circadian clockwork network. Core clock proteins and epigenetic regulators that have been identified as part of the macromolecular complexes through high-resolution biochemical experiments are depicted. Possible sources of switching are shown (phosphorylation cascades, sequestration partners, epigenetic modifiers) and described in the text.
Figure 6
Figure 6
Goodwin model for circadian limit cycle oscillations.A, scheme of the 3-variable model; note the sigmoidal curve with which z is modeled to repress x. B and C, time series, in absolute concentration terms (B), or after normalizing each rhythmic variable to its mean (C). D, phase space of the normalized x, y, and z variables of the Goodwin model. E, Bifurcation diagram as a function of increasing the degradation rate of x. F, within the range of x degradation rate that generates self-sustained oscillations, the period decreases monotonically. In (E) and (F), stars indicate the default parameter values in Equation 6. Results are obtained for numerical integration of Equations 6 for the following parameter values: k1 = k3 = k5 = 1, K = 1, k2 = 0.2, k4 = 0.15, k6 = 0.1, and n = 9.5.

References

    1. Hall B.E., Bar-Sagi D., Nassar N. The structural basis for the transition from Ras-GTP to Ras-GDP. Proc. Natl. Acad. Sci. U. S. A. 2002;99:12138–12142. - PMC - PubMed
    1. Frontzek K., Bardelli M., Senatore A., Henzi A., Reimann R.R., Bedir S., et al. A conformational switch controlling the toxicity of the prion protein. Nat. Struct. Mol. Biol. 2022;29:831–840. - PMC - PubMed
    1. Okamura H., Aramburu J., Garcıa-Rodrıguez C., Viola J.P.B., Raghavan A., Tahiliani M., et al. Concerted dephosphorylation of the transcription factor NFAT1 induces a conformational switch that regulates transcriptional activity. Mol. Cell. 2000;6:539–550. - PubMed
    1. Salazar C., Höfer T. Allosteric regulation of the transcription factor NFAT1 by multiple phosphorylation sites: a mathematical analysis. J. Mol. Biol. 2003;327:31–45. - PubMed
    1. Leioatts N., Romo T.D., Azmy Danial S., Grossfield A. Retinal conformation changes rhodopsin’s dynamic ensemble. Biophys. J. 2015;109:608–617. - PMC - PubMed

Publication types

LinkOut - more resources