. 2024 May;300(5):107214.
doi: 10.1016/j.jbc.2024.107214. Epub 2024 Mar 22.

Disruption of polyunsaturated fatty acid biosynthesis drives STING-dependent acute myeloid leukemia cell maturation and death

Affiliations

Disruption of polyunsaturated fatty acid biosynthesis drives STING-dependent acute myeloid leukemia cell maturation and death

Joice Kanefsky et al. J Biol Chem. 2024 May.

Abstract

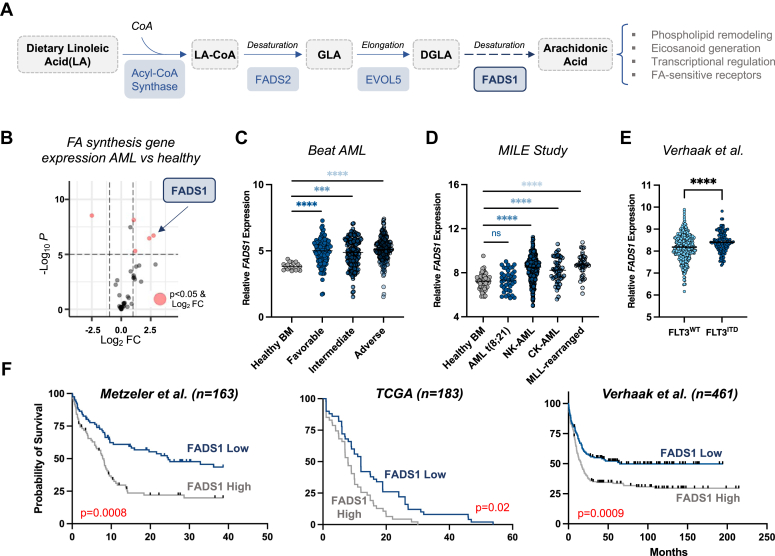
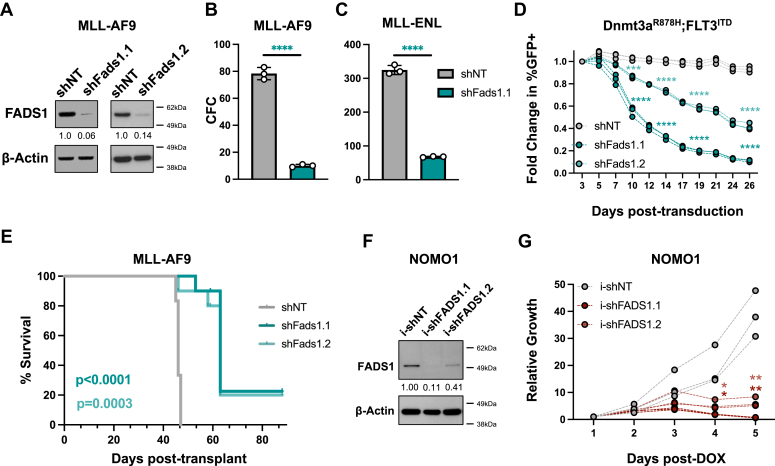
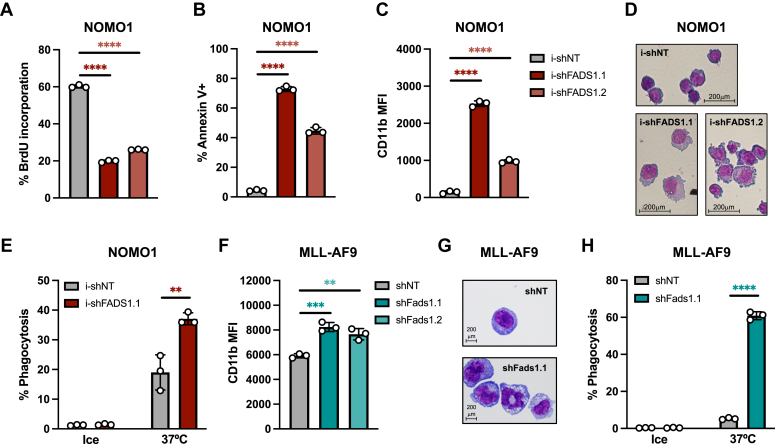
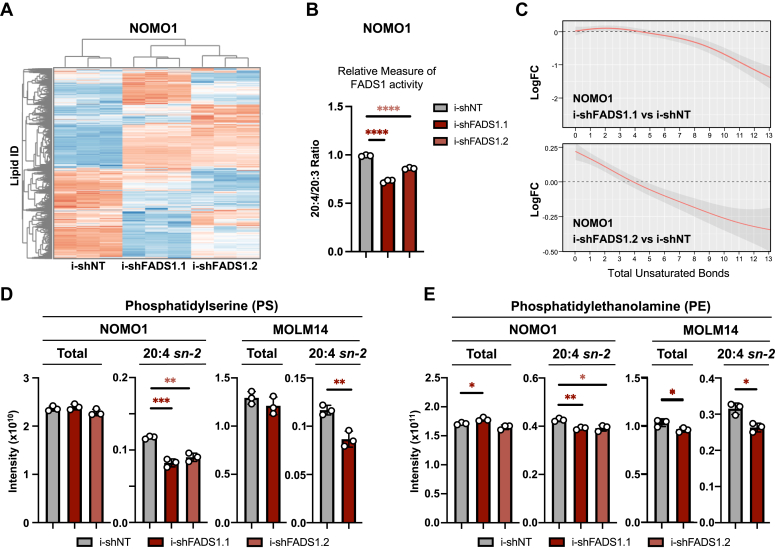
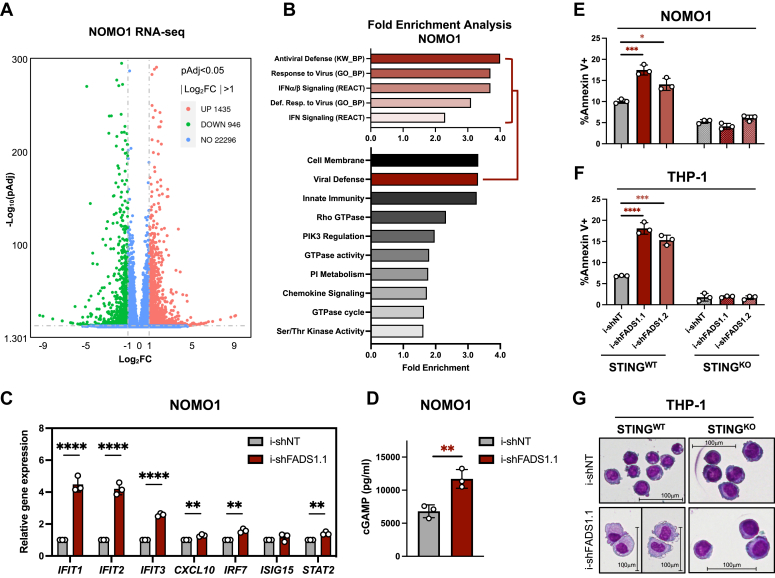
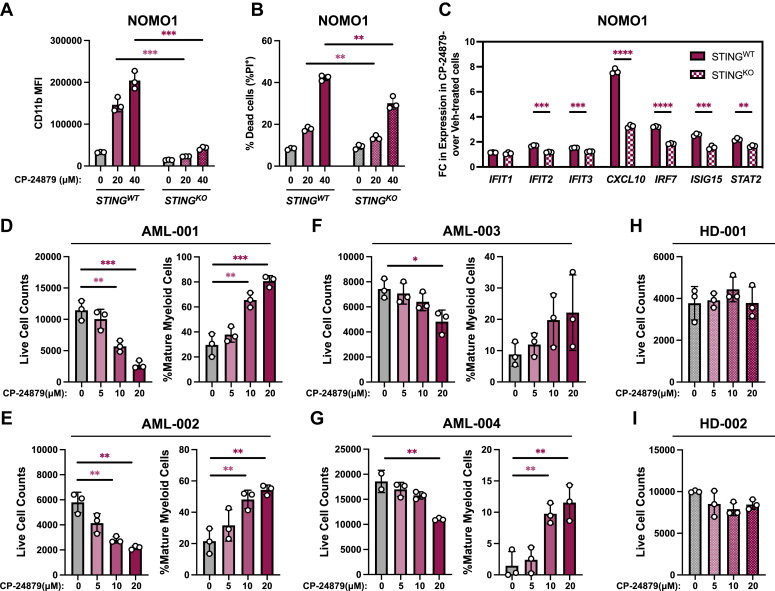
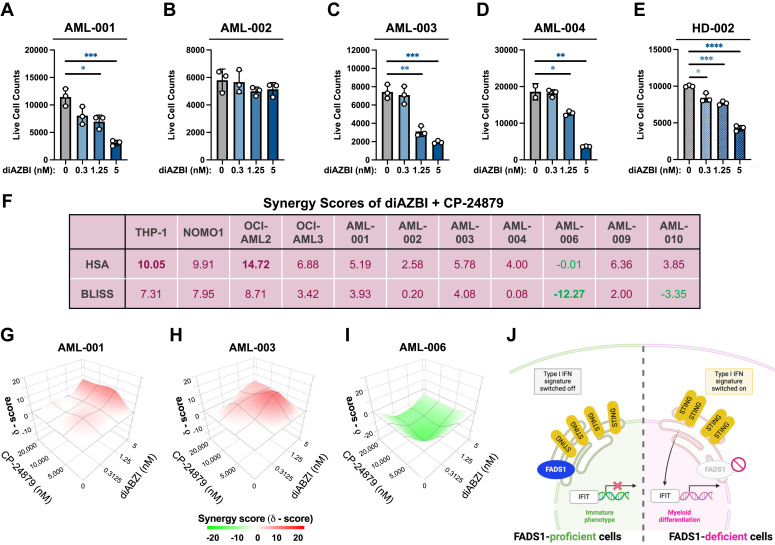
The role of polyunsaturated fatty acid (PUFA) biosynthesis in acute myeloid leukemia (AML) remains largely undefined. A comparative expression analysis of 35 genes encoding fatty acid biosynthesis enzymes showed that fatty acid desaturase 1 (FADS1) was highly expressed across multiple AML subtypes relative to healthy controls and that elevated FADS1 expression correlates with worse overall AML patient survival. Functionally, shRNA-mediated inhibition of FADS1 reduced AML cell growth in vitro and significantly delayed leukemia onset in an AML mouse model. AML cell lines depleted of FADS1 arrested in the G1/S-phase of the cell cycle, acquired characteristics of myeloid maturation and subsequently died. To understand the molecular consequences of FADS1 inhibition, a combination of mass spectrometry-based analysis of complex lipids and gene expression analysis (RNA-seq) was performed. FADS1 inhibition caused AML cells to exhibit significant lipidomic remodeling, including depletion of PUFAs from the phospholipids, phosphatidylserine, and phosphatidylethanolamine. These lipidomic alterations were accompanied by an increase induction of inflammatory and stimulator of interferon genes (STING)-mediated type-1 interferon signaling. Remarkably, genetic deletion of STING largely prevented the AML cell maturation and death phenotypes mediated by FADS1 inhibition. Highlighting the therapeutic implications of these findings, pharmacological blockade of PUFA biosynthesis reduced patient-derived AML cell numbers ex vivo but not that of healthy donor cells. Similarly, STING agonism attenuated patient-derived-AML survival; however, STING activation also reduced healthy granulocyte numbers. Collectively, these data unveil a previously unrecognized importance of PUFA biosynthesis in leukemogenesis and that imbalances in PUFA metabolism can drive STING-mediated AML maturation and death.

Keywords: AML; FADS1; PUFA; STING; phospholipid.


Figures

Figure 1
Figure 1
FADS1 expression is elevated across multiple AML subtypes and correlates with patient outcomes.A, schematic detailing the steps during endogenous synthesis of AA and its fatty acyl-CoA, AA-CoA. The key enzymes are highlighted in blue boxes. B, volcano plot comparing the fold change in the expression of various fatty acid synthetic genes between AML patients and healthy BM populations from GSE9476. C, dot plot (extracted from Vizome, BeatAML) comparing the levels of FADS1 mRNA between BM cells from healthy donors and AML patient samples with the indicated genetic subtypes [Healthy BM (n = 19) versus: favorable (n = 120), ∗∗∗∗p < 0.0001; intermediate (n = 151), ∗∗∗p = 0.0001; adverse (n = 162), ∗∗∗∗p < 0.0001]. D, dot plot (extracted from Bloodspot (50) comparing the levels of FADS1 mRNA between BM cells from healthy donors and AML patient samples with the indicated genetic subtypes [Healthy BM (n = 73) versus: AML t(8;21) (n = 40), p < 0.55; NK-AML (n = 351), ∗∗∗∗p < 0.0001; CK-AML (n = 48), ∗∗∗∗p < 0.0001; MLL-rearranged (n = 39), ∗∗∗∗p < 0.0001]. E, comparison of FADS1 mRNA levels in FLT3WT (n = 335) and FLT3ITD (n = 126), ∗∗∗∗p < 0.0001 from Verhaak et al. (24) (data extracted from the Leukemia Gene Atlas (51)). F, Kaplan–Meier curve depicting the probability of survival of AML patients expressing FADS1 mRNA levels above (gray line) or below the median (blue line). Data for each of the three indicated datasets was extracted from the Leukemia Gene Atlas. AA-CoA, arachidonoyl-CoA; AML, acute myeloid leukemia; BM, bone marrow; CK-AML, complex-karyotype AML; DGLA, dihomo-gamma-linolenic acid; FADS1, fatty acid desaturase 1; GLA, gamma-linolenic acid; LA-CoA, linoleoyl-Co-A; MLL, mixed lineage leuekmia; NK-AML, normal-karyotype AML.
Figure 2
Figure 2
FADS1 supports AML cell survival and disease propagation in vivo.A, Western blot analysis of FACS-purified GFP+ MLL-AF9 cells expressing shNT, shFads1.1, or shFads1.2 (B) FACS-purified GFP+ MLL-AF9 cells from each shRNA condition were cultured in cytokine-enriched methylcellulose for 7 days (∗∗∗∗p < 0.0001). C, FACS-purified MLL-ENL cells from each shRNA condition were cultured in cytokine-enriched methylcellulose for 7 days (∗∗∗∗p < 0.0001). D, growth curve of Dnmt3aR878H; FLT3ITD-expressing mouse AML cells depicting fold change in % GFP+ cells over time (∗∗∗∗p < 0.0001 for all time points except day 7, shNT versus shFads1.2, ∗∗∗p = 0.0003). E, overall survival of mice transplanted with shNT, shFads1.1, or shFads1.2-expressing MLL-AF9 cells. Log-rank (Mantel-cox) test (n = 6 per group). F, Western blot analysis of FACS-purified GFP+ NOMO1 cells expressing shNT, i-shFADS1.1, or i-shFADS1.2, 48 h post-2 μg/ml doxycycline (DOX) treatment. G, cells from each inducible shRNA condition were treated with 2 μg/ml DOX and then counted at the indicated time points using flow cytometry counting beads on a LSRII flow cytometer (i-shNT versus i-shFADS1.1: ∗p = 0.0153, day 4 and ∗∗p = 0.0015, day 5; i-shNT versus i-shFADS1.1: ∗p = 0.0351, day 4 and ∗∗p = 0.0029, day 5). Dots represent individual data points and error bars represent SD. AML, acute myeloid leukemia; ENL, eleven nineteen protein; FACS, fluorescence-activated cell sorting; FADS1, fatty acid desaturase 1; MLL, mixed lineage leuekmia; shFADS1, shRNAs that reduce Fads1 protein expression; shNT, nontargeting control shRNA.
Figure 3
Figure 3
FADS1 disruption promotes cell cycle arrest, maturation, and death.AD, NOMO1 cells expressing i-shNT, i-shFADS1.1, or i-shFADS1.2 were treated with 2 μg/ml DOX treatment and then assessed for the following: (A) BrdU-incorporation at 48 h post-DOX (bar plots represent % of cells in S phase); (B) % annexin-V+ by flow cytometry at 4 days post-DOX; (C) CD11b median fluorescence intensity (MFI) by flow cytometry at 4 days post-DOX; and (D) Wright-Giemsa staining at 5 days post doxycycline induction (40× magnification) (∗∗∗∗p < 0.0001). E, percent of internalized fluorescently labeled (PE) Escherichia coli peptides by NOMO1 cells expressing i-shNT, i-shFADS1.1 at 72 h post doxycycline induction. F, GFP+ MLL-AF9 cells expressing shNT, shFads1.1, or shFads1.2 were analyzed for CD11b MFI by flow cytometry on day 5 posttransduction (shNT versus shFads1.1, ∗∗∗p = 0.005 and shNT versus shFads1.2, ∗∗p = 0.0034). G, Wright-Giemsa staining of MLL-AF9 cells expressing the indicated shRNAs 8 days posttransduction. (100× magnification). H, percent of internalized fluorescently labeled E. coli peptides by MLL-AF9 cells expressing shNT or shFads1.1 as measured by flow cytometry at day 9 posttransduction. Data represent the mean ± SD of three replicates (∗∗∗∗p < 0.0001). Dots represent individual data points and error bars represent SD. BrdU, bromodeoxyuridine; DOX, doxycycline; FADS1, fatty acid desaturase 1; MLL, mixed lineage leuekmia; shNT, nontargeting control shRNA.
Figure 4
Figure 4
FADS1 inhibition selectively depletes 20:4 fatty acid in phospholipids.A, hierarchical clustering heatmap of MS-based untargeted lipidomics analysis of NOMO1 cells expressing i-shNT, i-shFADS1.1, or i-shFADS1.2 at 40 h post doxycycline induction (n = 3 replicates per group). B, ratios of total signals from phospholipids containing 20:4 or 20:3 FA in the sn-2 position (∗∗∗∗p < 0.0001). C, analysis of fatty acid composition for i-shFADS1 versus control i-shNT cells based on the total MS signal (lipid abundance) with the specified total degree of unsaturation. Top panel, represents the comparison between i-shFADS1.1 versus control i-shNT and the bottom panel represents the comparison between i-shFADS1.2 versus control i-shNT. D and E, both total and 20:4, sn-2 levels of (D) phosphatidylserine (PS) (NOMO1 –i-shNT versus i-shFADS1.1: 20:4 sn-2 PS, ∗∗∗p = 0.0005; i-shNT versus i-shFADS1.2: 20:4 sn-2 PS, ∗∗p = 0.0015; and MOLM14 – i-shNT versus i-shFADS1.1: 20:4 sn-2 PS, ∗∗p = 0.0059) and (E) phosphatidylethanolamine (PE) were determined by MS-based untargeted NOMO1 cells expressing i-shNT, i-shFADS1.1, or i-shFADS1.2 and MOLM14 cells expressing i-shNT or i-shFADS1.1 at 40 h, post-DOX treatment (NOMO1 – i-shNT versus i-shFADS1.1: total PE, ∗p = 0.0284; and 20:4 sn-2 PE, ∗∗p = 0.0023; and i-shNT versus i-shFADS1.2: 20:4 sn-2 PE, ∗p = 0.015; MOLM14 – i-shNT versus i-shFADS1.1, 20:4 total PE, ∗p = 0.045; i-shNT versus i-shFADS1.1, 20:4 sn-2 PE, ∗p = 0.0107). Dots represent individual data points and error bars represent SD. FADS1, fatty acid desaturase 1; shFADS1, shRNAs that reduce Fads1 protein expression; shNT, nontargeting control shRNA.
Figure 5
Figure 5
FADS1 inhibition drives STING-mediated AML cell maturation and death.A, volcano plot of differentially expressed genes from a RNA-seq analysis of NOMO1 cells expressing i-shNT or i-shFADS1.1 and treated with DOX for 40 h. B, bottom panel, pathway enrichment analysis using the DAVID functional annotation tool and included GO_CC, GO_BP, GO_MF, UP_KW biological processes, KEGG, and reactome pathways. Top panel, pathway enrichment breakdown of “Viral Defense” cluster as depicted in the bottom panel. C, quantitative polymerase chain reaction analysis of the specified genes in i-shNT-, i-shFADS1.1-expressing NOMO1 cells at 40 h post doxycycline induction (i-shNT versus i-shFADS1.1: IFIT1, ∗∗∗p = 0.0002; IFIT2, ∗∗∗p = 0.0001; IFIT3, ∗∗∗∗p < 0.0001; CXCL10, ∗∗0.0024; IRF7, ∗∗p = 0.0012; STAT2, ∗∗p = 0.0025). D, cytoplasmic extracts from NOMO1-expressing i-shNT or i-shFADS1.1 and treated with DOX 40 h earlier were subjected to ELISA to detect cGAMP levels (p = 0.0078). E, NOMO1-STINGWT (i.e., WT). and NOMO1-STINGKO cells expressing i-shNT, i-shFADS1.1, or i-shFADS1.2 were analyzed for % annexin V+ (i-shNT versus i-shFADS1.1, ∗∗∗p = 0.006; i-shNT versus i-shFADS1.2, ∗p = 0.0104) using flow cytometry 4 days post-DOX induction. F, THP-1-STINGWT (i.e., WT). and THP-1-STINGKO cells expressing i-shNT, i-shFADS1.1, or i-shFADS1.2 were analyzed for % annexin V+ (i-shNT versus i-shFADS1.1, ∗∗∗p = 0.0001; i-shNT versus i-shFADS1.2, ∗∗∗p = 0.0002) using flow cytometry 5 days post-DOX induction. G, Wright-Giemsa staining of THP-1-STINGWT and THP-1-STINGKO cells expressing i-shNT or i-shFADS1.1, or i-shFADS1.2 shRNA at 5 days post doxycycline induction (20× magnification). Dots represent individual data points and error bars represent SD. AML, acute myeloid leukemia; BM, bone marrow; cGAMP, 2′3′-cGMP-AMP; FADS1, fatty acid desaturase 1; shNT, nontargeting control shRNA; STING, stimulator of interferon genes.
Figure 6
Figure 6
Pharmacological inhibition of FADS enzymes imparts anti-AML activity.A and B, NOMO1 STINGWT and STINGKO were treated with the indicated concentrations of CP-24879 for 48 h and then assessed by flow cytometry for the following: A, CD11b MFI (∗∗∗p = 0.0002 for both of the indicated comparisons) and (B) % annexin V+ (20 μM STINGWTversus 20 μM STINGKO, p = 0.0074, and 40 μM STINGWTversus 40 μM STINGKO, p = 0.0029). C, complimentary DNA recovered from NOMO1-STINGWT and NOMO1-STINGKO cells treated with vehicle or 40 μM CP-24879 were analyzed by quantitative polymerase chain reaction for the expression of the indicated genes. The data is presented as the fold change (FC) in gene expression of CP-24879–treated cells over vehicle-treated cells in each cellular genotype (STINGWTversus STINGKO: IFIT2, ∗∗∗p = 0.0002; IFIT3, ∗∗∗p = 0.0001; CXCL10, ∗∗∗∗p < 0.0001; IRF7, ∗∗∗∗p < 0.0001; ISIG15, ∗∗∗p = 0.0005; STAT2, ∗∗p = 0.0023). DG, BM or peripheral blood (PB) samples recovered from patients diagnosed with AML were treated with the indicated concentrations of CP-24879 for 4 days and then analyzed by flow cytometry to count live AML cells (left panels, hCD45Low, hCD14Low, hCD16Low, P.I.) and the percent of mature myeloid cells (right panels, hCD45+, hCD14High, hCD16High, P.I.). D, AML patient #1: live cell counts, 0 versus 10 μM, ∗∗p = 0.0053 and 0 versus THP-1- 20 μM, ∗∗∗p = 0.0009; and mature myeloid cells, 0 versus 10 μM, ∗∗p = 0.0047 and 0 versus 20 μM, ∗∗∗p = 0.001. E, AML patient #2: live cell counts, 0 versus 10 μM, ∗∗p = 0.0037 and 0 versus 20 μM, ∗∗p = 0.0016; and mature myeloid cells, 0 versus 10 μM, ∗∗p = 0.0099 and 0 versus 20 μM, ∗∗p = 0.0028. F, AML patient #3: live cell counts, 0 versus 20 μM, ∗p = 0.0199. G, AML patient #4: live cell counts, 0 versus 20 μM, ∗∗p = 0.0079; and mature myeloid cells, 0 versus 10 μM, ∗∗p = 0.0067 and 0 versus 20 μM, ∗∗p = 0.0086. H and I, BM samples recovered from healthy donors (H) #1 and (I) #2 were treated with the indicated concentrations of CP-24879 for 4 days and then analyzed by flow cytometry to count live cells (hCD45+, P.I.). Dots represent individual data points and error bars represent SD. AML, acute myeloid leukemia; BM, bone marrow; FADS1, fatty acid desaturase 1; P.I., propidium iodide; STING, stimulator of interferon genes.
Figure 7
Figure 7
STING agonism effectively eliminates patient-derived AML cells and variably cooperates with FADS1 inhibition.AD, BM or PB samples recovered from patients diagnosed with AML were treated with the indicated concentrations of diAZBI for 4 days and then analyzed by flow cytometry to count live AML cells. A, AML-001: live cell counts, 0 versus 10 μM, ∗p = 0.0171 and 0 versus 20 μM, ∗∗∗p = 0.0009. B, AML-002: no significant differences. C, AML-003: live cell counts, 0 versus 10 μM, ∗∗p = 0.0014 and 0 versus 20 μM, ∗∗∗p = 0.0003. D, AML-004: live cell counts, 0 versus 10 μM, ∗p = 0.0189 and 0 versus 20 μM, ∗∗p = 0.0011. E, BM samples recovered from HD-002 were treated with the indicated concentrations of diAZBI for 4 days and then analyzed by flow cytometry to count live CD45+ cells. 0 nM versus 0.312 nM, ∗p = 0.0101; 0 nM versus 1.25 nM, ∗∗∗p = 0.0001; 0 nM versus 5 nM, ∗∗∗∗p < 0.0001). Dots represent individual data points and error bars represent SD. F, tabulation of the HSA (middle row) or BLISS (bottom row) synergy scores for the combination of diAZBI and CP-24879 assessed in the indicated cell lines or patient-derived AML samples. GI, three dimensional plots of the synergy/cooperation scores (y-coordinate) for the indicated patient-derived AML samples treated with varying combinations of the STING agonist, diAZBI (z-coordinate), and CP-24879 (x-coordinate). J, a graphical summary of the molecular consequences of disrupting PUFA biosynthesis in AML. AML, acute myeloid leukemia; BM, bone marrow; FADS1, fatty acid desaturase 1; PB, peripheral blood; PUFA, polyunsaturated fatty acid; STING, stimulator of interferon genes.

References

    1. Koundouros N., Poulogiannis G. Reprogramming of fatty acid metabolism in cancer. Br. J. Cancer. 2020;122:4–22. - PMC - PubMed
    1. Bian X., Liu R., Meng Y., Xing D., Xu D., Lu Z. Lipid metabolism and cancer. J. Exp. Med. 2021;218 - PMC - PubMed
    1. Snaebjornsson M.T., Janaki-Raman S., Schulze A. Greasing the wheels of the cancer machine: the role of lipid metabolism in cancer. Cell Metab. 2020;31:62–76. - PubMed
    1. Samudio I., Harmancey R., Fiegl M., Kantarjian H., Konopleva M., Korchin B., et al. Pharmacologic inhibition of fatty acid oxidation sensitizes human leukemia cells to apoptosis induction. J. Clin. Invest. 2010;120:142–156. - PMC - PubMed
    1. Woolthuis C.M., Adane B., Khan N., Sullivan T., Minhajuddin M., Gasparetto M., et al. Leukemic stem cells evade chemotherapy by metabolic adaptation to an adipose tissue niche. Cell Stem Cell. 2016;19:23–37. - PMC - PubMed

Publication types