. 2024 Jul;65(7):100533.
doi: 10.1016/j.jlr.2024.100533. Epub 2024 Mar 24.

Detergent-induced quantitatively limited formation of diacyl phosphatidylinositol dimannoside in Mycobacterium smegmatis

Affiliations

Detergent-induced quantitatively limited formation of diacyl phosphatidylinositol dimannoside in Mycobacterium smegmatis

Claire E Kitzmiller et al. J Lipid Res. 2024 Jul.

Abstract

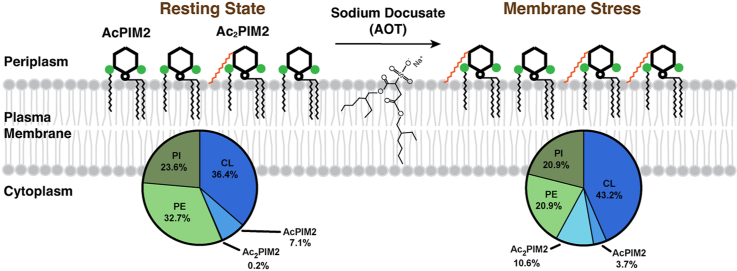
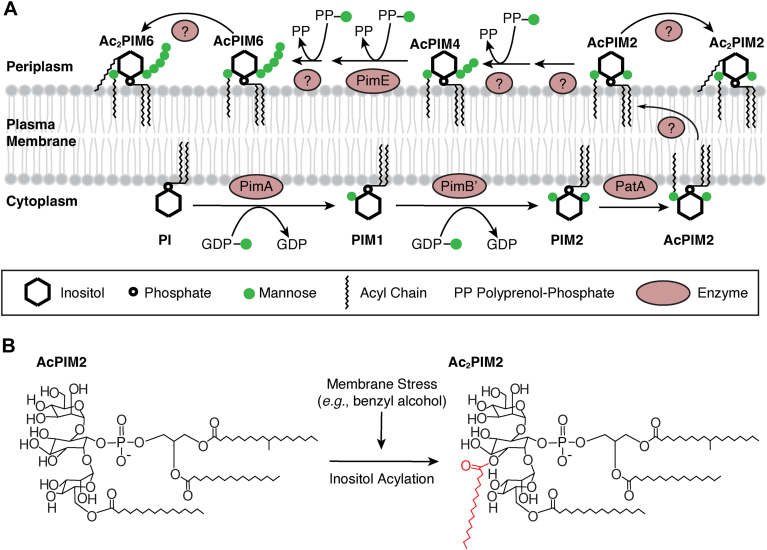
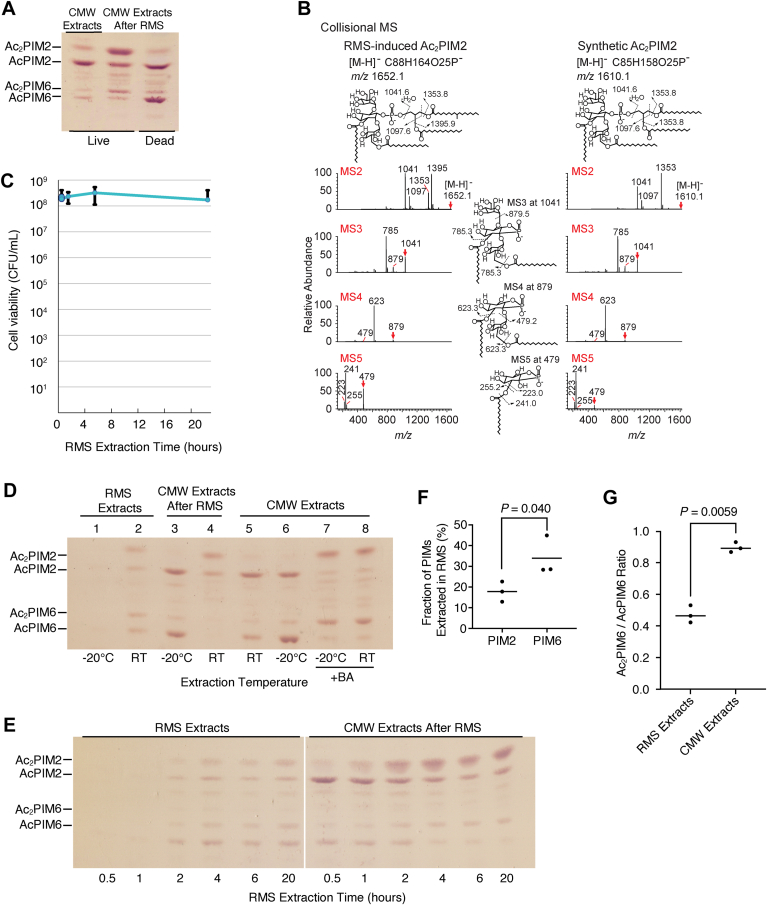
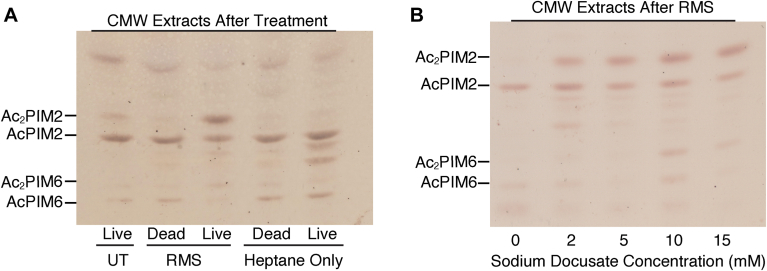
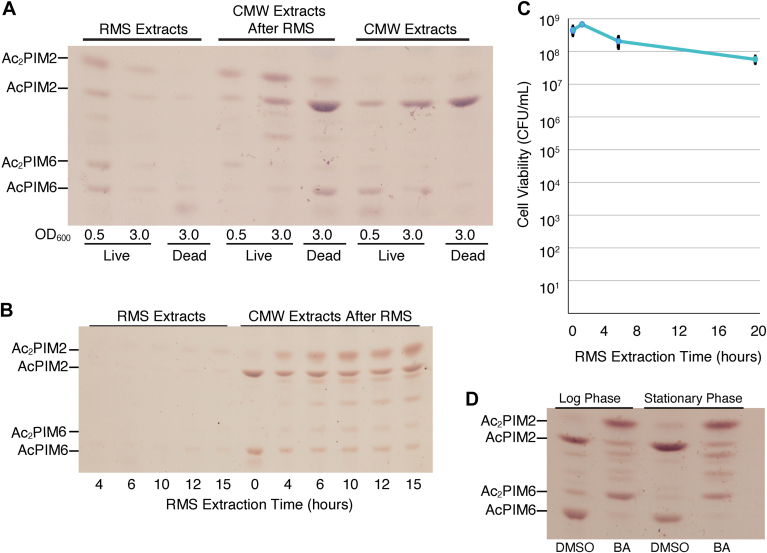
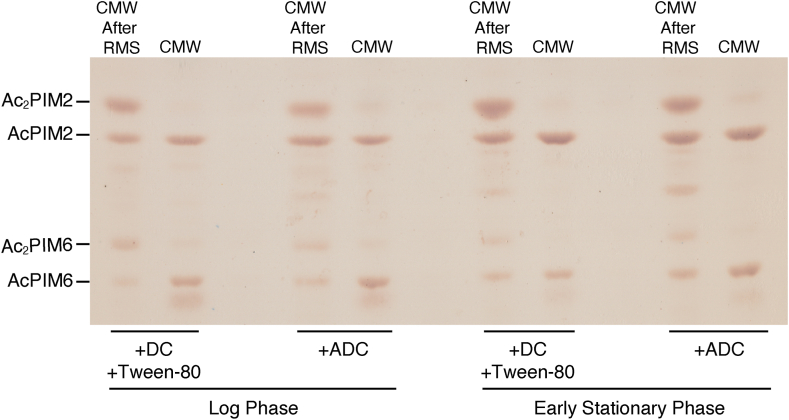
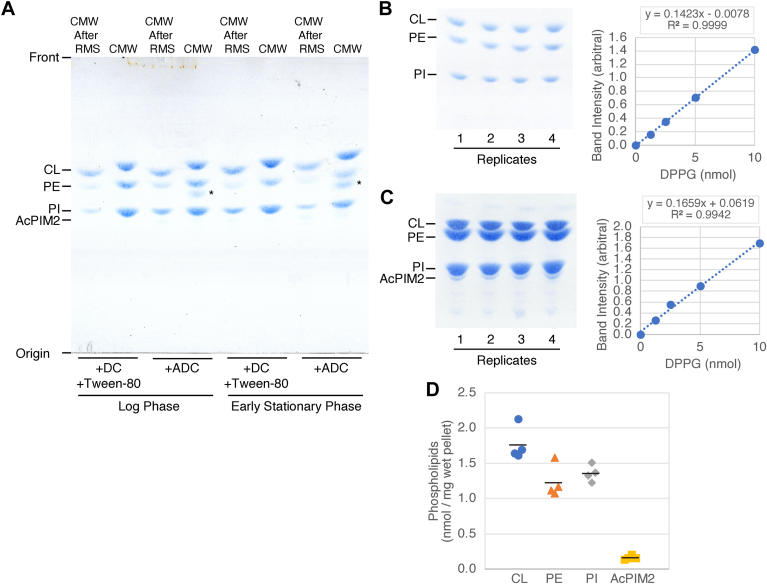
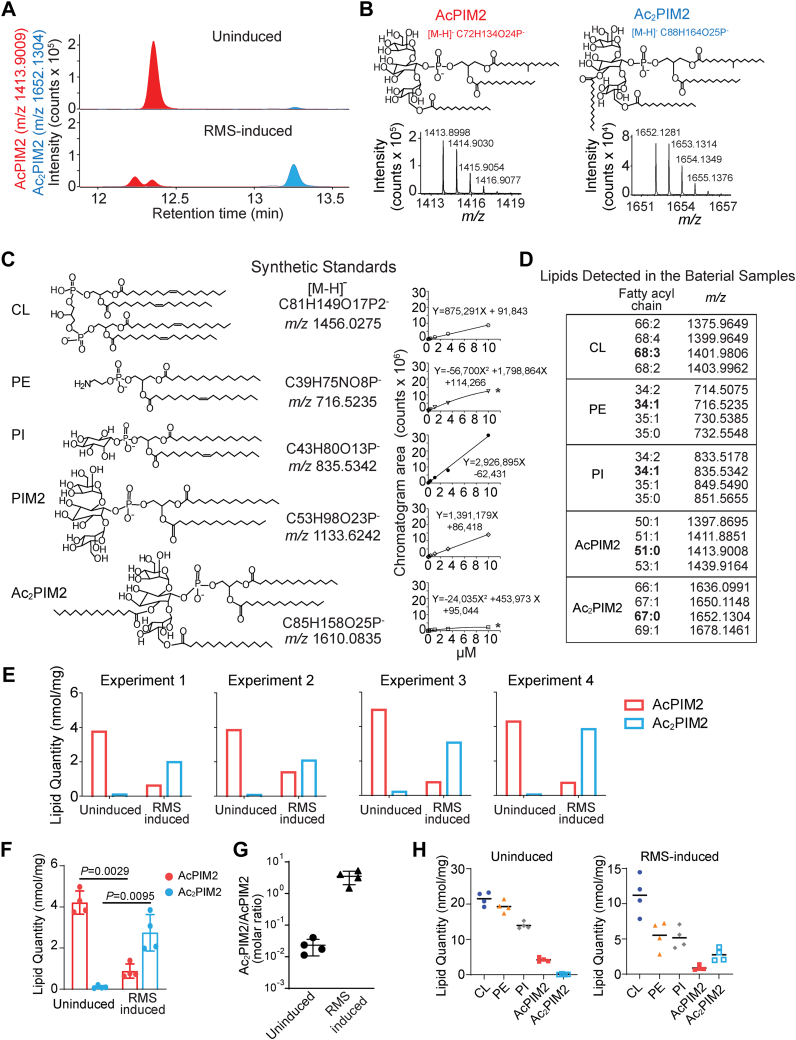
Mycobacterial plasma membrane, together with the peptidoglycan-arabinogalactan cell wall and waxy outer membrane, creates a robust permeability barrier against xenobiotics. The fact that several antituberculosis drugs target plasma membrane-embedded enzymes underscores the importance of the plasma membrane in bacterial physiology and pathogenesis. Nevertheless, its accurate phospholipid composition remains undefined, with conflicting reports on the abundance of phosphatidylinositol mannosides (PIMs), physiologically important glycolipids evolutionarily conserved among mycobacteria and related bacteria. Some studies indicate cardiolipin, phosphatidylethanolamine, and phosphatidylinositol as dominant structural phospholipids. Conversely, some suggest PIMs dominate the plasma membrane. A striking example of the latter is the use of reverse micelle extraction, showing diacyl phosphatidylinositol dimannoside (Ac2PIM2) as the most abundant phospholipid in a model organism, Mycobacterium smegmatis. Our recent work reveals a rapid response mechanism to membrane-fluidizing stress in mycobacterial plasma membrane: monoacyl phosphatidylinositol dimannoside and hexamannoside (AcPIM2 and AcPIM6) are converted to diacyl forms (Ac2PIM2 and Ac2PIM6). Given the dynamic nature of PIMs, we aimed to resolve the conflicting data in the literature. We show that unstressed M. smegmatis lacks an Ac2PIM2-dominated plasma membrane. Ac2PIM2 accumulation is induced by experimental conditions involving sodium docusate, a component of the reverse micellar solution. Using chemically synthesized PIMs as standards, we accurately quantified phospholipid ratio in M. smegmatis through liquid chromatography-mass spectrometry, revealing that mycobacterial plasma membrane is dominated by cardiolipin, phosphatidylethanolamine, and phosphatidylinositol. PIMs are quantitatively minor but responsive to environmental stresses in M. smegmatis. Our study paves the way for accurate modeling of mycobacterial plasma membrane.

Keywords: biosynthesis; chemical synthesis; glycolipids; membrane fluidity; metabolism; phospholipids; reverse micelle extraction; stress response.


Conflict of interest statement

Conflict of interest The authors declare that they have no conflicts of interest with the contents of this article.

Figures

None
Graphical abstract
Fig. 1
Fig. 1
PIM biosynthesis and inositol acylation. A: Biosynthesis of AcPIM4, AcPIM5, and AcPIM6 are dependent on polyprenol-phosphate-mannose (PPM) as a mannose donor (17), suggesting that these steps take place in the periplasmic leaflet. For the biosynthetic steps between AcPIM2 and AcPIM6, PimE is the only known mannosyltransferase (16). Both AcPIM2 and AcPIM6 are readily available for inositol acylation reaction (19), implying that they are on the same leaflet. Based on these observations, we speculate that AcPIM2 flops from the cytoplasmic leaflet to the periplasmic leaflet (see main text for detailed discussion). B: Inositol acylation induced by membrane fluidization stress (19). The fatty acid (shown in red) is esterified at the 3-OH of the myo-inositol ring (23).
Fig. 2
Fig. 2
Diacyl PIMs accumulate in live M. smegmatis in response to RMS treatment. A: HPTLC analysis of PIMs extracted into RMS and CMW from live and heat-killed cells, following the published extraction protocol (4). PIMs were chromatographed using a solvent containing chloroform, methanol, 13 M ammonia, 1 M ammonium acetate, and water (180:140:9:9:23, v/v/v/v/v) and visualized by orcinol staining. A region of the HPTLC plate corresponding to Rf of 0.30–0.56 is shown. B: HPTLC-purified Ac2PIM2 induced by RMS treatment was analyzed by linear ion trap multistage collisional MS compared to the synthetic molecule Ac2PIM2. The location of the fatty acyl chain on the inositol was inferred from the literature (23) but cannot be determined in the current experiment. C: M. smegmatis cells remain viable during RMS treatment. Log phase cells were treated with RMS, resuspended in Middlebrook 7H9 media at indicated time points, serially diluted, and plated onto Middlebrook 7H10 agar. D: PIM inositol acylation depends on the temperature during RMS treatment. PIMs were extracted by RMS then CMW or directly by CMW without RMS at the indicated temperature and analyzed by HPTLC as in panel A (Rf = 0.29–0.58). Cells for lanes 7 & 8 were first treated with 100 mM benzyl alcohol (BA) for 1 h at room temperature before CMW extraction at the indicated temperature. E: Time course of PIM inositol acylation during the RMS treatment. Lipids were extracted from log phase cells into RMS for the indicated amounts of time and remaining lipids were extracted into CMW. PIMs were analyzed by HPTLC as in panel A (Rf = 0.27–0.61). Two parts separated by a white line are cropped from the same HPTLC plate. F: PIM6 species are more prone to RMS extraction than PIM2 species. Log phase cells were treated with RMS for 4 h, followed by CMW extraction of remaining lipids. Combined band intensities of PIM2 species (AcPIM2 and Ac2PIM2) were measured by densitometry and compared with those of PIM6 species (AcPIM6 and Ac2PIM6). P value of biological triplicates was determined by the Student’s t test. G: Ac2PIM6 is more enriched in the CMW extract. From the same experiment described in panel F, the ratio of Ac2PIM6 to AcPIM6 was calculated from the densitometric measurements. P value was determined by the Student’s t test. RT, room temperature.
Fig. 3
Fig. 3
Heptane alone does not induce inositol acylation. A: HPTLC analysis of PIMs extracted into CMW from live and heat-killed cells. Cells were either untreated (UT, lane 1), treated with RMS (lanes 2&3), or treated with heptane (lanes 4&5) before CMW extraction. PIMs were analyzed as in Fig. 2A (Rf = 0.28–0.65). B: Lipids were extracted into RMS with varying concentrations of sodium docusate, and the remaining lipids were extracted into CMW. The HPTLC analysis (as in Fig. 2A) of the CMW extracts is shown (Rf = 0.24–0.63).
Fig. 4
Fig. 4
PIM inositol acylation in different growth stages. A: HPTLC analysis of PIMs extracted into RMS, CMW after RMS treatment, and CMW without RMS treatment from live and heat-killed cells at an A600 of 0.5 or 3.0. PIMs were analyzed as in Fig. 2A (Rf = 0.25–0.64). B: Lipids were extracted from early stationary phase cells into RMS for the indicated amounts of time, and remaining lipids were extracted into CMW. PIMs were analyzed as in Fig. 2A (Rf = 0.19–0.62). C: Early stationary phase cells were treated with RMS for indicated time points, resuspended into Middlebrook 7H9 media, serially diluted and plated onto Middlebrook 7H10 agar for CFU counting. D: Log phase and early stationary phase cells were treated with DMSO (vehicle control) or 100 mM benzyl alcohol (BA) for 1 h before CMW lipid extraction. PIMs were analyzed as in Fig. 2A (Rf = 0.19–0.50).
Fig. 5
Fig. 5
Effect of medium components on PIM inositol acylation. Cells were grown to log or early stationary phase in Middlebrook 7H9 supplemented with ADC or DC and Tween-80. PIMs were extracted into CMW after the RMS treatment or directly into CMW. PIMs were analyzed as in Fig. 2A (Rf = 0.26–0.66). DC, dextrose-sodium chloride.
Fig. 6
Fig. 6
PIMs are not as abundant as other phospholipids. A: Lipid extracts from the same experiment shown in Fig. 5 were analyzed by HPTLC as in Fig. 2A and stained for phospholipids by Molybdenum Blue. ∗, unknown phospholipid. B: CMW extracts from 1.5 mg wet pellet of log phase cells grown in the standard growth medium were analyzed in biological quadruplicate alongside with DPPG standards. Lipid analysis was as described in panel A. Band intensities of CL, PE, and PI, measured by FIJI as previously described (21), were in the ranges of 0.336–0.445, 0.222–0.329, and 0.254–0.315 (arbitral density unit), which were all within the linear range of the DPPG standard curve. C: Lipids from 12 mg wet cell pellet were analyzed to visualize AcPIM2. Band intensities of AcPIM2 were 0.328–0.477. D: Phospholipid abundance in log-phage M. smegmatis cells shown in nmol per milligram wet cell pellet.
Fig. 7
Fig. 7
Quantification of AcPIM2 and Ac2PIM2 by HPLC-MS. A: Lipid extracts from wet pellets of log phase cells grown in the standard growth medium were analyzed by negative-mode, reversed phase HPLC-Q-TOF-MS in biological quadruplicates. The ion chromatograms of the most abundant species in AcPIM2 (m/z 1413.8998) and Ac2PIM2 (m/z 1652.1281) lipid classes were detected in uninduced and RMS-induced conditions, respectively. A representative chromatogram from one replicate is shown. B: The mass spectrum of the most abundant AcPIM2 and Ac2PIM2 shown in panel A with structures based on the literature. C: A series of known concentrations of synthetic compounds, CL, PE, PI, PIM2, and Ac2PIM2 were analyzed by HPLC-MS to generate standard curves using linear or nonlinear equations for curve fitting as indicated. ∗the nonlinear fitting results were verified by the linear fitting results with logarithmic scale conversion of both x- and y-axis shown in Supplemental Fig. S1. D: Four major lipid species in each phospholipid class were listed, and the most abundant species was indicated in bold. E: The concentration of AcPIM2 or Ac2PIM2 in each condition was converted from the chromatogram area shown in (A) to nmol/mg lipid based on the external standard curve fitting. The quantities of AcPIM2 were estimated by averaging the amounts calculated using both PIM2 and Ac2PIM2 standard curve fitting. F: Four experiments in panel E were combined for the statistical analysis using the paired two-tailed Student's t test. G: The comparison of Ac2PIM2 to AcPIM2 molar ratio in two cellular conditions calculated from panel E. H: The phospholipid abundance was estimated in nmol per mg lipid using all lipid species listed in panel D, based on external standard curve fitting.

References

    1. LaBelle Y.S., Walker R.W. The phospholipids of Mycobacterium smegmatis. Am. Rev. Respir. Dis. 1972;105:625–628. - PubMed
    1. Jackson M., Crick D.C., Brennan P.J. Phosphatidylinositol is an essential phospholipid of mycobacteria. J. Biol. Chem. 2000;275:30092–30099. - PubMed
    1. Angala S.K., Carreras-Gonzalez A., Huc-Claustre E., Anso I., Kaur D., Jones V., et al. Acylation of glycerolipids in mycobacteria. Nat. Commun. 2023;14:6694. - PMC - PubMed
    1. Bansal-Mutalik R., Nikaido H. Mycobacterial outer membrane is a lipid bilayer and the inner membrane is unusually rich in diacyl phosphatidylinositol dimannosides. Proc. Natl. Acad. Sci. U. S. A. 2014;111:4958–4963. - PMC - PubMed
    1. Akamatsu Y., Ono Y., Nojima S. Phospholipid patterns in subcellular fractions of Mycobacterium phlei. J. Biochem. 1966;59:176–182. - PubMed

Publication types

MeSH terms

LinkOut - more resources