. 2024 May;204(5):1844-1855.
doi: 10.1111/bjh.19423. Epub 2024 Mar 24.

Natural history of clonal haematopoiesis seen in real-world haematology settings

Affiliations

Natural history of clonal haematopoiesis seen in real-world haematology settings

Shyam A Patel et al. Br J Haematol. 2024 May.

Abstract

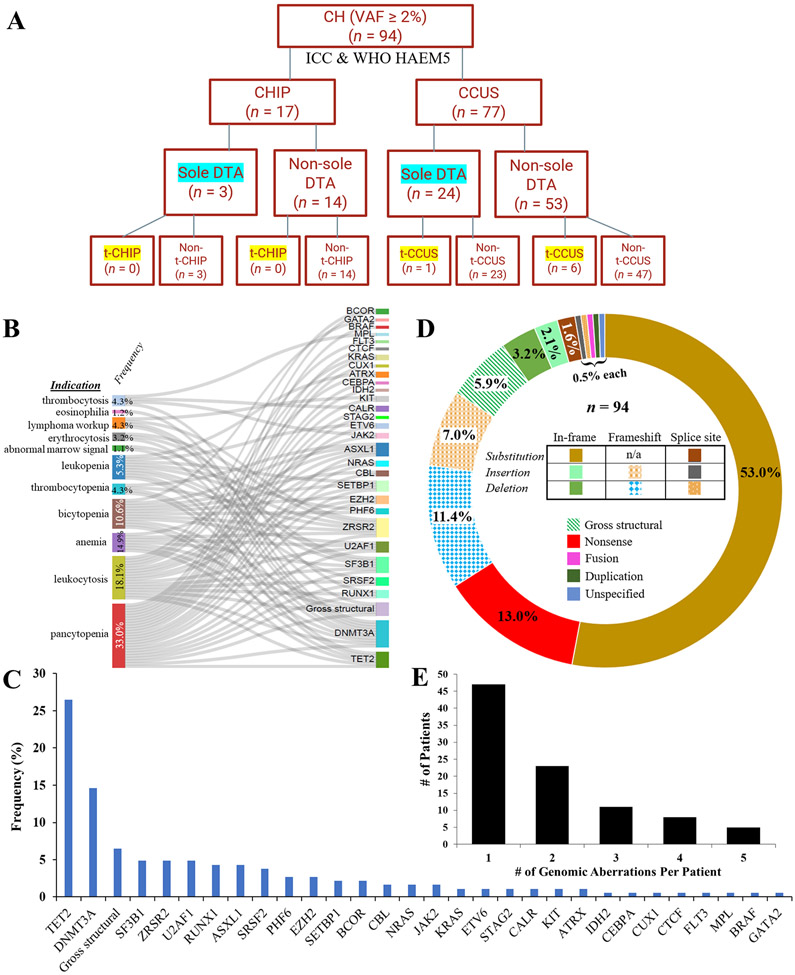
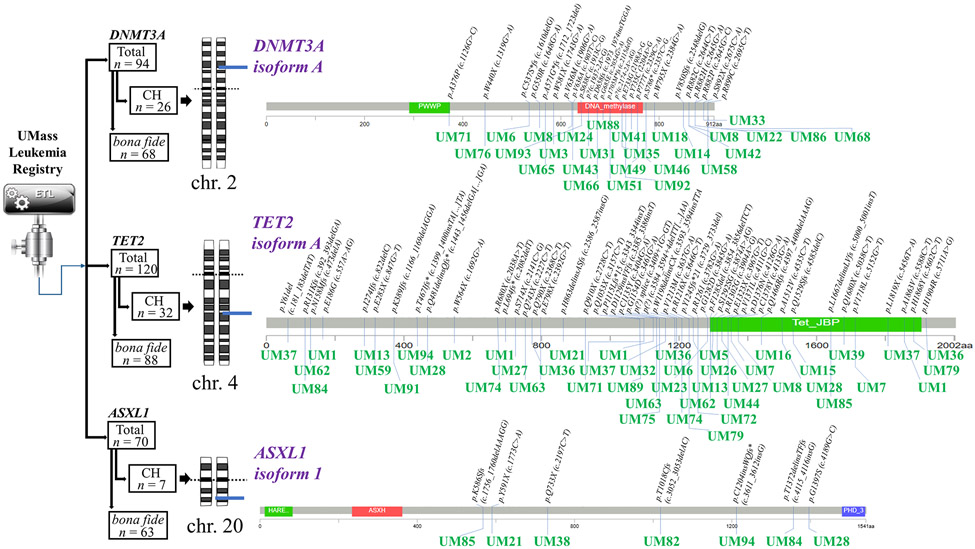
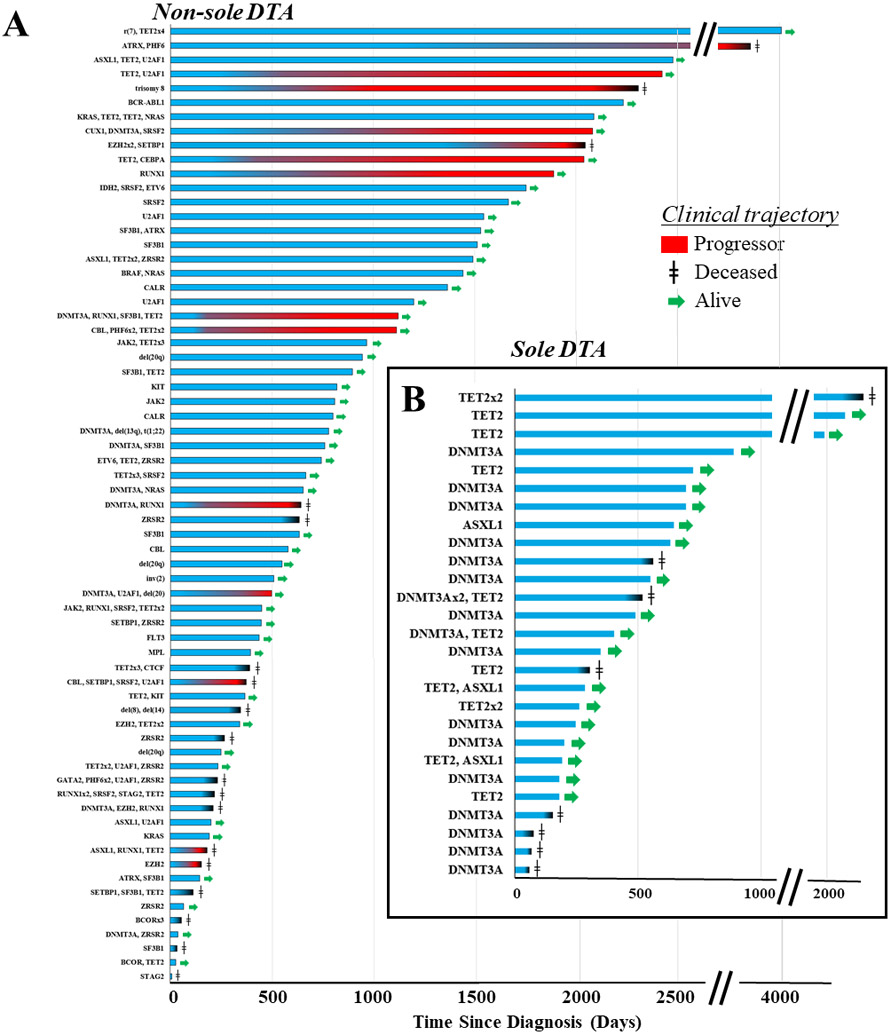
Recursive partitioning of healthy consortia led to the development of the Clonal Hematopoiesis Risk Score (CHRS) for clonal haematopoiesis (CH); however, in the practical setting, most cases of CH are diagnosed after patients present with cytopenias or related symptoms. To address this real-world population, we characterize the clinical trajectories of 94 patients with CH and distinguish CH harbouring canonical DNMT3A/TET2/ASXL1 mutations alone ('sole DTA') versus all other groups ('non-sole DTA'). TET2, rather than DNMT3A, was the most prevalent mutation in the real-world setting. Sole DTA patients did not progress to myeloid neoplasm (MN) in the absence of acquisition of other mutations. Contrastingly, 14 (20.1%) of 67 non-sole DTA patients progressed to MN. CHRS assessment showed a higher frequency of high-risk CH in non-sole DTA (vs. sole DTA) patients and in progressors (vs. non-progressors). RUNX1 mutation conferred the strongest risk for progression to MN (odds ratio [OR] 10.27, 95% CI 2.00-52.69, p = 0.0053). The mean variant allele frequency across all genes was higher in progressors than in non-progressors (36.9% ± 4.62% vs. 24.1% ± 1.67%, p = 0.0064). This analysis in the post-CHRS era underscores the natural history of CH, providing insight into patterns of progression to MN.

Keywords: CHIP; acute myeloid leukaemia; clonal haematopoiesis; epigenetics; myelodysplastic syndrome; myeloid genomics.


Figures

FIGURE 1.
FIGURE 1.
(A) Distribution of CHIP and CCUS diagnoses among 94 patients, as per strict ICC and WHO HAEM5 definition. (B) Distribution of CHIP or CCUS mutations (right) among 94 patients in relation to each patient’s indication for testing and workup (left). Mutations were identified after bone marrow aspiration was performed for these indications. (C) Somatic variants among 94 patients with CHIP or CCUS, in order of decreasing frequency. (D) Subtype of genomic aberrations within CHIP and CCUS, in order of decreasing frequency (clockwise). (E) Enumeration of mutations in each patient.
FIGURE 2.
FIGURE 2.
Distribution of ICC diagnoses (CHIP/CCUS vs. bona fide myeloid neoplasm) for patients with DTA mutations as identified from the UMass Leukemia Registry. Genomic localization of mutations among major isoforms of (A) DNMT3A, (B) TET2, and (C) ASXL1 for 94 total patients with CHIP or CCUS. Representative chromosomes for DTA mutations are shown. Major isoforms of each gene are shown. UM numbers correspond to each patient.
FIGURE 3.
FIGURE 3.
(A) Clinical trajectory of patients without “sole DTA” mutations (n = 67). Each row corresponds to a patient with a given CH mutational profile at the time of diagnosis. “GeneName x N” designation corresponds to the number of distinct mutations for that gene. For patients who progressed to frank malignancy, onset of red gradient corresponds to time to progression. (B) Clinical trajectory of patients with “sole DTA” mutations without concurrent mutations (n = 27).
FIGURE 4.
FIGURE 4.
Distribution of CHRS categories for (A) patients with DTA mutations only and no co-occurring mutations, (B) all other patients, (C) patients who did not eventually progress to frank MN, and (D) patients who eventually progressed to frank MN. CHRS was calculated for each patient based on mutation risk category and erythrocyte indices at the time of CHIP or CCUS diagnosis.
FIGURE 5.
FIGURE 5.
(A) Patient age at the time of CH diagnosis for non-progressors (gray) vs. progressors (red). (B) Enumeration of mutations in each patient for non-progressors (gray), progressors when they were assessed at the time of CH diagnosis (red), and progressors when they were assessed at the time of progression to frank MN (red). Mean ± S.E. is shown. Student’s t-test was used with α < 0.05.
FIGURE 6.
FIGURE 6.
(A) Distribution of VAFs for all mutant genes among non-progressors (gray) vs. progressors (red). (B) Distribution of VAFs for patients among 3 groups, stratified by DTA status: patients with DTA mutations only without additional mutations (“sole DTA”), patients with both DTA mutations plus additional mutations, and patients with all other mutations besides DTA mutations (“non-DTA”). Maximum VAF for each patient was assessed, and mean of the maximum VAFs is shown. (C) VAFs for individual genes for non-progressors (gray) vs. progressors (red). The subset of patients with DTA with or without additional mutations is shown (blue inset). Mean ± S.E. is shown. Student’s t-test was used with α < 0.05. (D) Oncoprints for DTA-harboring (upper left) vs. non-DTA-harboring (upper right) patients. Subgroups were stratified into non-progressors and progressors. Width of chords does not correspond to frequency of co-occurrence. Length of arcs do not correspond to prevalence of entities.

References

    1. Jaiswal S, Fontanillas P, Flannick J, Manning A, Grauman PV, Mar BG, et al. Age-related clonal hematopoiesis associated with adverse outcomes. N Engl J Med. 2014; 371:2488–98 - PMC - PubMed
    1. Genovese G, Kähler AK, Handsaker RE, Lindberg J, Rose SA, Bakhoum SF, et al. Clonal hematopoiesis and blood-cancer risk inferred from blood DNA sequence. N Engl J Med. 2014; 371:2477–87 - PMC - PubMed
    1. Steensma DP, Bejar R, Jaiswal S, Lindsley RC, Sekeres MA, Hasserjian RP, Ebert BL. Clonal hematopoiesis of indeterminate potential and its distinction from myelodysplastic syndromes. Blood. 2015; 126:9–16 - PMC - PubMed
    1. Arber DA, Orazi A, Hasserjian RP, Borowitz MJ, Calvo KR, Kvasnicka HM, et al. International Consensus Classification of Myeloid Neoplasms and Acute Leukemias: integrating morphologic, clinical, and genomic data. Blood. 2022; 140:1200–1228 - PMC - PubMed
    1. Weeks LD, Ebert BL. Causes and consequences of clonal hematopoiesis. Blood. 2023; 142:2235–2246 - PMC - PubMed

LinkOut - more resources