. 2024 May 21;63(21):e202317756.
doi: 10.1002/anie.202317756. Epub 2024 Apr 17.

Single-Molecule Characterization and Super-Resolution Imaging of Alzheimer's Disease-Relevant Tau Aggregates in Human Samples

Affiliations

Single-Molecule Characterization and Super-Resolution Imaging of Alzheimer's Disease-Relevant Tau Aggregates in Human Samples

Dorothea Böken et al. Angew Chem Int Ed Engl. .

Abstract

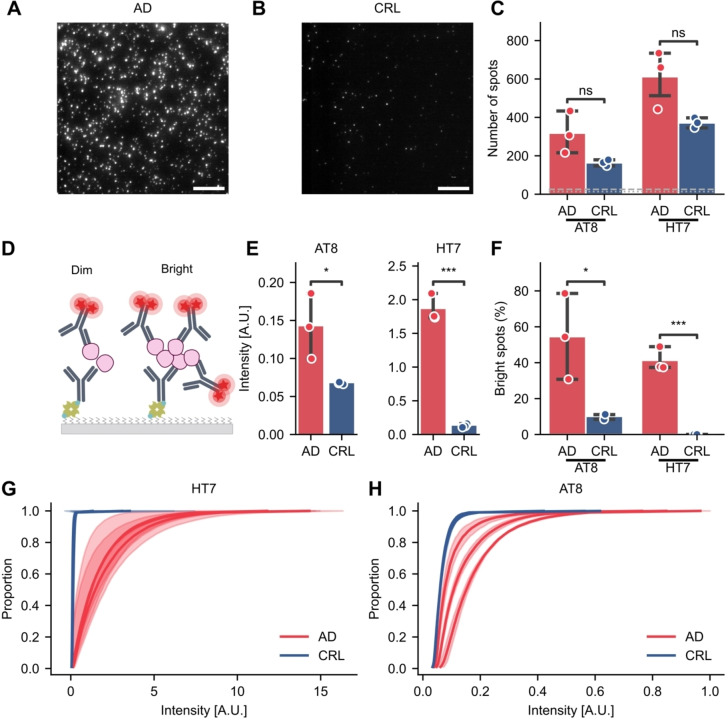
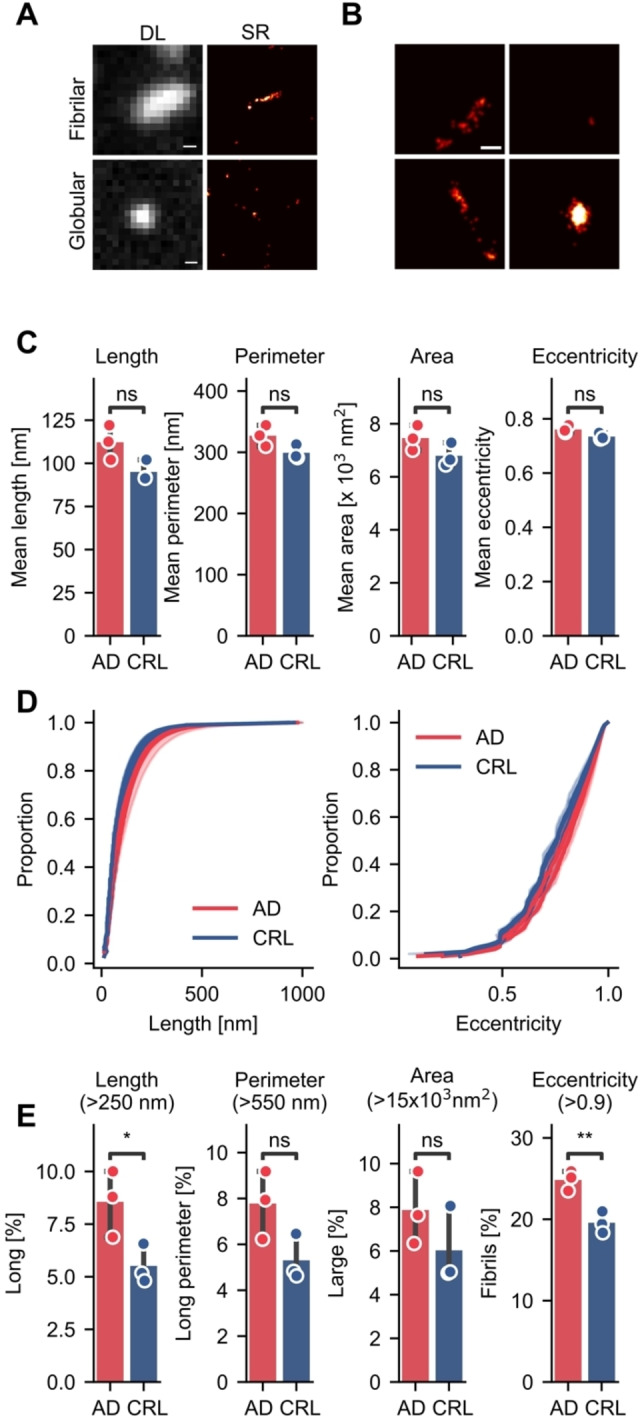
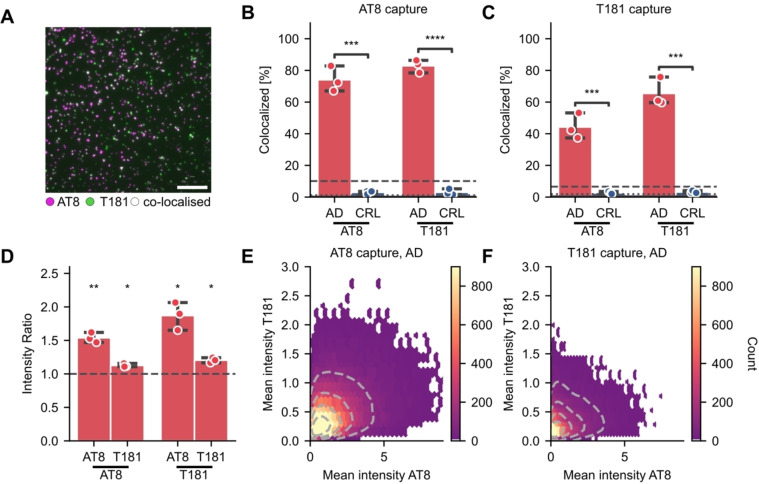
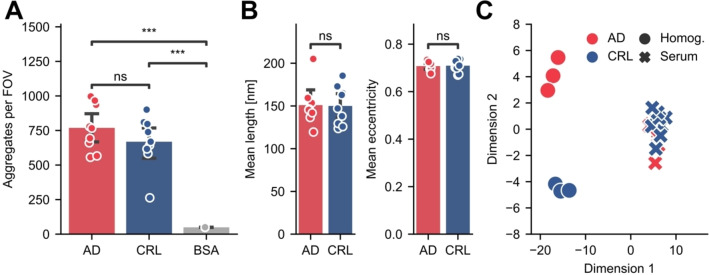
Hyperphosphorylation and aggregation of the protein tau play key roles in the development of Alzheimer's disease (AD). While the molecular structure of the filamentous tau aggregates has been determined to atomic resolution, there is far less information available about the smaller, soluble aggregates, which are believed to be more toxic. Traditional techniques are limited to bulk measures and struggle to identify individual aggregates in complex biological samples. To address this, we developed a novel single-molecule pull-down-based assay (MAPTau) to detect and characterize individual tau aggregates in AD and control post-mortem brain and biofluids. Using MAPTau, we report the quantity, as well as the size and circularity of tau aggregates measured using super-resolution microscopy, revealing AD-specific differences in tau aggregate morphology. By adapting MAPTau to detect multiple phosphorylation markers in individual aggregates using two-color coincidence detection, we derived compositional profiles of the individual aggregates. We find an AD-specific phosphorylation profile of tau aggregates with more than 80 % containing multiple phosphorylations, compared to 5 % in age-matched non-AD controls. Our results show that MAPTau is able to identify disease-specific subpopulations of tau aggregates phosphorylated at different sites, that are invisible to other methods and enable the study of disease mechanisms and diagnosis.

Keywords: fluorescence microscopy; neurodegenerative disease; protein aggregation; proteins; single-molecule studies.


Conflict of interest statement

The authors declare no conflict of interest.

Figures

Figure 1
Figure 1
MAPTau aggregate assay specifically detects multimeric particles. (A) Schematic representation of the single‐molecule pull‐down (SiMPull) assay. For the detection of aggregates, the same antibody is used for capture and detection. Images are acquired using total internal reflection fluorescence (TIRF) microscopy. (B) Representative image of MAPTau applied to a dimer‐mimicking peptide, containing two linked HT7 epitope sequences. Scale bar=10 μm. (C) Representative image for MAPTau of a monomer‐mimicking peptide, containing one HT7 epitope and a randomized sequence. (D) Diffraction‐limited quantification of the number of spots in individual fields of view. Panel D shows mean±S.D. of n=3 technical replicates, compared using a one‐way Anova with post‐hoc Tukey HSD test. ns: p>0.05, **: p<0.01.
Figure 2
Figure 2
Quantification and characterization of tau aggregates in human brain tissue. (A) Representative image obtained for an AD‐derived sample using AT8. Scale bar=10 μm. (B) Representative image obtained from a control sample using AT8. (C) Quantification of total tau (HT7) and p‐tau (AT8) aggregates from AD (Braak stage VI, n=3) and age‐matched control patients (n=3) Levels of BSA background are indicated as dotted (AT8) or dashed (HT7) lines. (D) Schematic of detection antibody binding correlated with aggregate size. Mean intensity of aggregates relates to the number of detection antibodies bound and thereby the aggregate size. (E) Mean intensity of tau aggregates in AD, CRL brain and BSA. (F) Percentage of very bright aggregates (AT8: intensity>0.1 A.U., HT7: intensity>1.5 A.U,). (G–H) Cumulative distribution of the aggregate brightness using (G) HT7 or (H) AT8 of n=3 biological replicates, showing the S.D. of three technical replicates (shade). Panel C, E, F show the mean±S.D. of n=3 biological replicates and asterisks refer to t‐tests: ns: p>0.05, *: p<0.05, **: p<0.01, ***: p<0.001.
Figure 3
Figure 3
Characterizations of brain‐derived tau aggregates using MAPTau combined with super‐resolution microscopy. (A) Representative images of diffraction‐limited and super‐resolved tau aggregates revealing distinct morphological categories. Scale bar=200 nm. (B) Example images of aggregates of varying size and eccentricity. Scale bar=100 nm. (C) Mean length, perimeter, area, and eccentricity of p‐tau aggregates detected via AT8 MAPTau. (D) Cumulative distribution of aggregate length and eccentricity measured as in C of n=3 biological replicates, showing the S.D. of three technical replicates (shade). (E) Proportion of aggregates above the stated thresholds for size (length, perimeter, area) and shape (eccentricity) for brain‐derived samples taken from AD (red) and control (blue) cohorts. Panel C and E show the mean±S.D. of n=3 biological replicates using a t‐test. ns: p>0.05, *: p<0.05, **: p<0.01.
Figure 4
Figure 4
Co‐localization of antibodies targeting tau phosphorylation sites (T181, AT8) reveals differences in disease‐associated aggregate composition. (A) Representative image of co‐localized spots in AD brain homogenate. Scale bar=10 μm. (B–C) Percentage of green spots (T181) co‐localized with magenta spots (AT8) and vice versa using (B) AT8 or (C) T181 to capture aggregates from brain homogenate. (D) Ratio of the brightness of co‐localized and non‐colocalized spots for each channel in B, C. (AT8: 638 nm, T181: 488 nm) detected in AD samples using either AT8 or T181 for capture. (E–F) Mean intensity of each co‐localized spot in AD samples using (E) AT8 or (F) T181 to capture. Panel B and C show the mean±S.D. of n=3 biological replicates in each disease cohort, compared by t‐test. *: p<0.05, **: p<0.01, ***: p<0.001. Panel D: one‐sample t‐test against a hypothetical value of 1 (equivalent to no difference between the co‐localized and non‐colocalized spots).
Figure 5
Figure 5
Quantification of total tau aggregates in human serum. (A) MAPTau quantification of HT7‐positive aggregates in human serum samples from AD and control donors, and a BSA negative control. (B) Mean length and eccentricity in serum tau aggregates determined by super‐resolution microscopy. (C) Linear discriminant analysis (LDA) of human serum (n=9) and brain homogenate (n=3) samples from AD and control patients. Panel A and B show the mean±S.D. of n=9 biological replicates (BSA n=2 technical replicates). Panel A reports a one‐way Anova with post‐hoc Tukey HSD test, Panel B reports Student's t‐tests. ns: p>0.05, **: p<0.01, ***: p<0.001.

Similar articles

Cited by

References

    1. Flament S., Delacourte A., Verny M., Hauw J. J., Javoy-Agid F., Acta Neuropathol. 1991, 81, 591–596. - PubMed
    1. Dickson D. W., Brain Pathol. 1998, 8, 339. - PMC - PubMed
    1. Goedert M., Trends Neurosci. 1993, 16, 460–465. - PubMed
    1. Grundke-Iqbal I., Iqbal K., Tung Y. C., Quinlan M., Wisniewski H. M., Binder L. I., Proc. Natl. Acad. Sci. USA 1986, 83, 4913–4917. - PMC - PubMed
    1. Zhang Y., Wu K. M., Yang L., Dong Q., Yu J. T., Mol. Neurodegener. 2022, 17(1), 1–29. - PMC - PubMed

Publication types

LinkOut - more resources