. 2024 Mar 1;27(4):109400.
doi: 10.1016/j.isci.2024.109400. eCollection 2024 Apr 19.

RhoA downregulation in the murine intestinal epithelium results in chronic Wnt activation and increased tumorigenesis

Affiliations

RhoA downregulation in the murine intestinal epithelium results in chronic Wnt activation and increased tumorigenesis

Higinio Dopeso et al. iScience. .

Abstract

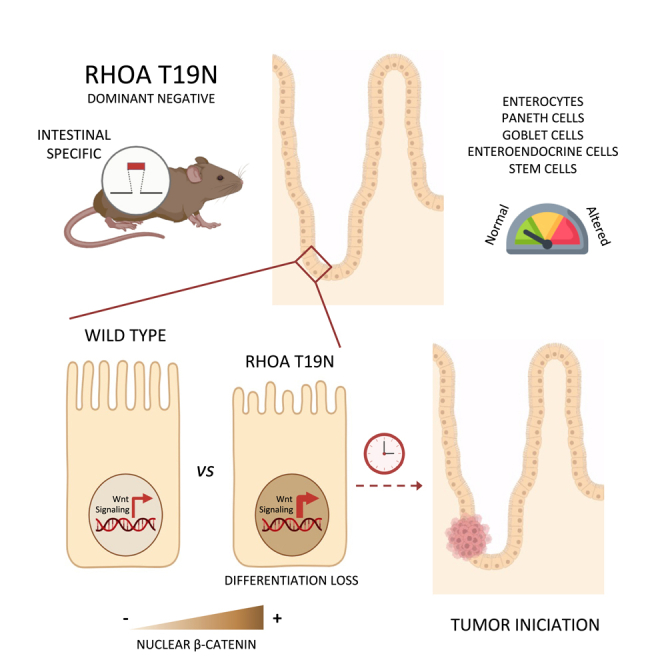
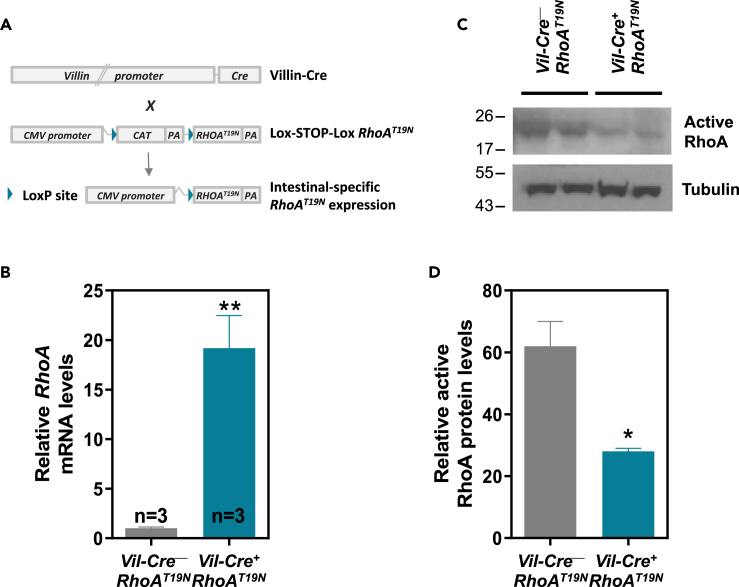
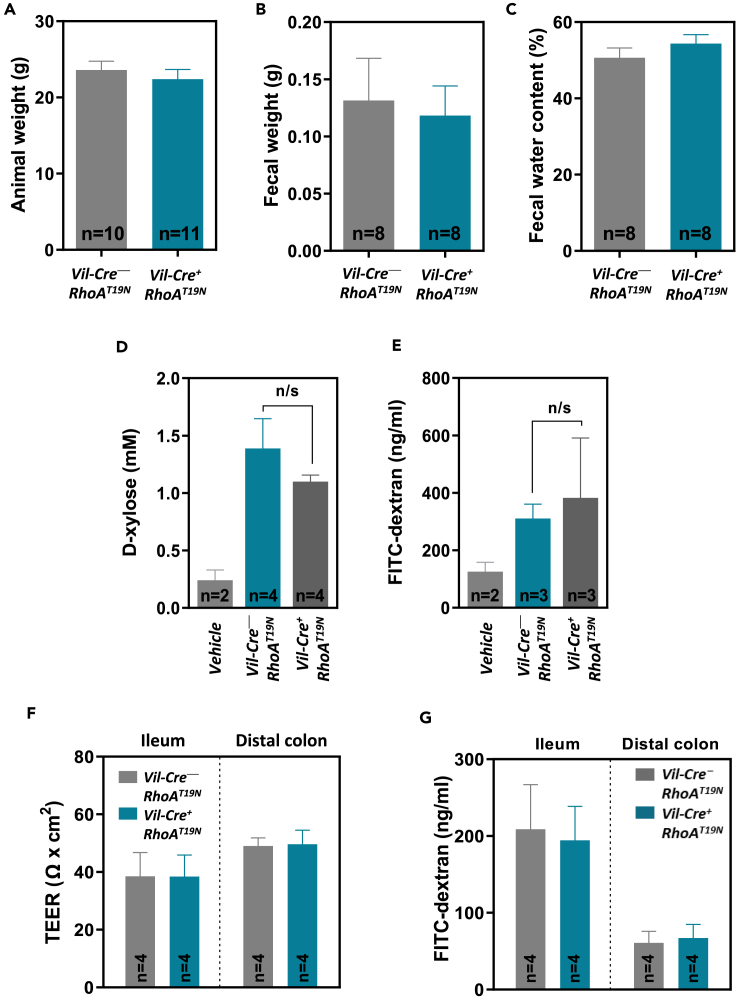
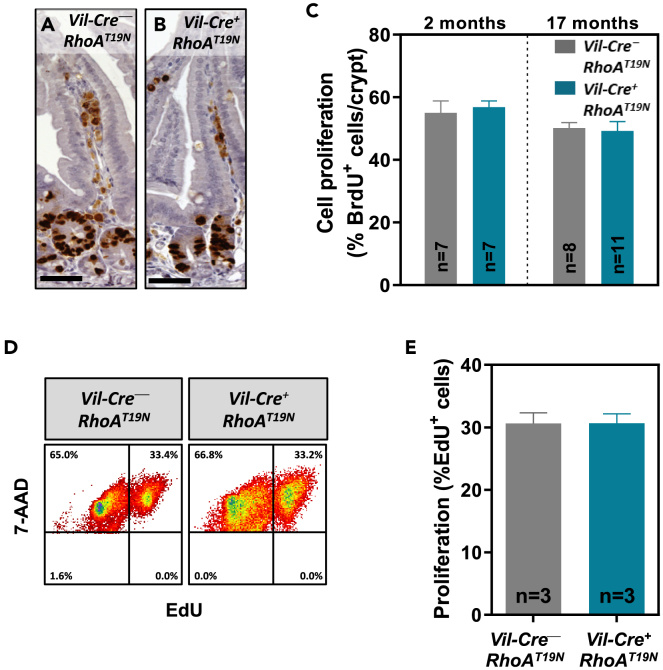
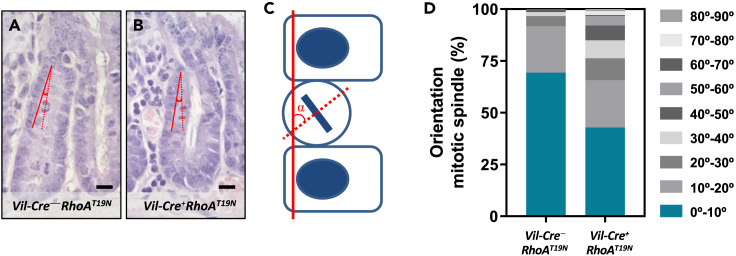
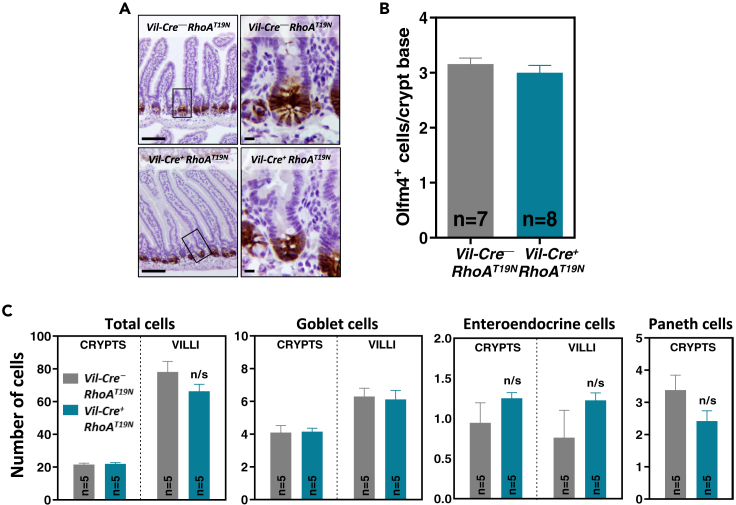
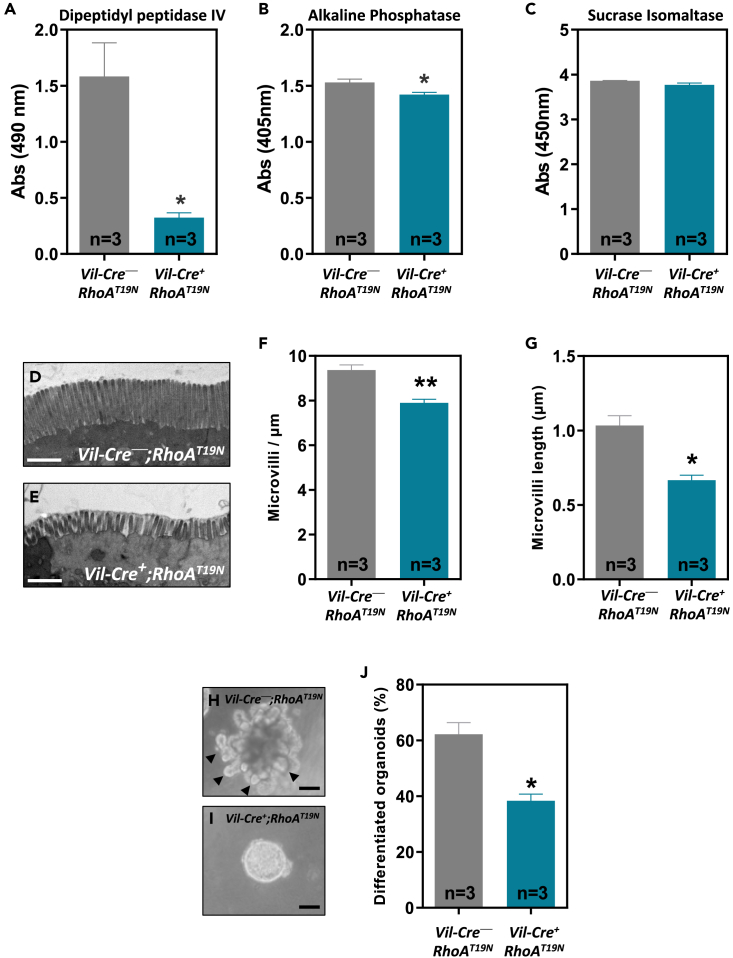
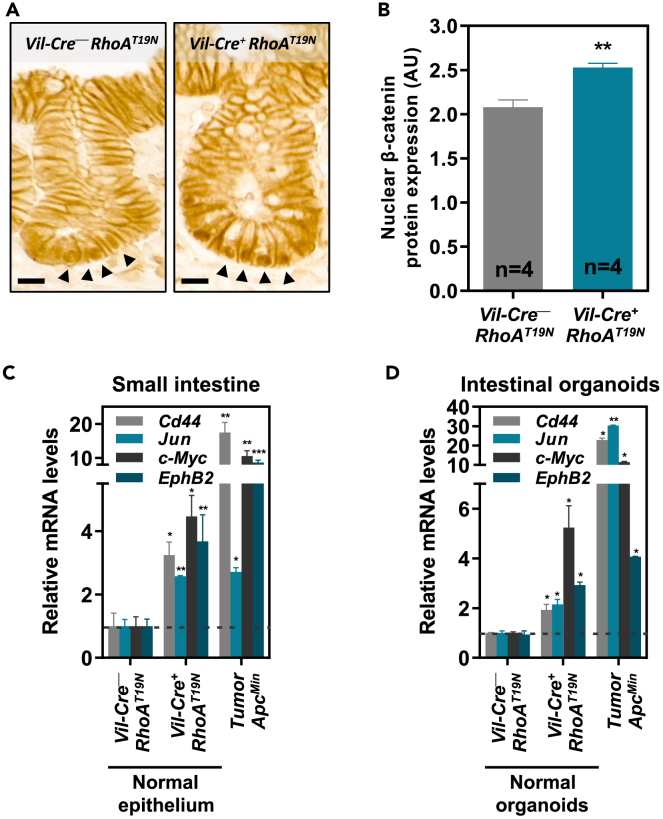
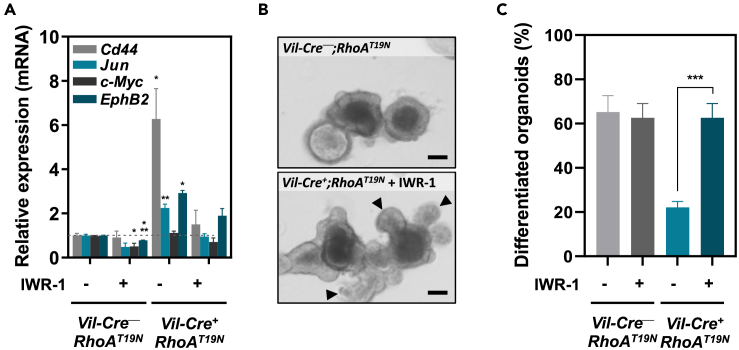
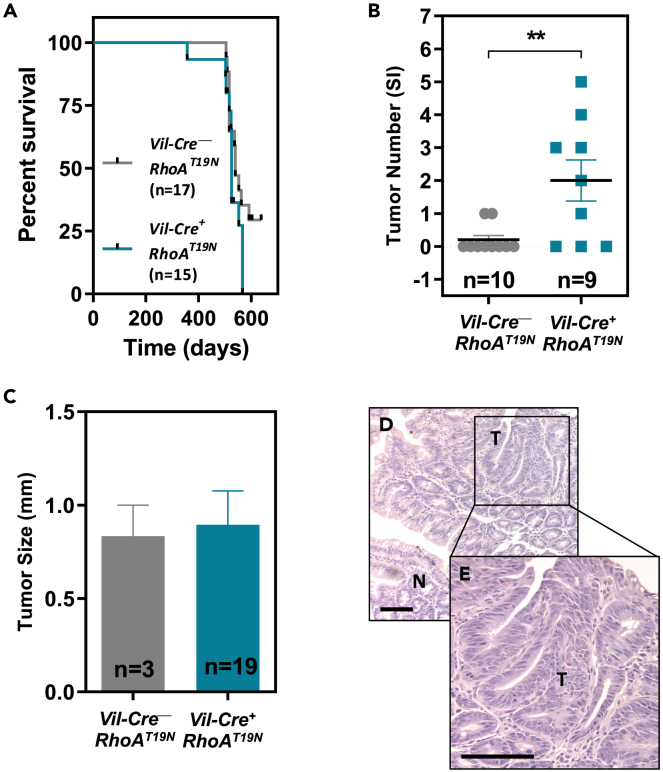
Rho GTPases are molecular switches regulating multiple cellular processes. To investigate the role of RhoA in normal intestinal physiology, we used a conditional mouse model overexpressing a dominant negative RhoA mutant (RhoAT19N) in the intestinal epithelium. Although RhoA inhibition did not cause an overt phenotype, increased levels of nuclear β-catenin were observed in the small intestinal epithelium of RhoAT19N mice, and the overexpression of multiple Wnt target genes revealed a chronic activation of Wnt signaling. Elevated Wnt signaling in RhoAT19N mice and intestinal organoids did not affect the proliferation of intestinal epithelial cells but significantly interfered with their differentiation. Importantly, 17-month-old RhoAT19N mice showed a significant increase in the number of spontaneous intestinal tumors. Altogether, our results indicate that RhoA regulates the differentiation of intestinal epithelial cells and inhibits tumor initiation, likely through the control of Wnt signaling, a key regulator of proliferation and differentiation in the intestine.

Keywords: Cancer; Cell biology.


Conflict of interest statement

The authors declare no competing interests.

Figures

None
Graphical abstract
Figure 1
Figure 1
Generation and validation of a mouse model conditionally expressing dominant negative RhoAT19N (A) Lox-STOP-Lox RhoAT19N mice were crossed with animals carrying Cre recombinase under the control of the intestine-specific promoter of Villin 1 (Villin-Cre). In the double-transgenic mice (Vil-Cre+;RhoAT19N), Cre-loxP recombination deletes the chloramphenicol acetyltransferase (CAT) cassette in the epithelial cells of the intestine, and RhoAT19N is then expressed. (B) mRNA expression of RhoA was assessed by qPCR in the intestine of control mice (Vil-Cre;RhoAT19N) and animals with intestinal expression of RhoAT19N (Vil-Cre+;RhoAT19N). (C and D) Relative levels of active (GTP-bound) RhoA were determined in the intestinal epithelium of control (Vil-Cre;RhoAT19N) and RhoAT19N (Vil-Cre+;RhoAT19N) mice using a rhotekin pull-down assay. A representative experiment is shown in (C), and relative levels of GTP-bound active RhoA are quantified in (D). N = number of animals per group. The mean ± SEM is shown. Student’s t test ∗p < 0.05; ∗∗p < 0.01.
Figure 2
Figure 2
Gross phenotype of mice expressing RhoAT19N (A) Weight of control (Vil-Cre;RhoAT19N) and RhoAT19N (Vil-Cre+;RhoAT19N) mice at 60 days of age. (B and C) Fecal weight (B) and percentage of water content (C) in 17-month-old control and RhoAT19N mice. (D and E) Transcellular (D) and paracellular (E) epithelial transport and integrity was assessed in RhoAT19N and control mice by feeding mice with D-xylose or FITC-dextran, respectively, and determining their presence in plasma 1 or 3 h later, respectively. Background detection levels in control animals that received no D-xylose or FITC-dextran (vehicle) are shown for comparison. (F) Transepithelial electrical resistance (TEER) of the small and large intestinal mucosa was assessed with the Ussing chamber technique in RhoAT19N and control mice. (G) Epithelial permeability of FITC-dextran was assessed ex vivo in the small and large intestinal mucosa of RhoAT19N and control mice. N = number of animals per group. The mean ± SEM is shown. n/s, not significant (Student’s t test p > 0.05).
Figure 3
Figure 3
Effects of RhoA inhibition on proliferation of intestinal epithelial cells (A–D) Two- and 17-month-old mice were intraperitoneally (i.p.) injected with 100 mg/kg 5-Bromo-2′-deoxyuridine (BrdU) 2 h before being euthanized. The number of cells in the S-phase of the cycle during this time was assessed by anti-BrdU immunohistochemistry (A and B; Scale bar: 50 μm). The average number of proliferative cells in the small intestinal epithelium of RhoAT19N (Vil-Cre+;RhoAT19N) and control (Vil-Cre;RhoAT19N) mice at the age of 2 months (C) and 17 months (D) is shown. At least 20 crypts from at least 7 animals per group were scored. (D and E) The number of proliferating cells in small intestinal organoids derived from RhoAT19N and control mice was assessed by flow cytometry after EdU (5-ethynyl-2′-deoxyuridine) staining. Representative results are shown in (D) and the quantification of three independent experiments is shown in (E). N = number of animals per group. The mean ± SEM is shown.
Figure 4
Figure 4
Mitotic spindle orientation in small intestinal epithelial cells (A–C) The orientation of the mitotic spindle of epithelial cells from the small intestine of control (Vil-Cre;RhoAT19N; A) and RhoAT19N (Vil-Cre+;RhoAT19N; B) mice was determined in hematoxylin and eosin-stained sections by measuring the angle (alpha) formed by the mitotic cell in metaphase or anaphase (dotted red line), and the epithelial surface (solid red line; C). Scale bar: 10 μm. (D) The percentage of mitotic cells with angles in the indicated intervals is shown for control and RhoAT19N mice. At least 140 mitosis were scored in at least 8 animals per group. Fisher’s exact test of alpha >30° in control vs. RhoAT19N (5% and 25.2%, respectively), ∗∗∗p = 1.5 × 10−6.
Figure 5
Figure 5
Effects of RhoA inhibition on the histology of intestinal epithelium and barrier function (A and B) The number of Olfm4+ stem cells was determined by immunohistochemistry. Representative results are shown in (A). Scale bars: 50 μm (left) and 5 μm (right). The number of Olfm4+ cells located at the base of the crypt (cell positions 0–4) in RhoAT19N (Vil-Cre+;RhoAT19N) and control (Vil-Cre;RhoAT19N) mice was quantified in (B). (C) The total number of cells (hematoxylin staining) as well as goblet (1% Alcian blue staining), enteroendocrine (Grimelius staining), and Paneth (anti-lysozyme immunostaining) cells were quantified in the villus and crypt compartments of the small intestine of RhoAT19N and control mice. N = number of animals per group. The mean ± SEM is shown. n/s: not significant (Student’s t test p > 0.05).
Figure 6
Figure 6
Effects of RhoA inhibition on enterocyte differentiation and brush border formation (A–C) The activity of the brush border enzymes dipeptidylpeptidase IV (A), alkaline phosphatase (B), and sucrose isomaltase (C) was determined in the normal intestine of 13-week-old RhoAT19N (Vil-Cre+;RhoAT19N) and control (Vil-Cre;RhoAT19N). (D and E) Representative transmission electron microscopy pictures of the brush border of epithelial absorptive cells from the small intestine of 13-week-old control mice (D) and RhoAT19N animals (E). Scale bar: 1 μm. (F and G) show the average density and length of the microvilli of RhoAT19N and control mice. (H and I) Representative photos of duodenal organoids derived from control (H) or RhoAT19N (I) mice. Arrowheads indicate budding crypt-like structures in differentiated organoids. Scale bar: 50 μm. (J) Percentage of differentiated organoids (i.e., showing budding crypt-like structures) derived from RhoAT19N and control mice at the indicated times after seeding in 3D Matrigel cultures. N = number of animals per group. The mean ± SEM is shown. Student’s t test ∗p < 0.05; ∗∗p < 0.01.
Figure 7
Figure 7
Effects of RhoA downregulation on Wnt signaling (A and B) β-catenin levels were assessed by immunohistochemistry in the small intestinal epithelium of RhoAT19N and control mice (A), and the intensity of all positive nuclei in crypts cells was quantified (B). Arrowheads indicate representative positive cells for nuclear β-catenin staining. Scale bar: 10 μm. N = number of animals per group. (C and D) The expression of the Wnt target genes Cd44, Jun, c-Myc, and EphB2 was assessed by qPCR in the intestinal epithelium (duodenum) of 13-week-old RhoAT19N (Vil-Cre+;RhoAT19N) and control (Vil-Cre;RhoAT19N) mice (C), and small intestinal organoids derived from these animals (D). The effects of Apc inactivation on Wnt signaling target genes in intestinal tumors of ApcMin mice (C) and organoids derived from these tumors (D) are shown for comparison. Mean expression ±SEM in the normal epithelium of three animals or three experiments with intestinal organoids is shown. Student’s t test ∗p < 0.05; ∗∗p < 0.01; ∗∗∗p < 0.001.
Figure 8
Figure 8
Effects of the inhibition of RhoAT19N-dependent Wnt activation (A) Relative levels of expression of the Wnt target genes Cd44, Jun, c-Myc, and EphB2 after treatment with the Wnt inhibitor IWR-1-endo (200 nM) in small intestinal organoids derived from RhoAT19N (Vil-Cre+;RhoAT19N) and control (Vil-Cre;RhoAT19N) mice. (B and C) Effects of IWR-1-mediated Wnt inhibition on the differentiation of organoids derived from the small intestine of RhoAT19N and control mice. Representative photos of duodenal organoids derived from RhoAT19N in the presence or absence of IWR-1 treatment (B). Arrowheads indicate budding crypt-like structures in differentiated organoids. Scale bar: 50 μm. The mean percentage of differentiated organoids from RhoAT19N and control mice is shown in panel (C). The mean ± SEM in three independent experiments each of them carried out in triplicate is shown. Student’s t test ∗p < 0.05; ∗∗∗p < 0.001.
Figure 9
Figure 9
Effects of RhoA inhibition on intestinal tumorigenesis (A) Kaplan-Meier curves showing the survival of RhoAT19N (Vil-Cre+;RhoAT19N) and control (Vil-Cre;RhoAT19N) mice (Log -rank test p = 0.22). (B) Total number of macroscopically visible tumors in the small intestine of 17-month-old RhoAT19N and control mice. N = number of animals per group. (C) Average size of tumors in the small intestine of RhoAT19N and control mice. N = number of tumors included in the analysis. (D) Micrograph showing the normal small intestinal mucosa (N) and a representative intestinal tumor (T) in a RhoAT19N mouse. (E) The indicated region is shown at higher magnification. Scale bar: 100 μm. The mean ± SEM is shown. Student’s t test ∗∗p < 0.01.

References

    1. Cheng H., Leblond C.P. Origin, differentiation and renewal of the four main epithelial cell types in the mouse small intestine. V. Unitarian Theory of the origin of the four epithelial cell types. Am. J. Anat. 1974;141:537–561. doi: 10.1002/aja.1001410407. - DOI - PubMed
    1. Clevers H. The intestinal crypt, a prototype stem cell compartment. Cell. 2013;154:274–284. doi: 10.1016/j.cell.2013.07.004. - DOI - PubMed
    1. Cheng H., Leblond C.P. Origin, differentiation and renewal of the four main epithelial cell types in the mouse small intestine. I. Columnar cell. Am. J. Anat. 1974;141:461–479. doi: 10.1002/aja.1001410403. - DOI - PubMed
    1. Cheng H. Origin, differentiation and renewal of the four main epithelial cell types in the mouse small intestine. II. Mucous cells. Am. J. Anat. 1974;141:481–501. doi: 10.1002/aja.1001410404. - DOI - PubMed
    1. Cheng H., Leblond C.P. Origin, differentiation and renewal of the four main epithelial cell types in the mouse small intestine. III. Entero-endocrine cells. Am. J. Anat. 1974;141:503–519. doi: 10.1002/aja.1001410405. - DOI - PubMed

LinkOut - more resources