. 2024 Feb 23;27(4):109316.
doi: 10.1016/j.isci.2024.109316. eCollection 2024 Apr 19.

From biological data to oscillator models using SINDy

Affiliations

From biological data to oscillator models using SINDy

Bartosz Prokop et al. iScience. .

Abstract

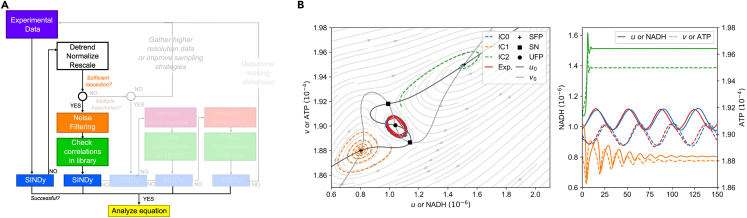
Periodic changes in the concentration or activity of different molecules regulate vital cellular processes such as cell division and circadian rhythms. Developing mathematical models is essential to better understand the mechanisms underlying these oscillations. Recent data-driven methods like SINDy have fundamentally changed model identification, yet their application to experimental biological data remains limited. This study investigates SINDy's constraints by directly applying it to biological oscillatory data. We identify insufficient resolution, noise, dimensionality, and limited prior knowledge as primary limitations. Using various generic oscillator models of different complexity and/or dimensionality, we systematically analyze these factors. We then propose a comprehensive guide for inferring models from biological data, addressing these challenges step by step. Our approach is validated using glycolytic oscillation data from yeast.

Keywords: Bioinformatics; Machine learning.


Conflict of interest statement

The authors declare no competing interests.

Figures

None
Graphical abstract
Figure 1
Figure 1
Model identification with SINDy from data of selected, real oscillatory system (A and B) The SINDy method takes experimental data and creates a system of linear equations with a term library containing all possible terms and their coefficients. (C) Models are identified by applying a regression algorithm that solves the system. To determine the ‘best’ model, we scan through the hyperparameters of the regression algorithm and evaluate complexity (the amount of terms selected to be part of a suggested model by SINDy) and goodness of fit (here with the coefficient of determination or R2 score). By overlaying complexity and goodness of fit we can determine for which sets of hyperparameters the identified models, overfit, underfit or provide the best approximation to the data. In order to identify limitations of the SINDy method, we try to identify models of three selected oscillatory systems from experimental data: The simple pendulum, the Belousov-Zhabotinsky reaction, and oscillations in the glycolytic pathway. The systems and the acquired experimental data represent different levels of data quality, sufficient access to state variables, and knowledge of the underlying mechanisms. This can also be seen by applying the SINDy method to the data: (D) For the simple pendulum, we are able to determine the correct underlying system that reproduces the observed dynamical behavior. (E) For the BZ reaction, we are able to identify a model that captures the behavior but is not sparse, since it has to account for the nonlinear reduction of the system to only two variables. (F) Finally, when applied to data from glycolytic oscillations, we see that the SINDy method fails to identify a suitable model. (See STAR methods).
Figure 2
Figure 2
Classification of oscillator models in the model space of biological processes Biological (oscillator) models can be characterized under two aspects: complexity of interactions and number of dimensions (state variables). There is a model space where both aspects are leading to functional models. If a model has low complexity of interactions and low number of dimensions, it is usually (over) simplified, or if both aspects are high it is (over) complicated. Models on the diagonal provide a trade-off between both aspects. In our work we consider three generic biological (oscillatory) models that can be applied to a range of biological systems: FitzHugh-Nagumo oscillator (with cubic (bistable) interactions), Goodwin oscillator (ultrasensitivity in the form of a Hill function) and the (cell cycle) mass action model (with lower order interactions).
Figure 3
Figure 3
Investigation of data availability, equidistant sampling and added Gaussian noise for weak and strong timescale separation ε in the FHN model (A) The chosen models are simulated to generate one time series with dt=1103 which are later subsampled to simulate low-data limits. Noise is added in the form of up to 10% Gaussian noise. (B) By varying the length of the time series by the information content in information units (periods), we determine that increasing the length of the time series does not affect the amount of points needed for model recovery if at least 4 periods are present. (C) Combining simulated time series of length teval=4T and added Gaussian noise, SINDy is able to recover the underlying model correctly (yellow) or its correct form (turquoise) for at least 45 points per period with up to 3% noise. (D) Noise reduction techniques (low-pass filter, Wiener filter, LPSA and Savitzky-Golay filter) are able to improve the performance of SINDy for higher noise levels, however, the success depends on underlying methodology (more details in text). (E) An important aspects of biological oscillatory systems is timescale separation, which can be changes with the ε parameter in the FHN model. For stronger timescale separation (small ε) identification requires high-resolution/low-noise data and fails for to strong separation. (F) The strength of separation also influences the performance of SINDy with noise filtering, where frequency filters (low-pass and Wiener filter) fail and techniques which estimate noise locally (LPSA and Savitzky-Golay) are superior.
Figure 4
Figure 4
Addressing low-data and high noise with multiple trajectories (A) Despite the claims of, the application of E-SINDy (right) compared to just SINDy (left) does not improve model recovery. (B) Inspection of the respective term probabilities to be included pinc in the inferred model (threshold for inclusion in equation is pthres=0.9), show that E-SINDy underestimates the probability of several terms (e.g., v for vt) and overestimates mixed terms (e.g., uv for ut). (C) Providing more trajectories of the underlying dynamics with different, random initial conditions (IC) leads to an improved identification of the correct form of the FHN equation. The different IC are shown in the left panel: squares for two ICs, triangles for 16 ICs and circles for 64 ICs. (D) Applying a subsequent nonlinear regression algorithm on noisy and sparse data with the identified models allows to identify the correct coefficients.
Figure 5
Figure 5
Mitigating timescale separation with optimized sampling (A) The equidistant sampling can be optimized in order to provide more information on the fast dynamics by distributing the same amount of points unevenly between slow and fast changes. (B) For timescale separation of ε=0.3 and by assigning 20% of the time series (α1+α2=0.2T) the performance is improved if already more then the basic 20% of points are evenly distributed in the fast changes, with an optimal distribution at 50/50 or 60/40 in favor of the fast changes. (C) For stronger timescale separation of ε=0.1 an improved sampling strategy is able to significantly reduce the amount of points required, where the performance improves with the amount of points assigned to the fast changes, reducing the required amount from 115 ppp to 40 ppp with a distribution of 80/20.
Figure 6
Figure 6
Enabling identification of a Hill-type response function with SINDy (A) SINDy cannot find the interpretable Hill-function but is able to approximate the nonlinearity (n=10) with higher order polynomials. (B) SINDy-PI applies the SR3 regression (Equation 14) using the hyperparameters threshold l and tolerance δtol. Only for a subset of hyperparameters the full set of equations (ut,vt,wt) can be identified (see left panel). Using the R2 score a majority of models either does not reproduce the data or when simulated show non physical behavior (explosion of values). Three models with R2>0.9 (called best, shown in Table 2) provide the nonlinearity 1/w10H(w), but do not match the Goodwin model. (C) Identification of the Hill-function is highly sensitive to data amounts but not toward the amount of noise. (D) When the Hill functional form is known, SINDy is not able to identify the underlying model because of existent correlations between library terms, e.g., u and uH(v). (E) Correlations ρij between different terms are identified and a threshold ρthres is applied from which correlated terms are excluded from the term library. (F) Excluding correlated terms allows SINDy to identify the correct underlying model. However, correlating the term library is only possible for low noise levels.
Figure 7
Figure 7
Identification of high-dimensional system by reducing set of state variables (A) Model identification with high-dimensional data of the mass action oscillator requires high-data/low-noise situation in order to correctly identify the underlying system. (B) Reducing the system to only two variables, e.g., u and v, and centering the data around the point (0,0), assuming that the unstable fixed point is symmetric toward the limit cycle can be used to derive important dynamical information while reducing data requirements. (C) Applying SINDy to different combinations of state variables u,v,w,x,y and determining the R2 score (left) and complexity k (right) within a threshold l and regularization parameter α scan provides us with a set of models with high R2 scores and low complexity (red dots) that can be further studied dynamically and experimentally. These models occur when the state variables creating the limit cycle are well-separated thus providing sufficient information about the dynamics of the system. Only if the behavior cannot be approximated by a cubic polynomial as for (v,y) (red circle) SINDy struggles to identify a suitable model, similarly as in the BZ reaction.
Figure 8
Figure 8
Overview of suggested step-by-step approach for application of SINDy on biological oscillator data Resulting from the study on synthetic data, we suggest a step-by-step guide on how to approach model identification with SINDy when handling oscillatory experimental data in biology.
Figure 9
Figure 9
Enabling model identification from experimental data on glycolytic oscillations in yeast (A) To enable model identification for glycolytic oscillations in yeast, the data are detrended, normalized and centered around (0,0) in phase space. These steps allow us to identify a model which is able to describe the dynamics (Transformed data not shown here). (B) The found model in Equation 16 with an R2 = 0.7824 and a complexity of k=14 is identified, which is able to describe the dynamical behavior and uncovers steady states in the system that are found in experiments but not represented in the popular Selkov model (Data have been transformed back to be compared to original experimental data; data in right plot uses the same color scheme as the left plot).
Figure 10
Figure 10
Improving model identification with interpolation of experimental data Increasing the resolution by 100 times of the original amount of ppp (38 ppp to 3800 ppp) the identified model preserves the dynamical behavior while becoming not only easily interpretable but can also be studied analytically (Data in right plot uses the same color scheme as the left plot).

References

    1. Winfree A.T. The prehistory of the Belousov-Zhabotinsky oscillator. J. Chem. Educ. 1984;61:661.
    1. Field R.J., Koros E., Noyes R.M. Oscillations in Chemical Systems. II. Thorough Analysis of Temporal Oscillation in the Bromate–Cerium–Malonic Acid System. J. Am. Chem. Soc. 1972;94:8649–8664. doi: 10.1021/ja00780a001. - DOI
    1. Briggs T.S., Rauscher W.C. An oscillating iodine clock. J. Chem. Educ. 1973;50:496. doi: 10.1021/ED050P496. - DOI
    1. Patke A., Young M.W., Axelrod S. Molecular mechanisms and physiological importance of circadian rhythms. Nat. Rev. Mol. Cell Biol. 2020;21:67–84. doi: 10.1038/s41580-019-0179-2. - DOI - PubMed
    1. Lotka A.J. UNDAMPED OSCILLATIONS DERIVED FROM THE LAW OF MASS ACTION. J. Am. Chem. Soc. 1920;42:1595–1599. doi: 10.1021/ja01453a010. - DOI

LinkOut - more resources