. 2024 Mar 8:15:1339336.
doi: 10.3389/fimmu.2024.1339336. eCollection 2024.

Revisiting roles of mast cells and neural cells in keloid: exploring their connection to disease activity

Affiliations

Revisiting roles of mast cells and neural cells in keloid: exploring their connection to disease activity

Eunhye Yeo et al. Front Immunol. .

Abstract

Background: Mast cells (MCs) and neural cells (NCs) are important in a keloid microenvironment. They might contribute to fibrosis and pain sensation within the keloid. However, their involvement in pathological excessive scarring has not been adequately explored.

Objectives: To elucidate roles of MCs and NCs in keloid pathogenesis and their correlation with disease activity.

Methods: Keloid samples from chest and back regions were analyzed. Single-cell RNA sequencing (scRNA-seq) was conducted for six active keloids (AK) samples, four inactive keloids (IK) samples, and three mature scar (MS) samples from patients with keloids.

Results: The scRNA-seq analysis demonstrated notable enrichment of MCs, lymphocytes, and macrophages in AKs, which exhibited continuous growth at the excision site when compared to IK and MS samples (P = 0.042). Expression levels of marker genes associated with activated and degranulated MCs, including FCER1G, BTK, and GATA2, were specifically elevated in keloid lesions. Notably, MCs within AK lesions exhibited elevated expression of genes such as NTRK1, S1PR1, and S1PR2 associated with neuropeptide receptors. Neural progenitor cell and non-myelinating Schwann cell (nmSC) genes were highly expressed in keloids, whereas myelinating Schwann cell (mSC) genes were specific to MS samples.

Conclusions: scRNA-seq analyses of AK, IK, and MS samples unveiled substantial microenvironmental heterogeneity. Such heterogeneity might be linked to disease activity. These findings suggest the potential contribution of MCs and NCs to keloid pathogenesis. Histopathological and molecular features observed in AK and IK samples provide valuable insights into the mechanisms underlying pain and pruritus in keloid lesions.

Keywords: cell-cell interaction; keloid; mast cell; microenvironment; neural cell; single-cell sequencing.


Conflict of interest statement

The authors declare that the research was conducted in the absence of any commercial or financial relationships that could be construed as a potential conflict of interest.

Figures

Figure 1
Figure 1
Clinical and histopathological features of keloids. (A–C) Clinical pictures and histopathological staining of AK. (A) Preoperative view; (B) Three months after operation. (C) In AK stained with H&E (20x), a heavy infiltrate of FBs and lymphocytes was found. (D–F) Clinical pictures and histopathological staining of IK. (D) Preoperative view; (E) Three months after the operation. (F) In IK stained with H&E(20x), compact collagen bundles and abundant FBs were found. (G, H) MS. (G) Clinical pictures of MS. (H) MS samples stained with H&E(20x). AK, active keloid; IK, inactive keloid; MS, matured scar; H&E, hematoxylin and eosin.
Figure 2
Figure 2
Single-cell RNA sequencing reveals cellular landscape of keloids and scars. (A) Uniform manifold approximation and projection (UMAP) plot depicting single-cell transcriptomes of keloids and MSs (n = 13). (B) A UMAP plot demonstrating 11 major cell lineages. (C) Cluster annotation. The violin plot shows canonical marker expressions representative of each cluster. KC, keratinocyte; FB, fibroblast; MFB, myofibroblast; EC, endothelial cell; LEC, lymphatic endothelial cell. (D) UMAP projection of FB subclusters. Keloid and scar FBs could be divided into four subpopulations: secretory-papillary, secretory-reticular, mesenchymal, and pro-inflammatory (E) Relative proportions of each subcluster of FBs in AK, IK, MS, and each sample. AK, active keloid; IK, inactive keloid; MS, matured scar.
Figure 3
Figure 3
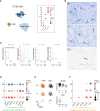
Characteristics of mast cells in AK, IK, and MS. (A) UMAP plot and Dot plot depicting the expression of selected marker genes for Lymphocytes (LCs), Macrophages (MACs), and Mast cells (MCs). (B) Toluidine blue stain showing MCs in AK, IK, and MS under high power (20x). (C) Box plot comparing cell compositions of each cell subset in each colored annotated group. Cochran Armitage trend test. (D) Dot plot showing expression of selected marker genes for MCs degranulation activation. (E) Feature plots, Violin plots showing expression of TPSAB1 and CMA1 marker genes in AK, IK, and MS. (F) Dot plot showing expression of selected marker genes for neuropeptide receptor.
Figure 4
Figure 4
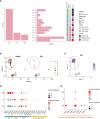
Characteristics of neural cells in AK, IK, and MS. (A) Relative proportions of neural cells in AK, IK, and MS samples. (B) UMAP plot depicting single-cell transcriptomes of keloids and MS. (C) Feature plots showing expression of NES. (D) Dot plots depicting the expression of mSC, nmSC, pre-mSC, and NMC in AK, IK, and MS. mSC, myelinating Schwann cells; nmSC, non-myelinating Schwann cells; pre-mSC, pre-myelinating Schwann cells; NMC, neural mesenchymal precursor cells; (E) Dot plot depicting the expression of selected marker genes (TRPA1, NPPB, NPR1, HRH1, and HRH4, S1PR1, F2RL3) for pain.
Figure 5
Figure 5
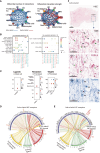
Intercellular Communication in AK and IK. (A) Circus plots depict differential or strength of interactions between two datasets in the cell communication network. Red (or blue) colored edges represent increased (or decreased) signaling in the IK compared to the AK. All significant signaling pathways were ranked based on their differences of overall information flow within inferred networks between IK and AK. (B) Comparison of significant ligand-receptor pairs between AK and IK contribute to signaling from MCs to another cell type. Dot color reflects communication probabilities and dot size represents computed p-values. Empty space means communication probability is zero. p-values are computed from one-sided permutation test. (C) A dot plot showing expression of ligand TPSAB1 in AK, IK, and MS of MC, expression of receptor F2RL1 in AK, IK, and MS of FB, and expression of targets TGFB1, FN1, and COL1A1 in AK, IK, and MS of FB. (D, E) NicheNet analysis reveals ligands, receptors, and target genes that contribute to transcriptional changes in MCs and NCs following keloid disease activity. (D) Circus plots showing the top ligand–receptor pairs identified by NicheNet. Transparency of the connection represents the interaction strength. NC ligands are on the bottom, and MCs are on top. (E) Summary of MCs ligand-NCs receptor interactions. (F) Immunohistochemical characterization of the MC and NC in the AK (20x). Distribution of tryptase-positive MC (blue; black arrows) and PGP9.5-positive nerve fibers (pink; green arrows) and H&E staining (1x).
Figure 6
Figure 6
Diagram depicting the involvement of mast cells in the development of fibrosis and pain in keloids.

References

    1. Rinkevich Y, Walmsley GG, Hu MS, Maan ZN, Newman AM, Drukker M, et al. . Skin fibrosis. Identification and isolation of a dermal lineage with intrinsic fibrogenic potential. Science. (2015) 348:aaa2151. doi: 10.1126/science.aaa2151 - DOI - PMC - PubMed
    1. Deng CC, Hu YF, Zhu DH, Cheng Q, Gu JJ, Feng QL, et al. . Single-cell RNA-seq reveals fibroblast heterogeneity and increased mesenchymal fibroblasts in human fibrotic skin diseases. Nat Commun. (2021) 12:3709. doi: 10.1038/s41467-021-24110-y - DOI - PMC - PubMed
    1. Abergel RP, Pizzurro D, Meeker CA, Lask G, Matsuoka LY, Minor RR, et al. . Biochemical composition of the connective tissue in keloids and analysis of collagen metabolism in keloid fibroblast cultures. J Invest Dermatol. (1985) 84:384–90. doi: 10.1111/1523-1747.ep12265471 - DOI - PubMed
    1. Arno AI, Gauglitz GG, Barret JP, Jeschke MG. Up-to-date approach to manage keloids and hypertrophic scars: a useful guide. Burns. (2014) 40:1255–66. doi: 10.1016/j.burns.2014.02.011 - DOI - PMC - PubMed
    1. Alghamdi MA, Al-Eitan LN, Stevenson A, Chaudhari N, Hortin N, Wallace HJ, et al. . Secreted factors from keloid keratinocytes modulate collagen deposition by fibroblasts from normal and fibrotic tissue: A pilot study. Biomedicines. (2020) 8:200. doi: 10.3390/biomedicines8070200 - DOI - PMC - PubMed

Publication types