Review
. 2024 Mar 4;9(11):12331-12379.
doi: 10.1021/acsomega.3c07804. eCollection 2024 Mar 19.

Definitive Review of Nanobiochar

Affiliations
Review

Definitive Review of Nanobiochar

Abhishek Kumar Chaubey et al. ACS Omega. .

Abstract

Nanobiochar is an advanced nanosized biochar with enhanced properties and wide applicability for a variety of modern-day applications. Nanobiochar can be developed easily from bulk biochar through top-down approaches including ball-milling, centrifugation, sonication, and hydrothermal synthesis. Nanobiochar can also be modified or engineered to obtain "engineered nanobiochar" or biochar nanocomposites with enhanced properties and applications. Nanobiochar provides many fold enhancements in surface area (0.4-97-times), pore size (0.1-5.3-times), total pore volume (0.5-48.5-times), and surface functionalities over bulk biochars. These enhancements have given increased contaminant sorption in both aqueous and soil media. Further, nanobiochar has also shown catalytic properties and applications in sensors, additive/fillers, targeted drug delivery, enzyme immobilization, polymer production, etc. The advantages and disadvantages of nanobiochar over bulk biochar are summarized herein, in detail. The processes and mechanisms involved in nanobiochar synthesis and contaminants sorption over nanobiochar are summarized. Finally, future directions and recommendations are suggested.


Conflict of interest statement

The authors declare no competing financial interest.

Figures

Figure 1
Figure 1
Bibliometric analysis of nanobiochar studies: (A) annual article production, (B) average total citations per article, (C) journal-wise article distribution. Data were collected on December 5, 2023 from Web of Science and processed by bibliometrix package (RStudio).
Figure 2
Figure 2
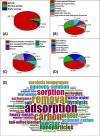
Bibliometric analysis of nanobiochar studies: (A) document types, (B) distribution of publications by science category, (C) nanobiochar application area, (D) nanobiochar preparation methods, and (E) WordCloud. Data were collected and processed on December 5, 2023 from Web of Science.
Figure 3
Figure 3
VOSviewer’s (A) network visualization for co-occurrence of all keywords and (B) bibliographic coupling among countries from 221 peer-reviewed publications (2013–2023). Each frame represents a keyword, and the size of the frame represents the number of times a pair of keywords appears together in a publication.
Figure 4
Figure 4
Collaboration among countries with total scientific production on nanobiochar research, prepared by bibliometrix package (RStudio).
Figure 5
Figure 5
Trend topics related to nanobiochar research from 2016 to 2023, prepared by bibliometrix package (RStudio).
Figure 6
Figure 6
Historiograph of nanobiochar recent research from 2017 to 2023, prepared by bibliometrix package (RStudio).
Figure 7
Figure 7
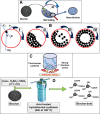
(A) Typical ball milling, (B) ball milling functioning, (I) impact of forces and the types of motion of grinding balls in a ball mill: (II) rolling over; (III) falling; (IV) rolling. Reprinted with permission from ref (60). Copyright 2021 Elsevier. (C) Sonication and (D) acid treated hydrothermal method. Reprinted with permission from ref (70). Copyright 2017 American Chemical Society.
Figure 8
Figure 8
Schematic illustration of the synthesis technique for the functionalization of exfoliated wheat straw biochar nanosheets by a thermal flash pyrolysis method. Reprinted with permission from ref (73). Copyright 2022 Elsevier.
Figure 9
Figure 9
Example ball mill-assisted syntheses of nanobiochar and engineered nanobiochar.
Figure 10
Figure 10
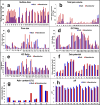
Comparison between bulk and nanobiochar (synthesized using ball milling) properties i.e., (a) surface area, (b) total pore volume, (c) pore size, (d) O/C ratio, (e) H/C ratio, (f) zeta potential, (g) ash content and (h) pH. All information related to the feedstock, precursor pyrolysis temperature, nanobiochar preparation conditions, and sample numbers on x-axis are given in Table 3. Data obtained (Table 3) with permission from refs (103, 77, 87, 105, 284, 14, 78, 104, 76, 6, 110, 13). Copyright 2020, 2016, 2020, 2019, 2020, 2020, 2020, 2019, 2018, 2020, 2019, 2020 Elsevier, respectively. Data obtained (Table 3) with permission from ref (89). Copyright 2019 Taylor and Francis.
Figure 11
Figure 11
Comparison between precursor bulk and product nanobiochars (synthesized using sonication) properties i.e., (a) surface area, (b) O/C ratio, (c) H/C ratio, (d) zeta potential, (e) pH, and (f) ash content. All information related to the feedstock, precursor pyrolysis temperature, nanobiochar preparation conditions, and sample numbers on x-axis are given in Table 3. Data obtained (Table 3) with permission from refs (118, 151). Copyright 2013 and 2018 American Chemical Society, respectively. Data obtained (Table 3) with permission from ref (152). Copyright 2016 Elsevier.
Figure 12
Figure 12
Comparison of the properties of bulk versus nanobiochar (synthesized by centrifugation fractions of bulk samples) i.e., (a) surface area, (b) O/C ratio, (c) H/C ratio, (d) zeta potential, (e) pH, and (f) ash content. All information related to the feedstock, precursor pyrolysis temperature, nanobiochar preparation conditions, and sample numbers on x-axis are given in Table 3. Data obtained (Table 3) with permission from refs (67, 153). Copyright 2019 and 2019 Elsevier, respectively. Data obtained (Table 3) with permission from ref (68). Copyright 2020 American Chemical Society.
Figure 13
Figure 13
Comparative evaluation of Langmuir and Freundlich regression coefficients obtained for different aqueous contaminants on nanobiochars or engineered nanobiochars. (A) Iron oxide permeated rice husk; (B) Thiol-poplar wood; (C) Iron loaded wheat straw; (D) Thiol-poplar wood; (E) Pyrite-pine wood; (F) Iron oxide-Hickory chips; (G) Bagasse; (H) Corn stalks; (I1–3) Cow bone at 300 °C (I4–6) 450 °C (I7–9) 600 °C; (J1–2) Bagasse; (K1–2) Iron loaded-Hickory chips; (L) Pine wood; (M1–3) Wheat straw; (N1–2) Hickory chips; (O) Wheat straw nanobiochar prepared by ball milling. (P1–3) Bagasse at 400 °C (P4–6) 600 °C (P7–9) 800 °C; (Q) Dendro nanobiochar prepared by centrifugation. (R1–2) Surface engineered-agro plant nanobiochar prepared by hydrothermal. Data obtained with permission from refs (58, 78, 6, 135, 170, 172, 102, 190, 103, 76, 111, 57, 14, 191, 192, 59, 182). Copyright 2019, 2020, 2020, 2019, 2021, 2021, 2018, 2023, 2020, 2018, 2021, 2019, 2020, 2020, 2018, 2020, 2022 Elsevier, respectively.
Figure 14
Figure 14
Comparative evaluation of Pseudo-first order and Pseudo-second order regression coefficients obtained for different aqueous contaminants on nanobiochars or engineered nanobiochars. (A1–5) Iron oxide permeated rice husk; (B) Thiol-poplar wood; (C) Iron loaded wheat straw; (D) Iron oxide-Hickory chips; (E) wheat straw; (F) Bagasse; (G) Corn stalks; (H1–3) Cow bone at 300 °C (H4–6) 450 °C (H7–9) 600 °C; (I1–2) Iron loaded-Hickory chips; (J) Hickory chips; (K) Pine wood; (L1–3) Wheat straw; (M1–2) Hickory chips; (N1–3) Bagasse nanobiochar prepared by centrifugation. (O1–6) Surface engineered-agro plant [Cu:20–120 mg/L], (O7–12) [Pb:20–120 mg/L] nanobiochar prepared by hydrothermal method. (P) Mg-modified corn stalk nanobiochar prepared by sonication. Data obtained with permission from refs (58, 78, 6, 172, 102, 190, 103, 111, 117, 57, 14, 191, 192, 182, 119). Copyright 2019, 2020, 2020, 2021, 2018, 2023, 2020, 2021, 2022, 2019, 2020, 2020, 2018, 2022, 2023 Elsevier, respectively.
Figure 15
Figure 15
Nanobiochar selection protocol for aqueous contaminant removal. Table adapted and modified with permission from ref (148). Copyright 2019 American Chemical Society.
Figure 16
Figure 16
Diverse applications of nanobiochar: unveiling versatility and potential.

References

    1. Ahmad M.; Rajapaksha A. U.; Lim J. E.; Zhang M.; Bolan N.; Mohan D.; Vithanage M.; Lee S. S.; Ok Y. S. Biochar as a sorbent for contaminant management in soil and water: A review. Chemosphere 2014, 99, 19–33. 10.1016/j.chemosphere.2013.10.071. - DOI - PubMed
    1. Mohan D.; Abhishek K.; Sarswat A.; Patel M.; Singh P.; Pittman C. U. Jr Biochar production and applications in soil fertility and carbon sequestration - a sustainable solution to crop-residue burning in India. RSC Adv. 2018, 8 (1), 508–520. 10.1039/C7RA10353K. - DOI
    1. Mohan D.; Pittman C. U. Jr.; Mlsna T. E.. Sustainable Biochar for Water and Wastewater Treatment; Elsevier Science, 2022.
    1. Patel M.; Chaubey A. K.; Navarathna C.; Mlsna T. E.; Pittman C. U.; Mohan D.. Chapter 11 - Sorptive removal of pharmaceuticals using sustainable biochars. In Sustainable Biochar for Water and Wastewater Treatment; Mohan D., Pittman C. U. Jr.; Mlsna T. E., Eds.; Elsevier, 2022; pp 395–427.
    1. Patel M.; Chaubey A. K.; Pittman C. U. Jr; Mohan D. Aqueous ibuprofen sorption by using activated walnut shell biochar: process optimization and cost estimation. Environmental Science: Advances 2022, 1 (4), 530–545. 10.1039/D2VA00015F. - DOI

LinkOut - more resources