

Effects of dietary chlorogenic acid on cecal microbiota and metabolites in broilers during lipopolysaccharide-induced immune stress
- PMID: 38525083
- PMCID: PMC10957784
- DOI: 10.3389/fmicb.2024.1347053
Effects of dietary chlorogenic acid on cecal microbiota and metabolites in broilers during lipopolysaccharide-induced immune stress
Abstract
Aims: The aim of this study was to investigate the effects of chlorogenic acid (CGA) on the intestinal microorganisms and metabolites in broilers during lipopolysaccharide (LPS)-induced immune stress.
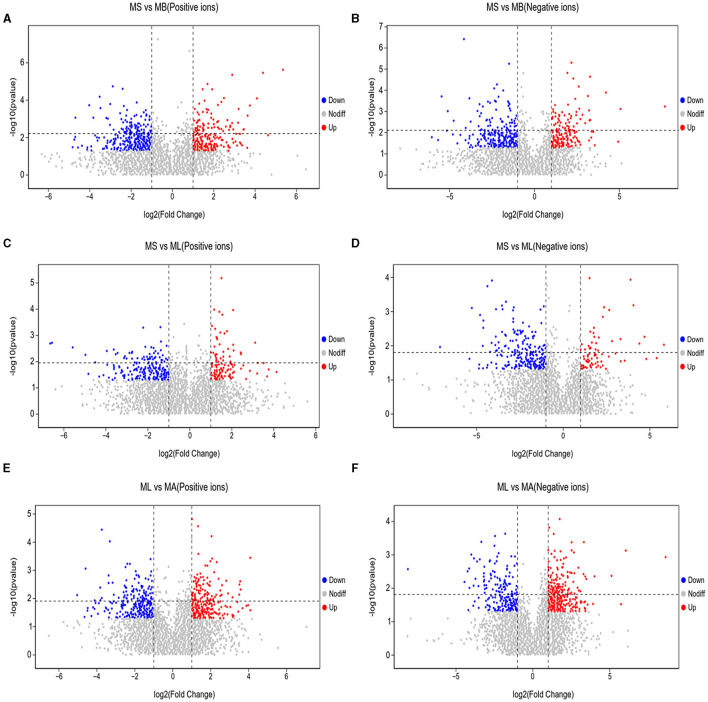
Methods: A total of 312 one-day-old Arbor Acres (AA) broilers were randomly allocated to four groups with six replicates per group and 13 broilers per replicate: (1) MS group (injected with saline and fed the basal diet); (2) ML group (injected with 0.5 mg LPS/kg and fed the basal diet); (3) MA group (injected with 0.5 mg LPS/kg and fed the basal diet supplemented with 1,000 mg/kg CGA); and (4) MB group (injected with saline and fed the basal diet supplemented with 1,000 mg/kg CGA).
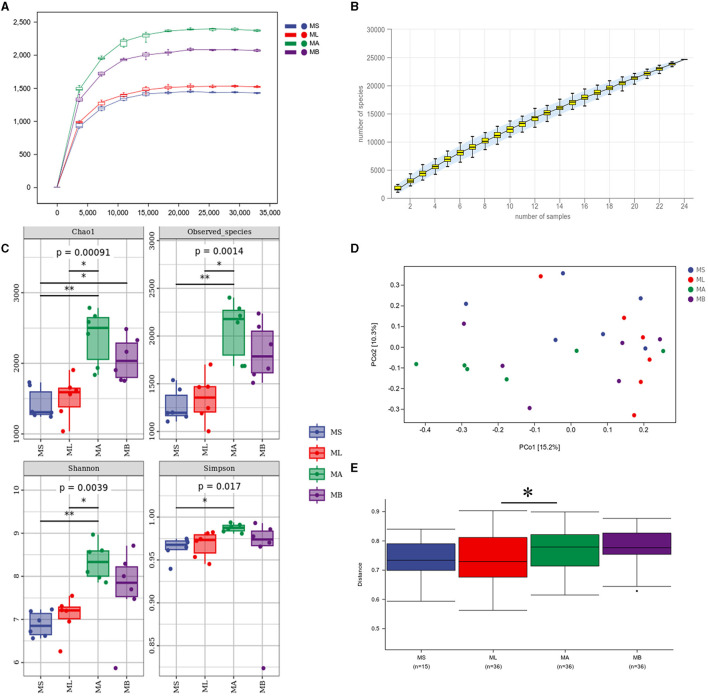
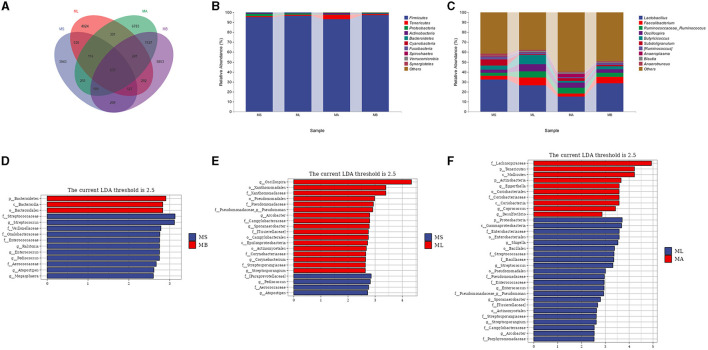
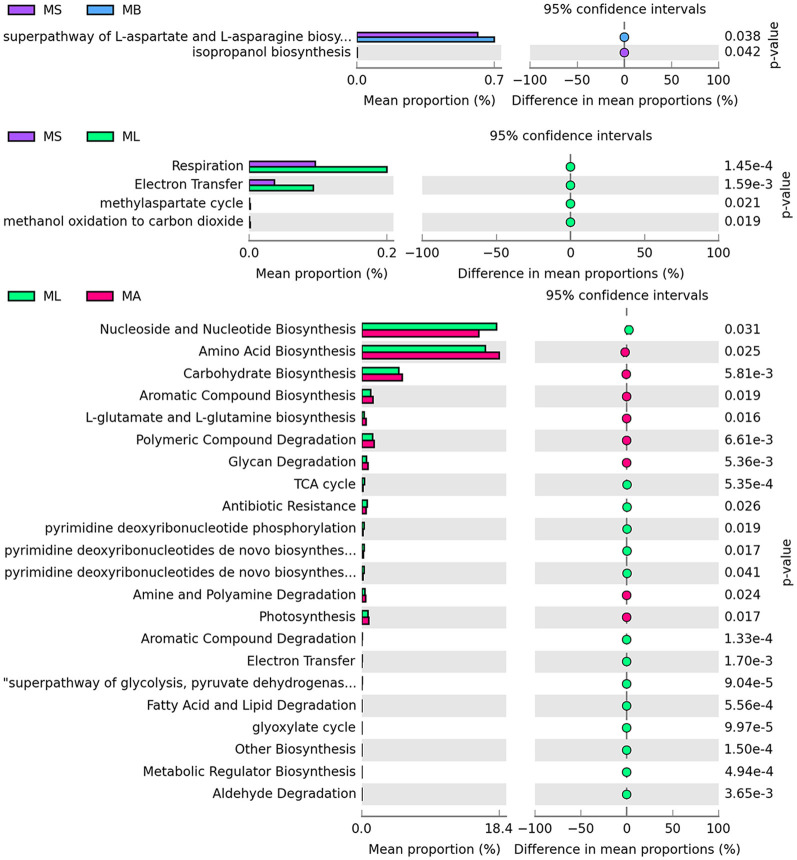
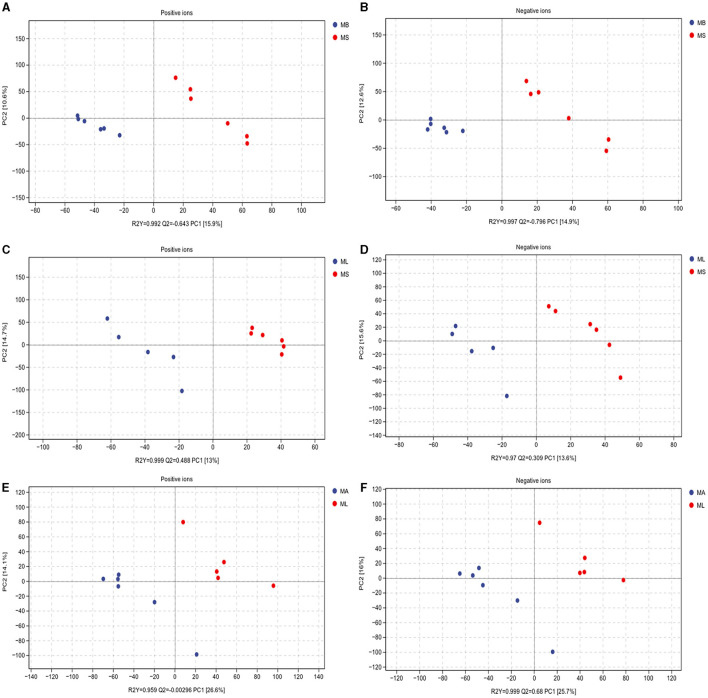
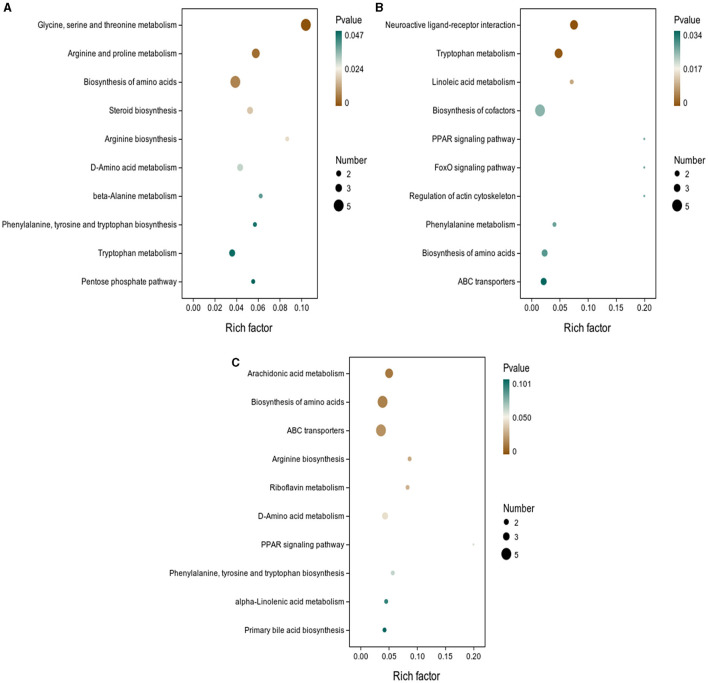
Results: The results showed that the abundance of beneficial bacteria such as Bacteroidetes in the MB group was significantly higher than that in MS group, while the abundance of pathogenic bacteria such as Streptococcaceae was significantly decreased in the MB group. The addition of CGA significantly inhibited the increase of the abundance of harmful bacteria such as Streptococcaceae, Proteobacteria and Pseudomonas caused by LPS stress. The population of butyric acid-producing bacteria such as Lachnospiraceae and Coprococcus and beneficial bacteria such as Coriobacteriaceae in the MA group increased significantly. Non-targeted metabonomic analysis showed that LPS stress significantly upregulated the 12-keto-tetrahydroleukotriene B4, riboflavin and mannitol. Indole-3-acetate, xanthurenic acid, L-formylkynurenine, pyrrole-2-carboxylic acid and L-glutamic acid were significantly down-regulated, indicating that LPS activated inflammation and oxidation in broilers, resulting in intestinal barrier damage. The addition of CGA to the diet of LPS-stimulated broilers significantly decreased 12-keto-tetrahydro-leukotriene B4 and leukotriene F4 in arachidonic acid metabolism and riboflavin and mannitol in ABC transporters, and significantly increased N-acetyl-L-glutamate 5-semialdehyde in the biosynthesis of amino acids and arginine, The presence of pyrrole-2-carboxylic acid in D-amino acid metabolism and the cecal metabolites, indolelactic acid, xanthurenic acid and L-kynurenine, indicated that CGA could reduce the inflammatory response induced by immune stress, enhance intestinal barrier function, and boost antioxidant capacity.
Conclusion: We conclude that CGA can have a beneficial effect on broilers by positively altering the balance of intestinal microorganisms and their metabolites to inhibit intestinal inflammation and barrier damage caused by immune stress.
Keywords: broilers; chlorogenic acid; gut metabolites; gut microbiota; immune stress.
Copyright © 2024 Hu, Zhen, Bai, Zhong, Zhang, Zhang, Zhang, Ito, Zhang and Ma.
Conflict of interest statement
The authors declare that the research was conducted in the absence of any commercial or financial relationships that could be construed as a potential conflict of interest.
Figures
Similar articles
-
Chlorogenic acid alters ileal microbiota and metabolites in broiler chickens under immune stress.Microbiol Spectr. 2025 Aug 5;13(8):e0331224. doi: 10.1128/spectrum.03312-24. Epub 2025 Jun 12. Microbiol Spectr. 2025. PMID: 40503877 Free PMC article.
-
Effects of dietary chlorogenic acid on intestinal barrier function and the inflammatory response in broilers during lipopolysaccharide-induced immune stress.Poult Sci. 2023 May;102(5):102623. doi: 10.1016/j.psj.2023.102623. Epub 2023 Mar 4. Poult Sci. 2023. PMID: 36972676 Free PMC article.
-
Chlorogenic acid ameliorates intestinal inflammation by inhibiting NF-κB and endoplasmic reticulum stress in lipopolysaccharide-challenged broilers.Poult Sci. 2024 May;103(5):103586. doi: 10.1016/j.psj.2024.103586. Epub 2024 Feb 24. Poult Sci. 2024. PMID: 38442474 Free PMC article.
-
Effect of Dietary Chlorogenic Acid on Growth Performance, Antioxidant Function, and Immune Response of Broiler Breeders under Immune Stress and Stocking Density Stress.Vet Sci. 2022 Oct 21;9(10):582. doi: 10.3390/vetsci9100582. Vet Sci. 2022. PMID: 36288195 Free PMC article.
-
Aspirin eugenol ester affects ileal barrier function, inflammatory response and microbiota in broilers under lipopolysaccharide-induced immune stress conditions.Front Vet Sci. 2024 May 30;11:1401909. doi: 10.3389/fvets.2024.1401909. eCollection 2024. Front Vet Sci. 2024. PMID: 38872795 Free PMC article.
Cited by
-
Altered cognitive function in obese patients: relationship to gut flora.Mol Cell Biochem. 2025 Jun;480(6):3553-3567. doi: 10.1007/s11010-024-05201-y. Epub 2025 Feb 12. Mol Cell Biochem. 2025. PMID: 39937394 Free PMC article. Review.
-
Altered fecal microbial and metabolic profiles reveal potential mechanisms underlying anemia in patients with chronic renal failure.Microbiol Spectr. 2025 Aug 5;13(8):e0316624. doi: 10.1128/spectrum.03166-24. Epub 2025 Jun 17. Microbiol Spectr. 2025. PMID: 40525868 Free PMC article.
-
Impact of gut microbiota in chronic kidney disease: natural polyphenols as beneficial regulators.Ren Fail. 2025 Dec;47(1):2506810. doi: 10.1080/0886022X.2025.2506810. Epub 2025 May 29. Ren Fail. 2025. PMID: 40441674 Free PMC article. Review.
-
Cordyceps militaris extract and cordycepin ameliorate LPS-challenged colonic damage in piglets by modulating the microbiota and metabolite profiles.Front Immunol. 2025 Mar 10;16:1530098. doi: 10.3389/fimmu.2025.1530098. eCollection 2025. Front Immunol. 2025. PMID: 40129987 Free PMC article.
-
Optimizing low-protein diets with edible dock powder: Integrated effects on growth performance, slaughter quality, Organ weights, Muscle quality, and Cecal microbiota in growing Sanhua geese.Poult Sci. 2024 Dec;103(12):104476. doi: 10.1016/j.psj.2024.104476. Epub 2024 Oct 31. Poult Sci. 2024. PMID: 39504825 Free PMC article.
References
-
- Banwell M. G., Hamel E., Hockless D. C., Verdier-Pinard P., Willis A. C., Wong D. J., et al. . (2006). 4,5-Diaryl-1h-pyrrole-2-carboxylates as combretastatin a-4/Lamellarin T hybrids: synthesis and evaluation as anti-mitotic and cytotoxic agents. Bioorg. Med. Chem. 14, 4627–4638. 10.1016/j.bmc.2006.02.018 - DOI - PubMed
LinkOut - more resources
Full Text Sources
Research Materials
Miscellaneous