. 2024 Mar 8:15:1358312.
doi: 10.3389/fpls.2024.1358312. eCollection 2024.

Aethionema arabicum dimorphic seed trait resetting during transition to seedlings

Affiliations

Aethionema arabicum dimorphic seed trait resetting during transition to seedlings

Waheed Arshad et al. Front Plant Sci. .

Abstract

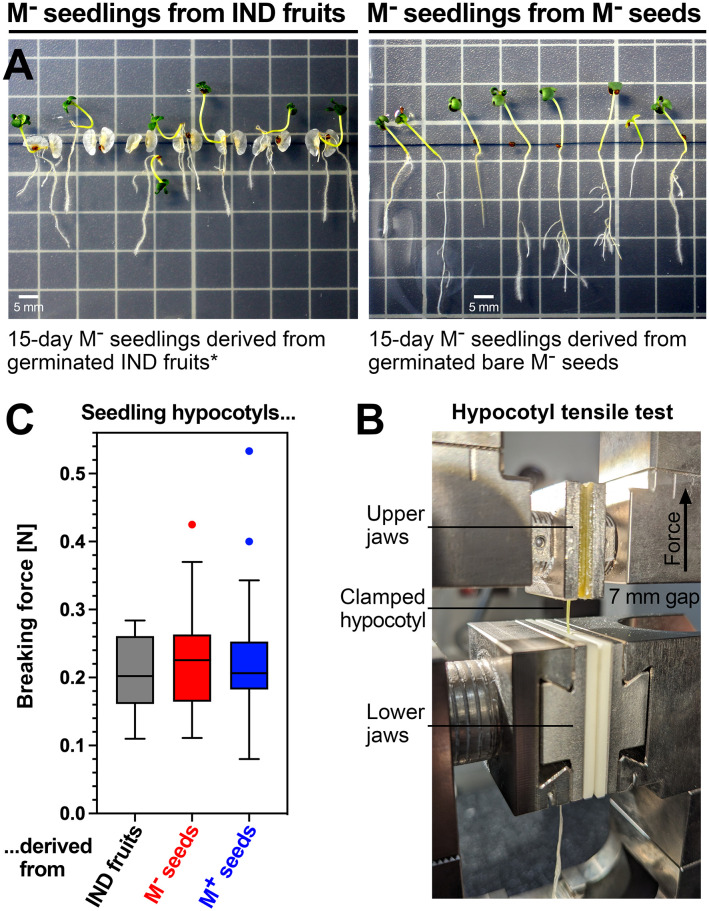
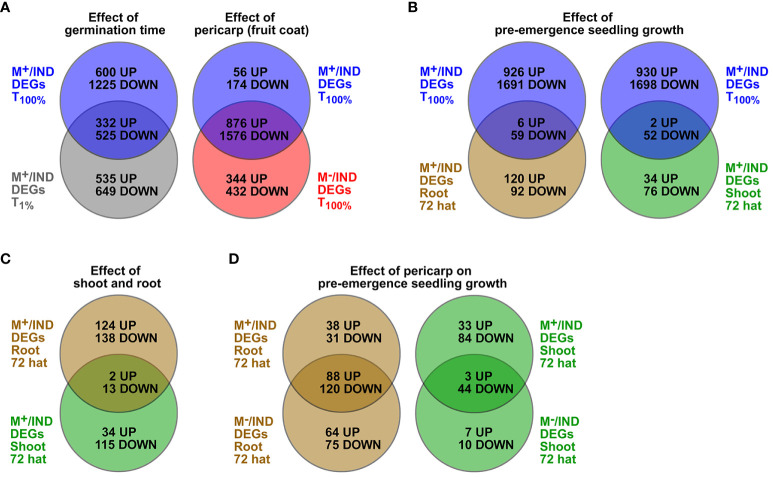
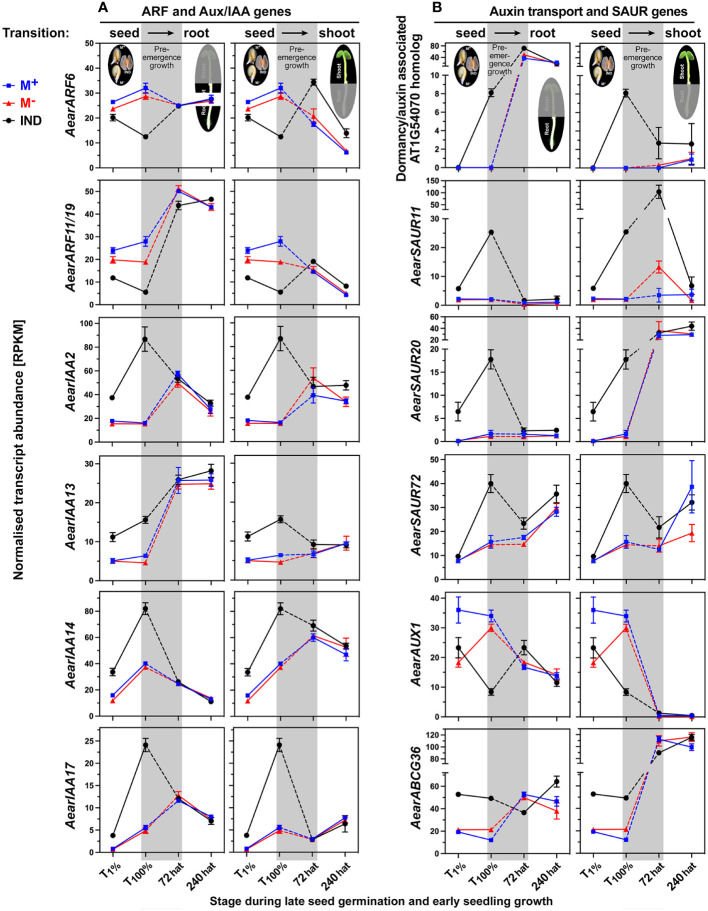
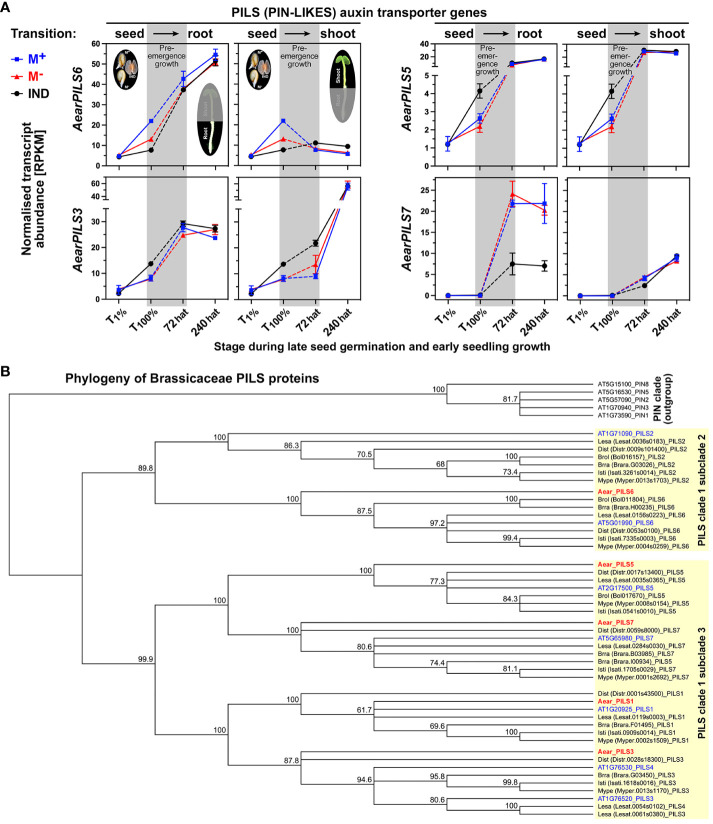
The transition from germinating seeds to emerging seedlings is one of the most vulnerable plant life cycle stages. Heteromorphic diaspores (seed and fruit dispersal units) are an adaptive bet-hedging strategy to cope with spatiotemporally variable environments. While the roles and mechanisms of seedling traits have been studied in monomorphic species, which produce one type of diaspore, very little is known about seedlings in heteromorphic species. Using the dimorphic diaspore model Aethionema arabicum (Brassicaceae), we identified contrasting mechanisms in the germination responses to different temperatures of the mucilaginous seeds (M+ seed morphs), the dispersed indehiscent fruits (IND fruit morphs), and the bare non-mucilaginous M- seeds obtained from IND fruits by pericarp (fruit coat) removal. What follows the completion of germination is the pre-emergence seedling growth phase, which we investigated by comparative growth assays of early seedlings derived from the M+ seeds, bare M- seeds, and IND fruits. The dimorphic seedlings derived from M+ and M- seeds did not differ in their responses to ambient temperature and water potential. The phenotype of seedlings derived from IND fruits differed in that they had bent hypocotyls and their shoot and root growth was slower, but the biomechanical hypocotyl properties of 15-day-old seedlings did not differ between seedlings derived from germinated M+ seeds, M- seeds, or IND fruits. Comparison of the transcriptomes of the natural dimorphic diaspores, M+ seeds and IND fruits, identified 2,682 differentially expressed genes (DEGs) during late germination. During the subsequent 3 days of seedling pre-emergence growth, the number of DEGs was reduced 10-fold to 277 root DEGs and 16-fold to 164 shoot DEGs. Among the DEGs in early seedlings were hormonal regulators, in particular for auxin, ethylene, and gibberellins. Furthermore, DEGs were identified for water and ion transporters, nitrate transporter and assimilation enzymes, and cell wall remodeling protein genes encoding enzymes targeting xyloglucan and pectin. We conclude that the transcriptomes of seedlings derived from the dimorphic diaspores, M+ seeds and IND fruits, undergo transcriptional resetting during the post-germination pre-emergence growth transition phase from germinated diaspores to growing seedlings.

Keywords: bet-hedging strategy; diaspore dimorphism; fruit and seed heteromorphism; pericarp-imposed dormancy; pre-emergence growth; seed seedling transition; seedling stress resilience; transcriptome resetting.


Conflict of interest statement

The authors declare that the research was conducted in the absence of any commercial or financial relationships that could be construed as a potential conflict of interest.

Figures

Figure 1
Figure 1
Annual life cycle of the dimorphic diaspore model Aethionema arabicum. (A) Dimorphic fruit and seed development and dispersal of the M+ seed and IND fruit diaspores. (B) Germination of the M+ seed diaspore. (C) Germination of the IND fruit diaspore. (D) Seedling growth of M+ and M seedlings derived from the M+ and M seeds, respectively. Resetting of the dimorphism during pre-emergence growth leads to adult plants that are indistinguishable regarding their M+ or IND origin. These plants restart producing dimorphic diaspores during reproduction. Rearranged and redrawn using parts from Arshad et al. (2019).
Figure 2
Figure 2
The effect of a range of constant temperatures on the growth of Aethionema arabicum M+ and M seedlings. (A) M+ and M seedlings were grown on vertical agar plates at constant temperatures as indicated. Seedling growth was scored over time starting at 0 hat (hours after transfer). The mean ± SEM (N = 3 plates, each with seven seedlings) of seedling growth rates over time and seedling lengths at 72 and 240 hat are presented; for further details, see Supplementary Figure 2 . ANOVA of growth rates revealed that morph had no effect overall at 14°C (p = 0.114), 24°C (p = 0.089), 30°C (p = 0.959), or 35°C (p = 0.217), while at 20°C (p = 0.027), M+ seedlings grew at a faster rate than M seedlings. Statistical analysis (unpaired t-test) of day 10 M+ and M seedlings demonstrated that the slightly different lengths between M+ and M seedlings were significant (*) at 14°C (M seedlings slightly longer, p = 0.012), 20°C (M seedlings slightly shorter, p = 0.049), and 24°C (M seedlings slightly shorter, p = 0.040), while no significant length difference was obtained at 30°C and 35°C. (B) Temperature dependence of seedling growth rate and seedling length at 72 and 240 hat. The optimal seedling growth temperature (30°C) is indicated. ANOVA of 72 and 240-hat seedling growth rates and seedling length across the entire temperature range revealed no significant differences between the morphs (M+ versus M). (C) M+ and M seedlings were grown on vertical agar plates in continuous white light (170 µmol·m−2·s−1). Seedling growth assays were conducted with seedlings derived from germinated M+ and M seeds, which were selected for transfer to agar plates containing media based on 1-mm protrusion of the radicle (0 hat).
Figure 3
Figure 3
Diaspore germination and seedling growth phases for the comparative transcriptome analysis. (A) Overall experimental design for comparative RNA-seq analysis of diaspore germination and seedling establishment. Time points were selected during completion of germination (T1% and T100%; times of these are indicated), early [72 hat (hours after transfer)], and late (240 hat) seedling growth. Within-root and within-shoot tissue pairwise comparisons were based on the effect of the seed morph (M+ seed vs. bare M seed), the effect of the pericarp (M seed vs. IND fruit), and the ecological dispersal unit (M+ seed vs. IND fruit). (B) Key events and phases of seedling growth at the optimal temperature (30°C) and time course analysis of chlorophyll accumulation during cotyledon greening. Error bars = ± 1 SEM. N = 3, each with 10 replicate seedlings.
Figure 4
Figure 4
Comparative biomechanical analysis of Aethionema arabicum seedlings derived from M+ seeds, M seeds, and IND fruits. (A) Fifteen-day-old seedlings from germinated (0 hat) IND fruits (left panel) and bare M seeds (right panel). * IND pericarps of germinated fruits (at 0 hat) were manually split open to aid seedling growth. Note that seedlings derived from IND fruits often had bent lower hypocotyls and, in general, grew slower compared to seedlings derived from M seeds, which had straight hypocotyls. (B) Hypocotyl tensile test. (C) Hypocotyl breaking forces of 15-day-old seedlings derived from IND fruits, bare M seeds, and M+ seeds. Box plots with Tukey’s whiskers of hypocotyl breaking forces are presented from force-displacement data obtained using N = 42 (M+), N = 38 (M), and N = 15 (IND) seedlings. The hypocotyls show no significant difference in their breaking force.
Figure 5
Figure 5
Principal component analysis (PCA) of Aethionema arabicum seed and seedling RNA-seq samples. (A) PCA of RNA-seq samples obtained during M+ seed, M seed, and IND fruit germination and seedling establishment. Colors indicate morph, while symbols indicate seed, root, or shoot tissue at 1% germination (T1%), 100% germination (T100%), or 72 or 240 hours after transfer (hat) to seedling growth plates. (B) PCA of RNA-seq samples during diaspore germination. (C) PCA of RNA-seq samples during seedling root growth at 72 and 240 hat. (D) PCA of RNA-seq samples during seedling shoot growth at 72 and 240 hat.
Figure 6
Figure 6
Number of differentially expressed genes (DEGs) identified during the developmental transition from germination to seedling establishment of Aethionema arabicum. Total number of DEGs detected during the developmental transition from germination to seedling establishment. Shown are DEGs upregulated (↑) and downregulated (↓) based on pairwise comparisons of (A) M+ seed vs. M seed (M+/M), (B) M+ seed vs. IND fruit (M+/IND), and (C) M seed vs. IND fruit (M+/IND). In all comparisons, the second treatment type was the baseline to which the first treatment was compared as transcript abundance ratio, i.e., M+/M, M+/IND, and M/IND. The dashed line indicates a hypothetical trajectory of DEGs for the corresponding tissues. DEG detection was performed using the pipeline-adjusted p-value cutoff set to 0.001 as previously described by Wilhelmsson et al. (2019). Symbols indicate seed, root, or shoot tissue at 1% germination (T1%), 100% germination (T100%), or 72 or 240 hours after transfer (hat) to seedling growth plates. For further details, see Supplementary Table 1 and Supplementary Dataset 1 .
Figure 7
Figure 7
Comparative analysis of Aethionema arabicum differentially expressed gene (DEG) lists presented as Venn diagrams. (A) Effects of germination time and pericarp as comparisons of the list of M+/IND DEGs at T100% (blue circle) to either M+/IND at T1% (grey circle) or M/IND at T100% (red circle). (B) Effect of pre-emergence growth by comparisons of the list of M+/IND DEGs at T100% (blue circle) M+/IND 72-hat DEG lists of roots (brown circle) or shoots (green circle). (C) Effect of shoot and root. (D) Effect of pericarp on pre-emergence seedling growth by comparing M+/IND 72-hat DEG lists with M/IND 72-hat DEG lists for roots (brown circle) and shoots (green circle). Seed, root, or shoot tissue at 1% germination (T1%), 100% germination (T100%), or 72 or 240 hours after transfer (hat) to seedling growth plates was compared. For gene lists of overlapping and unique DEGs, see Supplementary Dataset 1 .
Figure 8
Figure 8
Gene Ontology (GO) term enrichment in differentially expressed gene (DEG) lists. GO terms were selected and assigned categories, and enrichment scores [log(1/p-value)] were clustered hierarchically by 1-Pearson correlation using Morpheus (https://software.broadinstitute.org/morpheus/). GO terms representative of each cluster are shown here, with all selected GO terms shown in Supplementary Figure 4 , and full GO term enrichment p-values for all DEG lists can be found in Supplementary Dataset 2 . Blue indicates non-significantly enriched values (p > 0.05), with white representing the significant cutoff (p = 0.05) and red indicating where GO terms are significantly enriched in the DEG lists (p < 0.05), saturated at p = 0.001. Hierarchical clustering was redone with selected GO terms, and the original cluster was based on dendrogram cut Supplementary Figure 4 as indicated.
Figure 9
Figure 9
Comparative spatiotemporal analysis of transcript abundance patterns of selected Aethionema arabicum differentially expressed genes (DEGs). (A) Hypoxia-responsive genes. (B) Abscisic acid (ABA) and gibberellin (GA)-related genes. M+ seeds, M seeds, and IND fruits were imbibed in dH2O under darkness at 9°C, sampled, and harvested at T1% and T100%. Diaspores that had completed germination (1-mm radicle protrusion) were transferred (at 0 hat, hours after transfer) to vertical plates for the seedling growth assay at 30°C in continuous white light (for details, see Figure 2 ). RNA-seq mean ± SEM values of three biological replicates are presented, and each replicate consisted of 90 seeds or tissue (root or shoot) from 12 seedlings. The pre-emergence growth phase leading from germinated diaspores (T100%) to seedlings at 72 and 240 hours after transfer (hat) is shaded gray; seed–seedling transition RNA-seq values for roots (left panels) and shoots (right panels) are presented. AearPOC1/2 is the cumulative sum of AearPOC1 plus AearPOC2 transcript abundances. Seed, root, or shoot tissue at 1% germination (T1%), 100% germination (T100%), or 72 or 240 hours after transfer (hat) to seedling growth plates was compared. For gene abbreviations and IDs, see Supplementary Table 2 .
Figure 10
Figure 10
Comparative spatiotemporal analysis of transcript abundance patterns of auxin-related Aethionema arabicum differentially expressed genes (DEGs). (A) Auxin response factor (ARF) and auxin/indole-3-acetic acid (Aux/IAA) genes. (B) Auxin/dormancy-associated and small auxin-upregulated RNA (SAUR) genes. RNA-seq mean ± SEM values of three biological replicates are presented; for details, see Figure 9 and main text. For gene abbreviations and IDs, see Supplementary Table 2 .
Figure 11
Figure 11
Comparative spatiotemporal analysis of transcript abundance patterns and phylogeny of PILS auxin transporter genes. (A) Expression patterns of Aethionema arabicum PILS genes. RNA-seq mean ± SEM values of three biological replicates are presented; for details, see Figure 9 . (B) Phylogenetic tree of the predicted amino acid sequences of Brassicaceae PILS (PIN-FORMED-LIKES) auxin efflux carrier. Known and putative amino acid PILS sequences were aligned using ClustalW, and Neighbor-Joining trees were built as described in the Materials and Methods. Naming of PILS sequences was as follows: species as four-letter code (Brra, Brassica rapa; Brol, Brassica oleracea; Dist, Diptychocarpus strictus; Isti, Isatis tinctoria; Lesa, Lepidium sativum; Mype, Myagrum perfoliatum), gene identifier in brackets, and naming based on highest sequence similarity with the Arabidopsis thaliana PILS sequences (in blue). For Aethionema arabicum PILS gene (in red) identifier, see Supplementary Table 2 . Species selection was based on Brassicaceae phylogeny in which Aethionema is the sister to all Brassicaceae, Arabidopsis and Lepidium represent core Brassicaceae lineage I, the two Brassica species represent the lineage II Brassicaceae, and Isatis and Myagrum represent lineage II Isatideae (Franzke et al., 2011).
Figure 12
Figure 12
Comparative spatiotemporal analysis of transcript abundance patterns of Aethionema arabicum transporter and enzyme differentially expressed genes (DEGs). (A) Water and ion transporter genes. (B) Nitrate transporter and enzyme genes. RNA-seq mean ± SEM values of three biological replicates are presented; for details, see Figure 9 and main text. For gene abbreviations and IDs, see Supplementary Table 2 .
Figure 13
Figure 13
Comparative spatiotemporal analysis of transcript abundance patterns of Aethionema arabicum flavonoid biosynthesis pathway genes. (A) Flavonoid biosynthesis enzymes and the GSTF12/TT19 transporter gene for proanthocyanidin precursor molecules. RNA-seq mean ± SEM values of three biological replicates are presented; for details, see Figure 9 and main text. (B) Simplified scheme of the flavonoid biosynthesis pathway. (C) Transcriptional control of the flavonoid biosynthesis pathway by MYB-bHLH-WDR complexes. For abbreviations, see main text. For gene abbreviations and IDs, see Supplementary Table 2 .
Figure 14
Figure 14
Comparative spatiotemporal analysis of transcript abundance patterns of Aethionema arabicum differentially expressed genes (DEGs). (A) Seed–seedling transition genes. (B) NAC and WRKY transcription factor (TF) genes. RNA-seq mean ± SEM values of three biological replicates are presented; for details, see Figure 9 and main text. For gene abbreviations and IDs, see Supplementary Table 2 .
Figure 15
Figure 15
Comparative spatiotemporal analysis of transcript abundance patterns of Aethionema arabicum differentially expressed genes (DEGs) encoding cell wall remodeling proteins. (A) Expansin and xylosidase genes. (B) Xyloglucan endotransglucosylase/hydrolase (XTH) and β-galactosidase genes. RNA-seq mean ± SEM values of three biological replicates are presented; for details, see Figure 9 and main text. For gene abbreviations and IDs, see Supplementary Table 2 .

Similar articles

References

    1. Ahammed G. J., Gantait S., Mitra M., Yang Y. X., Li X. (2020). Role of ethylene crosstalk in seed germination and early seedling development: A review. Plant Physiol. Biochem. 151, 124–131. doi: 10.1016/j.plaphy.2020.03.016 - DOI - PubMed
    1. Alexa A., Rahnenfuhrer J. (2021). topGO: Enrichment analysis for Gene Ontology. R package version 2.44.0.
    1. Arjmand M. P., Lahiji H. S., Golfazani M. M., Biglouei M. H. (2023). New insights on the regulatory network of drought-responsive key genes in. Genetica 151, 29–45. doi: 10.1007/s10709-022-00177-3 - DOI - PubMed
    1. Arshad W., Lenser T., Wilhelmsson P. K. I., Chandler J. O., Steinbrecher T., Marone F., et al. . (2021). A tale of two morphs: developmental patterns and mechanisms of seed coat differentiation in the dimorphic diaspore model Aethionema arabicum (Brassicaceae). Plant J. 107, 166–181. doi: 10.1111/tpj.15283 - DOI - PubMed
    1. Arshad W., Marone F., Collinson M. E., Leubner-Metzger G., Steinbrecher T. (2020). Fracture of the dimorphic fruits of Aethionema arabicum (Brassicaceae). Botany 98, 65–75. doi: 10.1139/cjb-2019-0014 - DOI

LinkOut - more resources