

High-resolution free-breathing automated quantitative myocardial perfusion by cardiovascular magnetic resonance for the detection of functionally significant coronary artery disease
- PMID: 38525948
- PMCID: PMC11210990
- DOI: 10.1093/ehjci/jeae084
High-resolution free-breathing automated quantitative myocardial perfusion by cardiovascular magnetic resonance for the detection of functionally significant coronary artery disease
Abstract
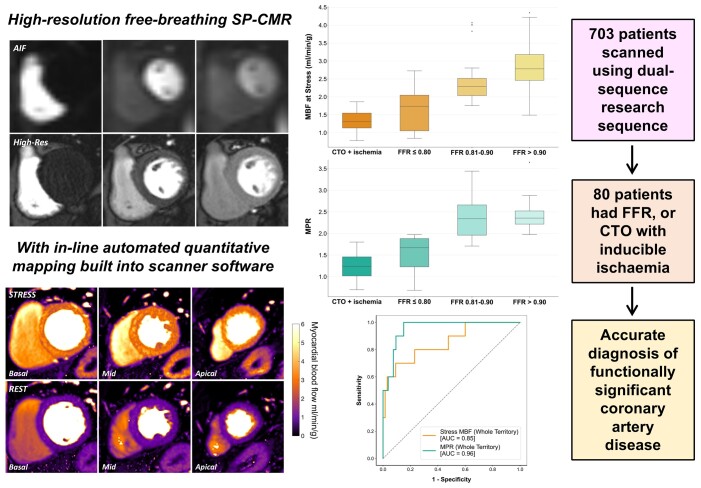
Aims: Current assessment of myocardial ischaemia from stress perfusion cardiovascular magnetic resonance (SP-CMR) largely relies on visual interpretation. This study investigated the use of high-resolution free-breathing SP-CMR with automated quantitative mapping in the diagnosis of coronary artery disease (CAD). Diagnostic performance was evaluated against invasive coronary angiography (ICA) with fractional flow reserve (FFR) measurement.
Methods and results: Seven hundred and three patients were recruited for SP-CMR using the research sequence at 3 Tesla. Of those receiving ICA within 6 months, 80 patients had either FFR measurement or identification of a chronic total occlusion (CTO) with inducible perfusion defects seen on SP-CMR. Myocardial blood flow (MBF) maps were automatically generated in-line on the scanner following image acquisition at hyperaemic stress and rest, allowing myocardial perfusion reserve (MPR) calculation. Seventy-five coronary vessels assessed by FFR and 28 vessels with CTO were evaluated at both segmental and coronary territory level. Coronary territory stress MBF and MPR were reduced in FFR-positive (≤0.80) regions [median stress MBF: 1.74 (0.90-2.17) mL/min/g; MPR: 1.67 (1.10-1.89)] compared with FFR-negative regions [stress MBF: 2.50 (2.15-2.95) mL/min/g; MPR 2.35 (2.06-2.54) P < 0.001 for both]. Stress MBF ≤ 1.94 mL/min/g and MPR ≤ 1.97 accurately detected FFR-positive CAD on a per-vessel basis (area under the curve: 0.85 and 0.96, respectively; P < 0.001 for both).
Conclusion: A novel scanner-integrated high-resolution free-breathing SP-CMR sequence with automated in-line perfusion mapping is presented which accurately detects functionally significant CAD.
Keywords: CMR; cardiovascular magnetic resonance; coronary artery disease; myocardial blood flow; myocardial perfusion; quantitative perfusion.
© The Author(s) 2024. Published by Oxford University Press on behalf of the European Society of Cardiology.
Conflict of interest statement
Conflict of interest: As well as their research roles at King’s College London, K.P.K. and S.M. are employed as part of Magnetic Resonance Research Collaborations within Siemens Healthcare Limited. All other authors have no conflicts of interest to declare.
Figures


Comment in
-
Quantitative myocardial perfusion and the power of numbers.Eur Heart J Cardiovasc Imaging. 2024 Jun 28;25(7):926-928. doi: 10.1093/ehjci/jeae108. Eur Heart J Cardiovasc Imaging. 2024. PMID: 38651339 No abstract available.
References
-
- Knuuti J, Wijns W, Saraste A, Capodanno D, Barbato E, Funck-Brentano C et al. 2019 ESC guidelines for the diagnosis and management of chronic coronary syndromes. Eur Heart J 2020;41:407–77. - PubMed
-
- Gulati M, Levy PD, Mukherjee D, Amsterdam E, Bhatt DL, Birtcher KK et al. 2021 AHA/ACC/ASE/CHEST/SAEM/SCCT/SCMR guideline for the evaluation and diagnosis of chest pain: a report of the American College of Cardiology/American Heart Association Joint Committee on Clinical Practice Guidelines. Circulation 2021;144:e368–454. - PubMed
-
- Pontone G, Andreini D, Guaricci AI, Rota C, Guglielmo M, Mushtaq S et al. The STRATEGY study (stress cardiac magnetic resonance versus computed tomography coronary angiography for the management of symptomatic revascularized patients). Circulation 2016;9:e005171. - PubMed
-
- Schwitter J, Wacker CM, Wilke N, Al-Saadi N, Sauer E, Huettle K et al. MR-IMPACT II: magnetic resonance imaging for myocardial perfusion assessment in coronary artery disease trial: perfusion-cardiac magnetic resonance vs. single-photon emission computed tomography for the detection of coronary artery disease: a comparative multicentre, multivendor trial. Eur Heart J 2013;34:775–81. - PubMed
MeSH terms
Grants and funding
LinkOut - more resources
Full Text Sources
Medical
Miscellaneous
