. 2024 Apr;28(8):e18257.
doi: 10.1111/jcmm.18257.

Huayu Qutan Recipe promotes lipophagy and cholesterol efflux through the mTORC1/TFEB/ABCA1-SCARB1 signal axis

Affiliations

Huayu Qutan Recipe promotes lipophagy and cholesterol efflux through the mTORC1/TFEB/ABCA1-SCARB1 signal axis

Yue Li et al. J Cell Mol Med. 2024 Apr.

Abstract

This study aims to investigate the mechanism of the anti-atherosclerosis effect of Huayu Qutan Recipe (HYQT) on the inhibition of foam cell formation. In vivo, the mice were randomly divided into three groups: CTRL group, MOD group and HYQT group. The HYQT group received HYQT oral administration twice a day (20.54 g/kg/d), and the plaque formation in ApoE-/- mice was observed using haematoxylin-eosin (HE) staining and oil red O (ORO) staining. The co-localization of aortic macrophages and lipid droplets (LDs) was examined using fluorescent labelling of CD11b and BODIPY fluorescence probe. In vitro, RAW 264.7 cells were exposed to 50 μg/mL ox-LDL for 48 h and then treated with HYQT for 24 h. The accumulation of LDs was evaluated using ORO and BODIPY. Cell viability was assessed using the CCK-8 assay. The co-localization of LC3b and BODIPY was detected via immunofluorescence and fluorescence probe. LysoTracker Red and BODIPY 493/503 were used as markers for lysosomes and LDs, respectively. Autophagosome formation were observed via transmission electron microscopy. The levels of LC3A/B II/LC3A/B I, p-mTOR/mTOR, p-4EBP1/4EBP1, p-P70S6K/P70S6K and TFEB protein level were examined via western blotting, while SQSTM1/p62, Beclin1, ABCA1, ABCG1 and SCARB1 were examined via qRT-PCR and western blotting. The nuclear translocation of TFEB was detected using immunofluorescence. The components of HYQT medicated serum were determined using Q-Orbitrap high-resolution MS analysis. Molecular docking was employed to identify the components of HYQT medicated serum responsible for the mTOR signalling pathway. The mechanism of taurine was illustrated. HYQT has a remarkable effect on atherosclerotic plaque formation and blood lipid level in ApoE-/- mice. HYQT decreased the co-localization of CD11b and BODIPY. HYQT (10% medicated serum) reduced the LDs accumulation in RAW 264.7 cells. HYQT and RAPA (rapamycin, a mTOR inhibitor) could promote cholesterol efflux, while chloroquine (CQ, an autophagy inhibitor) weakened the effect of HYQT. Moreover, MHY1485 (a mTOR agonist) also mitigated the effects of HYQT by reduced cholesterol efflux. qRT-PCR and WB results suggested that HYQT improved the expression of the proteins ABCA1, ABCG1 and SCARB1.HYQT regulates ABCA1 and SCARB1 protein depending on the mTORC1/TFEB signalling pathway. However, the activation of ABCG1 does not depend on this pathway. Q-Orbitrap high-resolution MS analysis results demonstrated that seven core compounds have good binding ability to the mTOR protein. Taurine may play an important role in the mechanism regulation. HYQT may reduce cardiovascular risk by promoting cholesterol efflux and degrading macrophage-derived foam cell formation. It has been observed that HYQT and ox-LDL regulate lipophagy through the mTOR/TFEB signalling pathway, rather than the mTOR/4EBP1/P70S6K pathway. Additionally, HYQT is found to regulate cholesterol efflux through the mTORC1/TFEB/ABCA1-SCARB1 signal axis, while taurine plays a significant role in lipophagy.

Keywords: autophagy; lipid metabolism; macrophage; ox‐LDL.


Conflict of interest statement

The author reports no conflicts of interest in this work.

Figures

FIGURE 1
FIGURE 1
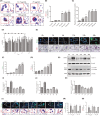
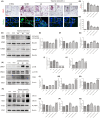
HYQT anti‐atherosclerosis. (A) HE and ORO staining in aorta (Scale bar: 100 μm, black arrow indicates lesion part); (B–E) The level of blood lipid (TC, TG, LDL‐C and HDL‐C); (F) The co‐localization of CD11b and BODIPY; (G) Transmission electron microscopy showed lysosome and autophagosome in the aorta. *P < 0.05, **P < 0.01 versus CTRL, # P < 0.05, ## P < 0.01 versus MOD. (Scale bar: 2 μm, yellow arrow indicates lysosome, red arrow indicates autophagosome).
FIGURE 2
FIGURE 2
The efficacy of HYQT on LDs accumulated. (A) For ORO, RAW 264.7 cells were treated with different concentrations of oxLDL (Scale bar: 100 μm); (B) ORO image analysis (B n = 18 per group); (C) and CE level (C n = 6 per group); (D) Cells activity with different concentrations of HYQT serum and different incubation time. The column diagrams marked by different letters were significant to each other. Values were mean ± SD (D n = 3 per group); RAW 264.7 cells were treated with ox‐LDL and HYQT, then treated with CQ for 0, 2, 6, 12, 24 and 48 h. (E) The BODIPY and ORO staining were used. (F,G) Quantitative statistics of BODIPY and ORO staining. (H) Lamp‐1 and LC3II/I protein were detected. (I) Lamp‐1 mRNA, (J) Lamp‐1 protein, (K) LC3II/I protein. (L) BODIPY and ORO stain (Scale bar: 200 μm, 100 μm); (M) BODIPY image analysis (G n = 13 per group); (N) ORO image analysis (F n = 16 per group); **P < 0.01 versus CTRL, # P < 0.05, ## P < 0.01 versus MOD, P < 0.05, △△ P < 0.01 versus HYQT. Bars represent the mean of the group ± SD (n = 5). Columns with different superscripts (a, b, c, d, and e) are significantly different (P < 0.05). CTRL: control, MOD: model, HYQT: HYQT medicated serum, HYQT‐C: control serum. CQ: treated with CQ (50 μM for 48 h), RAPA: treated with RAPA (50 nmol/L for 48 h), DMSO: treated with DMSO (0.1% DMSO for 48 h). ORO: oil Red O stain; BODIPY: fluorescent probe of lipid droplets.
FIGURE 3
FIGURE 3
HYQT promoted lipophagy, CQ decreased the efficacy of HYQT on lipophagy. (A) Transmission electron microscope detected RAW 264.7 cells (arrow points (yellow) to the lysosome and the stars (yellow) locat lipophagy); LD (red): lipid drops, (Scale bar: 1 μm); (B) Fluorescence images of BODIPY‐LC3b (B Scale bar: 50 μm); (C) Fluorescence images of BODIPY‐LysoTracker (Scale bar: 100 μm); (D) Ratio co‐co‐localization of BODIPY‐LC3b (D n = 19 per group); (E) LysoTracker fluorescence intensity (E n = 16 per group). *P < 0.05, **P < 0.01 versus CTRL, # P < 0.05, ## P < 0.01 versus MOD, P < 0.05, △△ P < 0.01 versus HYQT. LDs were stained with BODIPY (green), nuclei were stained with DAPI (blue), and lysosomes were stained with LysoTracker (red).
FIGURE 4
FIGURE 4
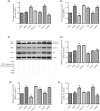
The expression of LC3II/I, Beclin1, p62 and RAPA and CQ impacted the expression of autophagy genes and proteins detected by qRT‐PCR and WB. (A) qRT‐PCR for Beclin1, and (B) p62 normalized ratios; (C) western blot for LC3, Beclin1 and p62 treated with different factors and normalized ratios (D–F). All data were presented as the mean ± SD (n = 3), *P < 0.05, **P < 0.01 versus CTRL, # P < 0.05, ## P < 0.01 versus MOD, P < 0.05, △△ P < 0.01 versus HYQT.
FIGURE 5
FIGURE 5
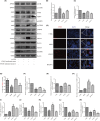
HYQT regulates the mTORC1/TFEB signalling pathway and cholesterol efflux proteins. (A) Detected the proteins expression by WB; (B) p‐mTOR/mTOR; (C) TFEB; (D) Immunofluorescence for TFEB (Scale bar: 50 μm); (E) Ratio of TFEB in nucleus (n = 12 per group). Normalized ratios of (F) p‐4EBP1/4EBP1, (G) p‐P70S6K/P70S6K, (H) ABCA1 mRNA, (I) ABCA1 protein, (J) ABCG1 mRNA, (K) ABCG1 protein, (L) SCARB1 mRNA, (M) SCARB1 protein. qRT‐PCR and WB data were presented as the mean ± SD (n = 3). *P < 0.05, **P < 0.01 versus CTRL, # P < 0.05, ## P < 0.01 versus MOD, P < 0.05, △△ P < 0.01 versus HYQT. TFEB proteins were stained with fluorescence (red), and nuclei were stained with DAPI (blue).
FIGURE 6
FIGURE 6
mTORC1/TFEB signalling pathway had an influence on lipophagy and cholesterol efflux. (A) Cholesterol levels of per cell treated with MHY1485 (A n = 15 per group, BODIPY Scale bar: 200 μm, ORO Scale bar:100 μm) and (B) analysed fluorescence intensity of BODIPY and (C) ORO pixels2; (D) Fluorescence images of BODIPY‐LC3b (Scale bar: 50 μm); (E) Fluorescence images of BODIPY and lysosome probe (Scale bar: 100 μm); (F) ratio of co‐localization of two (F n = 19 per group); (G) LysoTracker fluorescence intensity (G n = 16 per group); (H) Ratio of NBD cholesterol efflux (H n = 6 per group). (I) NBD cholesterol image treated with MHY1485 (Scale bar: 500 μm). *P < 0.05, **P < 0.01 versus HYQT. MHY1485 (100 nmol/L for 48 h). ORO: oil red O stain; BODIPY: fluorescent probe of lipid droplets intracellular cholesterol was stained with NBD 493/503 (green).
FIGURE 7
FIGURE 7
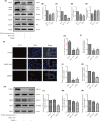
HYQT regulates lipophagy and cholesterol efflux via the mTORC1/TFEB/ABCA1‐SCARB1 signal axis. (A) TFEB, LC3II/I, Beclin1, and p62 proteins expression treated with MHY1485 and DMSO, and (B–E) normalized ratios; (F) Immunofluorescence for TFEB (Scale bar: 50 μm); (G) Ratio of TFEB in nucleus (n = 12 per group); (H) ABCA1, ABCG1 and SCARB1 proteins expression treated with MHY1485 and DMSO; (I–J) ABCA1, (K,L) ABCG1, (M,N) SCARB1 mRNAs and proteins normalized ratios. qRT‐PCR and WB data were presented as the mean ± SD (n = 3). *P < 0.05, **P < 0.01 versus HYQT. TFEB proteins were stained with fluorescence (red), and nuclei were stained with DAPI (blue).
FIGURE 8
FIGURE 8
Total‐ion chromatogram by Q‐Orbitrap high‐resolution MS analysis of HYQT medicated serum and seven compounds in HYQT medicated serum bind with mTOR protein. (A) Detected in positive ion mode (red), detected in negative ion mode (black). (B) Structure diagram of compound binding to protein.
FIGURE 9
FIGURE 9
Taurine regulates lipid accumulation and mTOR/TFEB/ABCA1‐SCARB1 signal axis. (A) Taurine inhibits lipid droplet accumulation (BODIPY Scale bar: 25 μm, ORO Scale bar: 100 μm). (B,C) Normalized ratios of BODIPY and ORO staining. (D–G) Taurine promotes LC3II/I and Lamp1 proteins. (H–J) Taurine regulates mTOR/TFEB signalling pathway. (K) Taurine regulates cholesterol efflux proteins. (L,M) ABCA1 mRNA and protein, (N,O) ABCG1 mRNA and protein, (P‐Q) SCARB1 mRNA and protein. qRT‐PCR and WB data were presented as the mean ± SD (n = 3). *P < 0.05, **P < 0.01 versus CTRL. # P < 0.05, ## P < 0.01 versus MOD, P < 0.05, ▲▲ P < 0.01 versus taurine (40 mmol/L). P < 0.05, ■■ P < 0.01 versus taurine (80 mmol/L).

References

    1. World Health Organization [homepage on the Internet] . Cardiovascular diseases (CVDs) Fact Sheet. 2017. Available from: https://www.who.int/zh/news‐room/fact‐sheets/detail/cardiovascular‐disea... Accessed Mar 19, 2023.
    1. Libby P, Buring JE, Badimon L, et al. Atherosclerosis. Nat Rev Dis Primers. 2019;5:56. doi:10.1038/s41572-019-0106-z - DOI - PubMed
    1. Poznyak AV, Bezsonov EE, Popkova TV, Starodubova AV, Orekhov AN. Immunity in atherosclerosis: focusing on T and B cells. Int J Mol Sci. 2021;22:8379. doi:10.3390/ijms22168379 - DOI - PMC - PubMed
    1. Ward NC, Watts GF, Eckel RH. Statin toxicity. Circ Res. 2019;124:328‐350. doi:10.1161/circresaha.118.312782 - DOI - PubMed
    1. Pi S, Mao L, Chen J, et al. The P2RY12 receptor promotes VSMC‐derived foam cell formation by inhibiting autophagy in advanced atherosclerosis. Autophagy. 2021;17:980‐1000. doi:10.1080/15548627.2020.1741202 - DOI - PMC - PubMed

Publication types

MeSH terms