. 2024 May 28;199(2):316-331.
doi: 10.1093/toxsci/kfae029.

Characterization of individual bile acids in vivo utilizing a novel low bile acid mouse model

Affiliations

Characterization of individual bile acids in vivo utilizing a novel low bile acid mouse model

Rulaiha Taylor et al. Toxicol Sci. .

Abstract

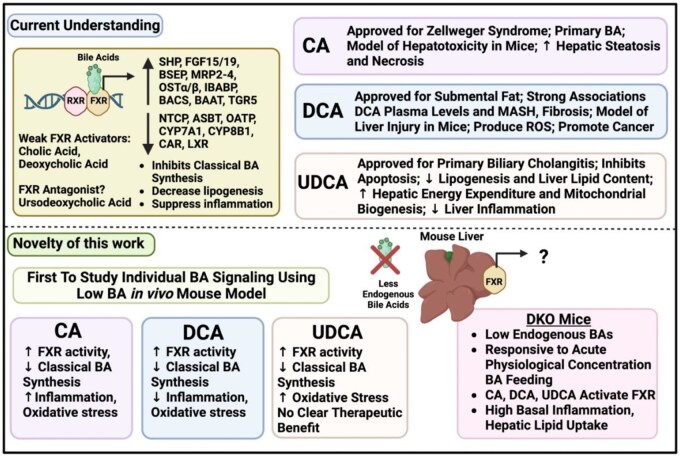
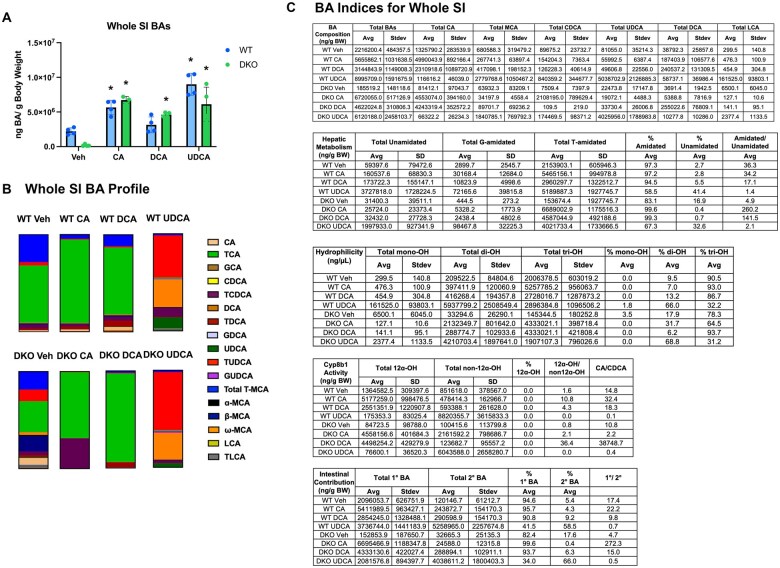
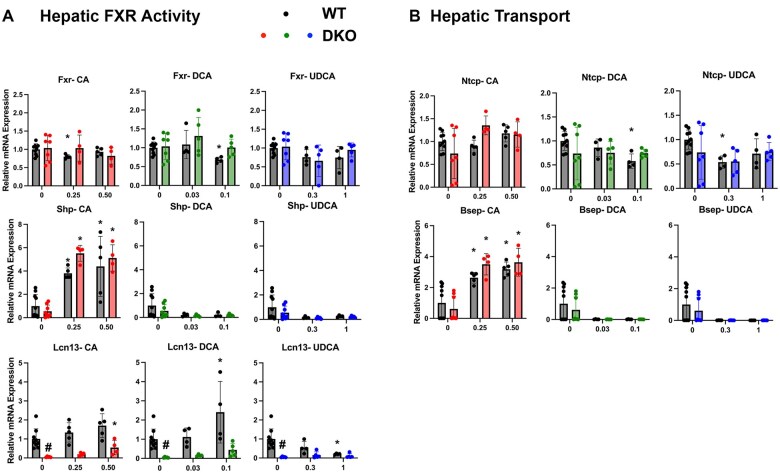
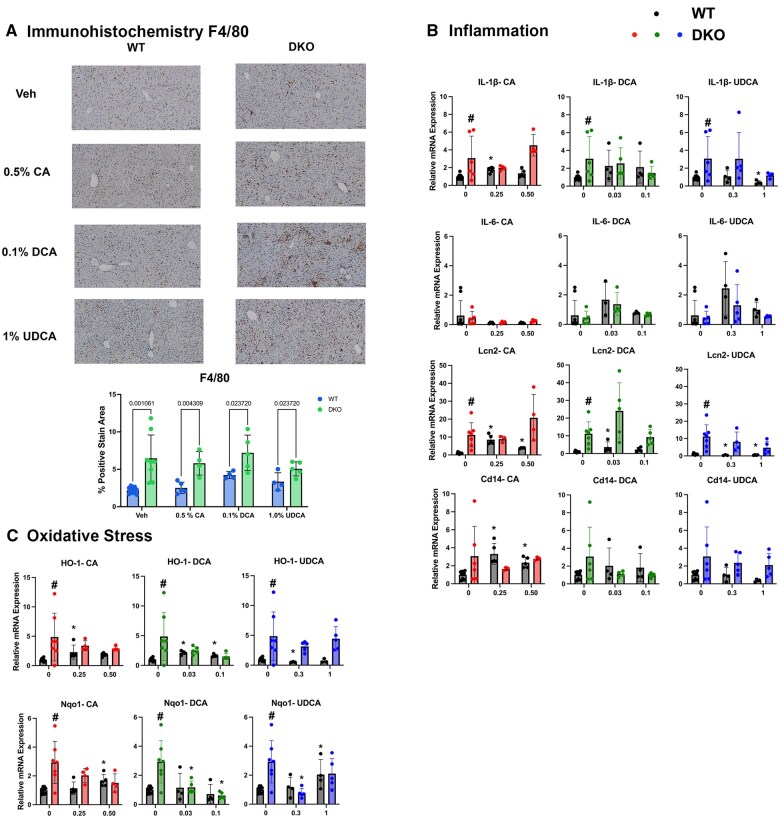
Bile acids (BAs) are signaling molecules synthesized in the liver initially by CYP7A1 and CYP27A1 in the classical and alternative pathways, respectively. BAs are essential for cholesterol clearance, intestinal absorption of lipids, and endogenous modulators of farnesoid x receptor (FXR). FXR is critical in maintaining BA homeostasis and gut-liver crosstalk. Complex reactions in vivo and the lack of suitable animal models impede our understanding of the functions of individual BAs. In this study, we characterized the in vivo effects of three-day feeding of cholic acid (CA), deoxycholic acid (DCA), or ursodeoxycholic acid (UDCA) at physiological/non-hepatotoxic concentrations in a novel low-BA mouse model (Cyp7a1-/-/Cyp27a1-/-, DKO). Liver injury, BA levels and composition and BA signaling by the FXR-fibroblast growth factor 15 (FGF15) axis were determined. Overall, higher basal inflammation and altered lipid metabolism in DKO mice might be associated with low BAs. CA, DCA, and UDCA feeding activated FXR signals with tissue specificity. Dietary CA and DCA similarly altered tissue BA profiles to be less hydrophobic, while UDCA promoted a more hydrophobic tissue BA pool with the profiles shifted toward non-12α-OH BAs and secondary BAs. However, UDCA did not offer any overt protective effects as expected. These findings allow us to determine the precise effects of individual BAs in vivo on BA-FXR signaling and overall BA homeostasis in liver physiology and pathologies.

Keywords: bile acids; liver; nuclear receptors.


Figures

Graphical Abstract
Graphical Abstract
Figure 1.
Figure 1.
Serum enzyme activities and liver histology. A, Serum enzyme activity: alanine aminotransferase (ALT), aspartate aminotransferase (AST), alkaline phosphatase (ALP), total cholesterol, triglyceride levels, liver weight-to-body weight ratio (LWBWR), and body weight percent change. B, Liver histology stained with hematoxylin eosin. Scale represents 50 μM section, imaged at 20×. WT mice are presented in black bars, DKO in color, and chemicals are presented as CA (left column/red), DCA (middle column/green), UDCA (right column/blue). A * represents significant difference between BA and vehicle treatment within same genotype, # represents significant difference compared to WT within same treatment. Data are presented as mean ± SD (n =3–7/group), analyzed using multiple unpaired t tests, with FDR (Q = 1.00%) Benjamini–Yekutieli procedure, p <.05 was considered significant. Abbreviations: BA, bile acid; CA, cholic acid; DCA, deoxycholic acid; UDCA, ursodeoxycholic acid; WT, wild type.
Figure 2.
Figure 2.
Relative mRNA quantification of genes in hepatic BA signaling. A, mRNA levels of genes encoding hepatic BA synthesis enzymes in classical (Cyp7a1, Cyp8b1) and alternative (Cyp27a1, Cyp7b1) pathways; B, BA conjugation/transformation enzymes (Cyp46a1, Cyp2a12, Amacr, Cyp2c70, Baat, Hsd17b4). WT mice are presented in black bars, DKO in color, and chemicals are presented as CA (left column/red), DCA (middle column/green), UDCA (right column/blue). A * represents significant difference between BA and vehicle treatment within same genotype, # represents significant difference compared to WT within same treatment. Data are presented as mean ± SD (n =3–7/group), analyzed using multiple unpaired t tests, with FDR (Q = 1.00%) Benjamini–Yekutieli procedure, p <.05 was considered significant. Abbreviations: BA, bile acid; CA, cholic acid; DCA, deoxycholic acid; UDCA, ursodeoxycholic acid; WT, wild type.
Figure 3.
Figure 3.
Whole SI BA concentration and composition. A, mean total BA concentration ± SD (WT mice on left and DKO mice on right); B, Percent composition of BA species in the whole SI; C, BA indices calculations for WT and DKO mice fed individual BAs, CA, DCA, and UDCA, data are displayed as ng/g body weight. A * represents significant difference between BA and vehicle treatment within same genotype, # represents significant difference compared to WT within same treatment. Data are presented as mean ± SD (n = 3–7/group), analyzed using multiple unpaired t tests, with FDR (Q = 1.00%) Benjamini–Yekutieli procedure, p < .05 was considered significant. Abbreviations: BA, bile acid; CA, cholic acid; DCA, deoxycholic acid; UDCA, ursodeoxycholic acid; WT, wild type.
Figure 4.
Figure 4.
Serum BA concentration and composition. A, mean total BA concentration ± SD (WT mice on left and DKO mice on right); B, Percent composition of BA species in serum; C, BA indices calculations for WT and DKO mice fed individual BAs, CA, DCA, and UDCA, data are displayed as ng/ml. A * represents significant difference between BA and vehicle treatment within same genotype, # represents significant difference compared to WT within same treatment. Data are presented as mean ± SD (n =3–7/group), analyzed using multiple unpaired t tests, with FDR (Q = 1.00%) Benjamini–Yekutieli procedure, p <.05 was considered significant. Abbreviations: BA, bile acid; CA, cholic acid; DCA, deoxycholic acid; UDCA, ursodeoxycholic acid; WT, wild type.
Figure 5.
Figure 5.
Liver BA concentration and composition. A, mean total BA concentration ± SD (WT mice on left and DKO mice on right); B, Percent composition of BA species in the liver; C, BA indices calculations for WT and DKO mice fed individual BAs, CA, DCA, and UDCA, data are displayed as ng/mg liver. A * represents significant difference between BA and vehicle treatment within same genotype, # represents significant difference compared to WT within same treatment. Data are presented as mean ± SD (n =3–7/group), analyzed using multiple unpaired t tests, with FDR (Q = 1.00%) Benjamini–Yekutieli procedure, p <0.05 was considered significant. Abbreviations: BA, bile acid; CA, cholic acid; DCA, deoxycholic acid; UDCA, ursodeoxycholic acid; WT, wild type.
Figure 6.
Figure 6.
Relative mRNA quantification of hepatic FXR target genes and BA transporters. A, Relative mRNA quantification of hepatic FXR target genes: Fxr, Shp, and Lcn13, B, and hepatic transporters (Ntcp and Bsep). WT mice are presented in black bars, DKO in color, and chemicals are presented as CA (left column/red), DCA (middle column/green), UDCA (right column/blue). A * represents significant difference compared to vehicle within same genotype, # represents significant difference compared to WT within same treatment. Data are presented as mean ± SD (n =3–7/group), analyzed using multiple unpaired t tests, with FDR (Q = 1.00%) Benjamini–Yekutieli procedure, p <.05 was considered significant. Abbreviations: BA, bile acid; CA, cholic acid; DCA, deoxycholic acid; UDCA, ursodeoxycholic acid; WT, wild type.
Figure 7.
Figure 7.
Relative mRNA quantification of Ileal FXR target genes and BA transporters. A, Relative mRNA quantification of ileal FXR target genes: Fgf15, Shp, and Lcn13 and Tgr5, and B, ileal transporters (Asbt, Ibabp, Osta, and Ostb). WT mice are presented in black bars, DKO in color, and chemicals are presented as CA (left column/red), DCA (middle column/green), UDCA (right column/blue). A * represents significant difference between BA and vehicle treatment within same genotype, # represents significant difference compared to WT within same treatment. Data are presented as mean ± SD (n =3–7/group), analyzed using multiple unpaired t tests, with FDR (Q = 1.00%) Benjamini–Yekutieli procedure, p <.05 was considered significant. Abbreviations: BA, bile acid; CA, cholic acid; DCA, deoxycholic acid; UDCA, ursodeoxycholic acid; WT, wild type.
Figure 8.
Figure 8.
Liver inflammation and oxidative stress. A, Representative images of liver immunohistochemistry for F4/80 and quantification of percent positive area; B, relative mRNA quantification of hepatic inflammatory genes (IL-1b, IL-6, Lcn2, and Cd14); C, relative mRNA quantification of oxidative stress genes (Ho-1, Nqo1). Scale represents 100 μM section, imaged at 10X. WT mice are presented in black bars, DKO in color, and chemicals are presented as CA (left column/red), DCA (middle column/green), UDCA (right column/blue). A * represents significant difference between BA and vehicle treatment within same genotype, # represents significant difference compared to WT within same treatment. Data are presented as mean ± SD (n =3–7/group), analyzed using multiple unpaired t tests, with FDR (Q = 1.00%) Benjamini–Yekutieli procedure, p <.05 was considered significant. Abbreviations: BA, bile acid; CA, cholic acid; DCA, deoxycholic acid; UDCA, ursodeoxycholic acid; WT, wild type.
Figure 9.
Figure 9.
Relative mRNA quantification of hepatic lipid metabolism genes. Relative mRNA quantification for hepatic lipid metabolism genes (Cd36, Fas, Srebp1c, Cyp4a10, Acss2). WT mice are presented in black bars, DKO in color, and chemicals are presented as CA (left column/red), DCA (middle column/green), UDCA (right column/blue). A * represents significant difference between BA and vehicle treatment within same genotype, # represents significant difference compared to WT within same treatment. Data are presented as mean ± SD (n =3–7/group), analyzed using multiple unpaired t tests, with FDR (Q = 1.00%) Benjamini–Yekutieli procedure, p <.05 was considered significant. Abbreviations: BA, bile acid; CA, cholic acid; DCA, deoxycholic acid; UDCA, ursodeoxycholic acid; WT, wild type.
Figure 10.
Figure 10.
RNA-seq analysis of differentially expressed genes and gene ontology for liver and ileum of naive WT and DKO mice. A, Liver top adjusted p-value differentially expressed genes (DEG); B, liver gene ontology (GO) analysis; C, ileal top adjusted p-value DEG; and D, ileal GO analysis.

Similar articles

Cited by

References

    1. Abenavoli L., Procopio A. C., Fagoonee S., Pellicano R., Carbone M., Luzza F., Invernizzi P. (2020). Primary biliary cholangitis and bile acid farnesoid x receptor agonists. Diseases 8, - PMC - PubMed
    1. Alamoudi J. A., Li W., Gautam N., Olivera M., Meza J., Mukherjee S., Alnouti Y. (2021). Bile acid indices as biomarkers for liver diseases i: Diagnostic markers. World J. Hepatol. 13, 433–455. - PMC - PubMed
    1. Allen K., Jaeschke H., Copple B. L. (2011). Bile acids induce inflammatory genes in hepatocytes: A novel mechanism of inflammation during obstructive cholestasis. Am. J. Pathol. 178, 175–186. - PMC - PubMed
    1. Barrasa J. I., Olmo N., Lizarbe M. A., Turnay J. (2013). Bile acids in the Colon, from healthy to cytotoxic molecules. Toxicol. In Vitro. 27, 964–977. - PubMed
    1. Berendse K., Klouwer F. C., Koot B. G., Kemper E. M., Ferdinandusse S., Koelfat K. V., Lenicek M., Schaap F. G., Waterham H. R., Vaz F. M., et al. (2016). Cholic acid therapy in zellweger spectrum disorders. J. Inherit. Metab. Dis. 39, 859–868. - PMC - PubMed

MeSH terms

LinkOut - more resources