. 2024 Nov 1;19(11):2499-2512.
doi: 10.4103/NRR.NRR-D-23-01863. Epub 2024 Jan 31.

Ruxolitinib improves the inflammatory microenvironment, restores glutamate homeostasis, and promotes functional recovery after spinal cord injury

Affiliations

Ruxolitinib improves the inflammatory microenvironment, restores glutamate homeostasis, and promotes functional recovery after spinal cord injury

Jiang Cao et al. Neural Regen Res. .

Abstract

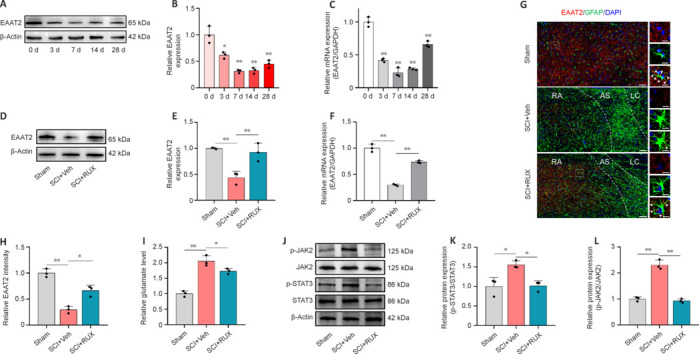
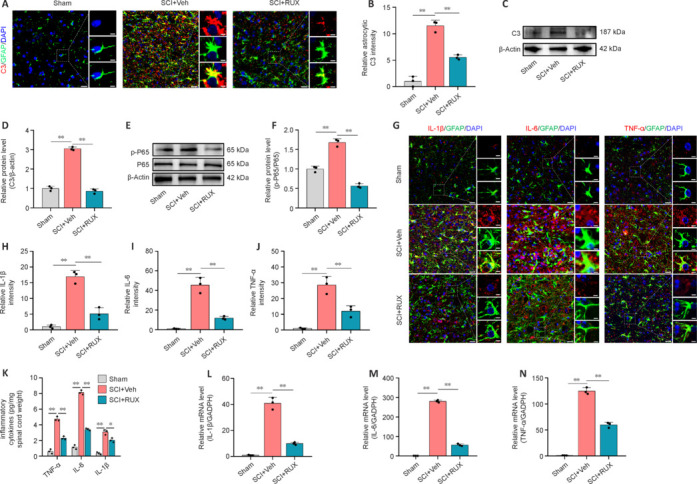
JOURNAL/nrgr/04.03/01300535-202419110-00030/figure1/v/2024-03-08T184507Z/r/image-tiff The inflammatory microenvironment and neurotoxicity can hinder neuronal regeneration and functional recovery after spinal cord injury. Ruxolitinib, a JAK-STAT inhibitor, exhibits effectiveness in autoimmune diseases, arthritis, and managing inflammatory cytokine storms. Although studies have shown the neuroprotective potential of ruxolitinib in neurological trauma, the exact mechanism by which it enhances functional recovery after spinal cord injury, particularly its effect on astrocytes, remains unclear. To address this gap, we established a mouse model of T10 spinal cord contusion and found that ruxolitinib effectively improved hindlimb motor function and reduced the area of spinal cord injury. Transcriptome sequencing analysis showed that ruxolitinib alleviated inflammation and immune response after spinal cord injury, restored EAAT2 expression, reduced glutamate levels, and alleviated excitatory toxicity. Furthermore, ruxolitinib inhibited the phosphorylation of JAK2 and STAT3 in the injured spinal cord and decreased the phosphorylation level of nuclear factor kappa-B and the expression of inflammatory factors interleukin-1β, interleukin-6, and tumor necrosis factor-α. Additionally, in glutamate-induced excitotoxicity astrocytes, ruxolitinib restored EAAT2 expression and increased glutamate uptake by inhibiting the activation of STAT3, thereby reducing glutamate-induced neurotoxicity, calcium influx, oxidative stress, and cell apoptosis, and increasing the complexity of dendritic branching. Collectively, these results indicate that ruxolitinib restores glutamate homeostasis by rescuing the expression of EAAT2 in astrocytes, reduces neurotoxicity, and effectively alleviates inflammatory and immune responses after spinal cord injury, thereby promoting functional recovery after spinal cord injury.


Conflict of interest statement

Conflicts of interest: The authors declare that they have no conflict of interest. No relevant financial activities outside the submitted, and manuscript is approved by all authors for publication.

Figures

Figure 1
Figure 1
Ruxolitinib enhances motor function recovery in a mouse model of SCI. (A) Experimental design. (B) Mice received ruxolitinib or vehicle treatment post-SCI and for 28 days. Body weight was recorded at the indicated time points (n = 3/group). (C) Footprint analysis was conducted at 28 dpi in the sham, SCI + Veh, and SCI + RUX groups. The hind limb function of SCI + Veh group was worse than that of the Sham group. The SCI+ RUX group had better hind limb function than the SCI + Veh group. Scale bar: 20 mm. (D, E) Quantification of stride length (D) and width (E) in B (n = 5). (F) Representative images of the swim test in each group. The SCI + Veh group exhibited impaired swimming ability compared with the Sham group, whereas the SCI + RUX group demonstrated improved swimming capability compared with the SCI + Veh group. (G) Quantification of swim test results by swimming scores (n = 5/group). (H) BMS scores for each group at different time points (n = 5). (I) Hematoxylin and eosin staining of the injury site at 28 dpi. Compared with the Sham group, the SCI + Veh group exhibited an increase in injury area, whereas the SCI + RUX group showed a reduction in injury area compared with the SCI + Veh group. The dashed box represents the damaged area. Scale bar: 500 µm. (J) Quantitative assessment of the injury site area in spinal cord tissue at 28 dpi (n = 5/group). (K) Representative immunofluorescence staining images for NeuN (green, Alexa Fluor 488) in spinal cord tissues at 28 dpi. The SCI + RUX group showed a higher number of surviving neurons compared with the SCI + Veh group. Scale bar: 500 µm. (L) Quantitative analysis of NeuN+ neurons within 1000 µm from the lesion center at 28 dpi (n = 5). Data are presented as the mean ± SD. *P < 0.05, **P < 0.01 (two-way analysis of variance followed by Tukey’s post hoc test (B, G, H), one-way analysis of variance followed by Tukey’s post hoc test (D, E, J) or unpaired Student’s t-test). BMS: Basso Mouse Scale; dpi: days post-injury; ELISA: enzyme-linked immunosorbent assay; HE: hematoxylin and eosin; IF: immunofluorescence; NeuN: neuronal nuclei; ns: not significant; qPCR: quantitative polymerase chain reaction; RUX: ruxolitinib; SCI: spinal cord injury; Veh: vehicle; WB: Western blot.
Figure 2
Figure 2
Identification of specific DEGs or pathways after RUX treatment of SCI. (A) Heatmap showing DEGs in the spinal cord tissues of mice among the Sham, SCI + Veh, and SCI + RUX groups. (B) Volcano plot illustrating DEGs between the SCI + Veh and SCI + RUX groups. Downregulated genes are indicated in blue, whereas upregulated genes are marked in red. (C) Gene Ontology enrichment analysis of DEGs and all genes, revealing the biological processes affected by SCI and RUX.
Figure 3
Figure 3
RUX restores the expression of EAAT2 after spinal cord injury. (A) Representative western blot of EAAT2 protein level in spinal cord tissues 28 days after injury. (B) Quantification of the protein expression of EAAT2. (C) EAAT2 mRNA expression in spinal cord tissues 28 days after injury. (D) Representative images of western blotting of EAAT2 in each group at 7 dpi. (E) Quantitative assessment of EAAT2 protein expression. (F) EAAT2 mRNA expression in each group at 7 dpi. (G, H) Representative figures and quantitative assessment of immunofluorescence staining for EAAT2 (red, Alexa Fluor 594), GFAP (green, Alexa Fluor 488), and DAPI (blue) in reactive astrocytes in each group at 7 dpi. In reactive astrocytes, the fluorescence intensity of EAAT2 in the SCI + Veh group was lower compared with the Sham group, whereas EAAT2 expression was increased in the SCI + RUX group compared with the SCI + Veh group. The arrow indicates the expression of EAAT2 in the processes of astrocytes. Scale bar: 10 µm. (I) Measurement of glutamate levels in injured tissues in each group at 7 dpi (n = 3). (J) Representative western blot of p-JAK2, JAK2, p-STAT3, and STAT3 in each group at 7 dpi. (K, L) Quantification of p-JAK2/JAK2 and p-STAT3/STAT3 levels in each group. In B, C, E, F, H, I, K, and L, data were normalized by the sham group. Data are presented as the mean ± SD. The experiments were performed in triplicate. *P < 0.05, **P < 0.01 (one-way analysis of variance followed by Tukey’s post hoc test). AS: Scar-forming reactive astrocytes; DAPI: 4′,6-diamidino-2-phenylindole; dpi: days post-injury; EAAT2: excitatory amino acid transporter 2; GAPDH: glyceraldehyde 3-phosphate dehydrogenase; GFAP: glial fibrillary acidic protein; JAK2: Janus kinase 2; NA: naïve astrocytes; ns: not significant; p-JAK2: phosphorylated Janus kinase 2; p-STAT3: phosphorylated signal transducer and activator of transcription 3; RA: reactive astrocytes; RUX: ruxolitinib; SCI: spinal cord injury; STAT3: signal transducer and activator of transcription 3; Veh: vehicle.
Figure 4
Figure 4
RUX inhibits the activation and inflammatory responses of neurotoxic astrocytes after spinal cord injury in vivo. (A, B) Representative images and quantification of C3 (red, Alexa Fluor 594), GFAP (green, Alexa Fluor 488), and DAPI (blue) immunofluorescence staining in Sham, SCI + Veh, and SCI + RUX groups at 7 dpi. The SCI + Veh group showed increased C3 fluorescence compared with the Sham group, whereas the SCI + RUX group displayed reduced C3 expression compared with the SCI + Veh group. Scale bar: 20 µm; magnified images, 5 µm. (C, D) Representative western blotting and quantification of C3 protein level. (E, F) Representative western blotting of p-P65 and P65 protein expression and quantification of p-P65/P65 level. (G) Representative images of immunofluorescence staining for TNF-α, IL-6, and IL-1β in injured tissue obtained at 7 dpi. The fluorescence intensity of inflammatory factors in the SCI + Veh group was higher than in the Sham group, whereas the expression of the inflammatory factors was reduced in the SCI + RUX group compared with the SCI + Veh group. Scale bar: 20 µm; magnified images, 5 µm. (H–J) Quantitative analysis of IL-1β, IL-6, and TNF-α expression in reactive astrocytes at 7 dpi. (K) ELISA of IL-1β, IL-6 and TNF-α expressions in injured tissue obtained at 7 dpi. (L–N) Relative mRNA level of IL-1β, IL-6, and TNF-α expressions in injured tissue obtained at 7 dpi. The experiments were conducted in triplicate. Data are presented as the mean ± SD (n = 3 per group). Data are normalized by the sham group. *P < 0.05, **P < 0.01 (one-way analysis of variance followed by Tukey’s post hoc test). C3: Complement component 3; DAPI: 4′,6-diamidino-2-phenylindole; dpi: days post-injury; ELISA: enzyme-linked immunosorbent assay; IL-1β: interleukin-1 beta; IL-6: interleukin-6; GAPDH: glyceraldehyde 3-phosphate dehydrogenase; GFAP: glial fibrillary acidic protein; ns: not significant; p-P65: phosphorylated P65; RUX: ruxolitinib; SCI: spinal cord injury; TNF-α: tumor necrosis factor-alpha; Veh: vehicle.
Figure 5
Figure 5
RUX rescues astrocyte EAAT2 loss and restores glutamate uptake in vitro. (A) The effect of RUX (0.5, 1, 1.5, 2 and 2.5 µM) on the viability of astrocytes was assessed via CCK-8 assay (n = 3/ group). (B, C) Western blotting of EAAT2 expression in A1IM-treated astrocytes in each group pre-treated with RUX (0.2, 0.5 and 1 µM) as shown (n = 3 per group). (D) Quantitative analysis of EAAT2 protein levels in each group (n = 3/group). (E, F) Representative immunofluorescence staining images and quantification of EAAT2 (red, Alexa Fluor 594), GFAP (green, Alexa Fluor 488), and DAPI (blue) in primary mouse astrocytes for each group (n = 3 per group). The A1IM group displayed lower fluorescence intensity of EAAT2 compared with the Control group, whereas the RUX group exhibited higher fluorescence intensity of EAAT2 compared with the A1IM group. Scale bar: 20 µm. (G) Relative glutamate uptake of astrocytes in each group (n = 3). The experiments were conducted in triplicate. Data are normalized by the sham group. Data are presented as the mean ± SD. ##P < 0.01, vs. control group; **P < 0.01 (one-way analysis of variance followed by Tukey’s post hoc test). A1IM: A1-like astrocyte induction medium; C1q: complement component 1q; Ctrl: control; DAPI: 4′,6-diamidino-2-phenylindole; EAAT2: excitatory amino acid transporter 2; GFAP: glial fibrillary acidic protein; IL-1α: interleukin-1 alpha; ns: not significant; RUX: ruxolitinib; TNF-α: tumor necrosis factor-alpha.
Figure 6
Figure 6
RUX restores EAAT2 loss in astrocytes by inhibiting the activation of STAT3 in vitro. (A) Representative western blotting of p-JAK2, JAK2, p-STAT3 and STAT3 expression of astrocytes in each group pre-treated with RUX (0.2, 0.5 and 1 µM) (n = 3 per group). (B) Quantitative analysis of p-JAK2/JAK2 and p-STAT3/STAT3 level in each group. (C) Immunocytochemistry of GFAP (green, Alexa Fluor 488) and p-STAT3 (red, Alexa Fluor 594) in primary mouse astrocytes. DAPI (blue) was used to stain nuclei. The A1IM group exhibited higher nuclear p-STAT3 expression compared with the Control group, whereas the RUX group displayed decreased nuclear p-STAT3 expression compared with the A1IM group. Scale bar: 40 µm. (D) Quantitative results of relative p-STAT3 intensity. (E) Representative western blotting of STAT3 expression of astrocytes pre-treated with S3I-201 or vehicle. (F) Quantitative results of relative STAT3 expression level. (G) Primary mouse astrocytes were pretreated with S3I-201 (50 μM) or RUX for 1 hour and then exposed to LPS (1 µg/mL) or PBS for 5 hours. Western blotting was conducted to assess EAAT2 expression level, followed by quantitative analysis of EAAT2 protein expression (H). (I) Glutamate (100 nM) was introduced into each culture medium, and the relative glutamate uptake of astrocytes in each group was measured. Data are normalized to the control group. Data are presented as the mean ± SD (n = 3 per group). ##P < 0.01, vs. control group; *P < 0.05, **P < 0.01, vs. A1IM group (one-way analysis of variance followed by Tukey’s post hoc test). A1IM: A1-like astrocyte induction medium; Ctrl: control; DAPI: 4′,6-diamidino-2-phenylindole; EAAT2: excitatory amino acid transporter 2; GFAP: glial fibrillary acidic protein; JAK2: Janus kinase 2; ns: not significant; p-JAK2: phosphorylated JAK2; p-STAT3: phosphorylated STAT3; RUX: ruxolitinib; S3I-201: a STAT3 inhibitor; STAT3: signal transducer and activator of transcription 3.
Figure 7
Figure 7
RUX alleviates GLU-induced neuronal excitotoxicity by enhancing the GLU-clearing capacity of astrocytes. (A) Plots of the fluorescence intensity of Fluo-4 AM (a Ca2+ fluorescence indicator) as a function of time. ∆F/F0 fluorescence intensities were measured by dividing the changes in the fluorescent signal by average resting fluorescence (B) Real-time Ca2+ currents were measured by Fluo-4 AM, and the fluorescence intensity was tracked through a time-series scanning mode under a confocal microscope through 0 to 180 seconds. The fluorescence intensity increased in the GLU group, whereas the AST group exhibited a decreasing trend. The A1IM group showed higher fluorescence intensity compared with the AST group, whereas the RUX group showed significantly reduced fluorescence intensity. Scale bar: 50 µm. (C) Quantification of regions of interest demonstrating the effect of astrocytes on reducing the fluorescence in 120 seconds. (D) Representative flow cytometry results labeled with DCFH-DA in primary neurons after GLU-induced excitotoxicity. The primary neurons were co-cultured with various types of astrocytes. (E) Quantitative analysis of ROS in D. (F) Western blot analysis of apoptosis-related proteins in primary neurons. (G) Quantification of apoptosis-related proteins in F. (H) Representative images of primary neurons in each group stained with MAP2. Compared with the PBS group, the GLU group exhibited significantly reduced complexity in dendritic branching. Treatment with A1IM exacerbated synaptic damage, whereas treatment with RUX restored the complexity of dendritic branching. Scale bar: 20 µm. (I) Quantification of dendritic intersections using Sholl analysis. The experiments were conducted in triplicate. Data are normalized by PBS group. Data are presented as the mean ± SD. *P < 0.05, **P < 0.01 (one-way analysis of variance followed by Tukey’s post hoc test (C, E, G) or two-way analysis of variance followed by Tukey’s post hoc test (I)). A1IM: A1-like astrocyte induction medium; AST: astrocyte; DCFH-DA: 2′,7′-dichlorodihydrofluorescein diacetate; GLU: glutamate; MAP2: microtubule-associated protein 2; ns: not significant; PBS: phosphate-buffered saline; ROS: reactive oxygen species; RUX: ruxolitinib.
Figure 8
Figure 8
RUX inhibits activation and inflammatory responses of neurotoxic astrocytes in vitro. (A, B) Representative western blotting and quantification of C3 protein level in each group pre-treated with RUX (0.2, 0.5 and 1 µM). (C, D) Representative immunofluorescence images and quantification of C3 (red, Alexa Fluor 594), GFAP (green, Alexa Fluor 488), and DAPI (blue) staining in the Ctrl, A1IM, and RUX groups. The A1IM group showed higher fluorescence intensity of C3 compared with the Control group, whereas the RUX group exhibited lower fluorescence intensity of C3 compared with the A1IM group. Scale bar: 10 µm. (E) Representative western blot showing P65 and p-P65 expression in astrocytes. (F) Quantitative analysis of the p-P65/P65 ratio. (G) Relative mRNA levels of TNF-α, IL-1β, and IL-6 in each group. Data (normalized by control group) are presented as the mean ± SD (n = 3 per group). *P < 0.05, **P < 0.01 (one-way analysis of variance followed by Tukey’s post hoc test). A1IM: A1-like astrocyte induction medium; Ctrl: control; C3: component 3; DAPI: 4′,6-diamidino-2-phenylindole; IL-1β: interleukin-1 beta; IL-6: interleukin-6; GFAP: glial fibrillary acidic protein; ns: not significant; p-65: phosphorylated P65; RUX: ruxolitinib; TNF-α: tumor necrosis factor-alpha.

References

    1. Ahuja CS, Wilson JR, Nori S, Kotter MRN, Druschel C, Curt A, Fehlings MG. Traumatic spinal cord injury. Nat Rev Dis Primers. 2017;3:17018. - PubMed
    1. Alawieh A, Chalhoub RM, Mallah K, Langley EF, York M, Broome H, Couch C, Adkins D, Tomlinson S. Complement drives synaptic degeneration and progressive cognitive decline in the chronic phase after traumatic brain injury. J Neurosci. 2021;41:1830–1843. - PMC - PubMed
    1. Alijanpour S, Miryounesi M, Ghafouri-Fard S. The role of excitatory amino acid transporter 2 (EAAT2) in epilepsy and other neurological disorders. Metab Brain Dis. 2023;38:1–16. - PubMed
    1. Basso DM, Fisher LC, Anderson AJ, Jakeman LB, McTigue DM, Popovich PG. Basso Mouse Scale for locomotion detects differences in recovery after spinal cord injury in five common mouse strains. J Neurotrauma. 2006;23:635–659. - PubMed
    1. Bretheau F, Castellanos-Molina A, Bélanger D, Kusik M, Mailhot B, Boisvert A, Vallières N, Lessard M, Gunzer M, Liu X, Boilard É, Quan N, Lacroix S. The alarmin interleukin-1α triggers secondary degeneration through reactive astrocytes and endothelium after spinal cord injury. Nat Commun. 2022;13:5786. - PMC - PubMed