

Abundance of Prevotella copri in gut microbiota is inversely related to a healthy diet in patients with type 2 diabetes
- PMID: 38526814
- PMCID: PMC10962673
- DOI: 10.38212/2224-6614.3484
Abundance of Prevotella copri in gut microbiota is inversely related to a healthy diet in patients with type 2 diabetes
Abstract
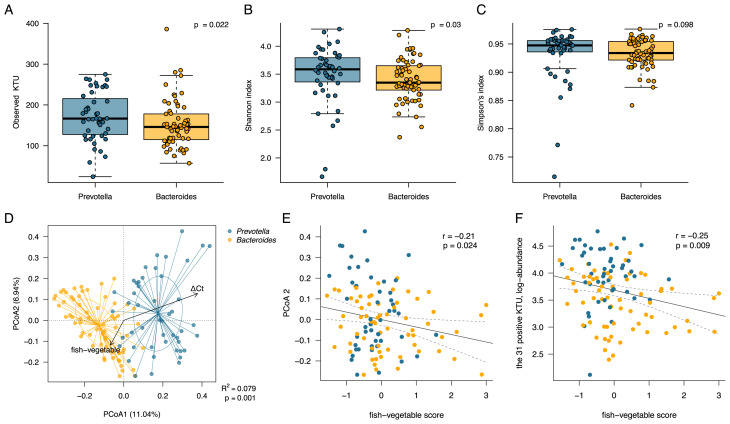
While the gut microbiota is known to be influenced by habitual food intake, this relationship is seldom explored in type 2 diabetes patients. This study aims to investigate the relationship between dietary patterns and gut microbial species abundance in 113 type 2 diabetes patients (mean age, 58 years; body mass index, 29.1; glycohemoglobin [HbA1c], 8.1%). We analyzed the gut microbiota using 16S amplicon sequencing, and all patients were categorized into either the Bacteroides enterotype (57.5%, n = 65) or the Prevotella enterotype (42.5%, n = 48) using the partitioning around medoids clustering algorithm, based on the most representative genera. Patients with the Bacteroides enterotype showed better glycemic control with a 2.71 odds of HbA1c ≤ 7.0% compared to the Prevotella enterotype (95% confidence interval, 1.02-7.87; P, 0.034). Dietary habits and the nutrient composition of all patients were assessed using a validated food frequency questionnaire. It was observed that the amounts of dietary fiber consumed were suboptimal, with an average intake of 16 g per day. Additionally, we extracted four dietary patterns through factor analysis: eating-out, high-sugar foods, fish-vegetable, and fermented foods patterns. Patients with the Bacteroides enterotype had higher scores for the fish-vegetable pattern compared to the Prevotella enterotype (0.17 ± 0.13 versus -0.23 ± 0.09; P, 0.010). We further investigated the relationship between the microbiota and the four dietary patterns and found that only the fish-vegetable dietary pattern scores were correlated with principal coordinate values. A lower pattern score was associated with the accumulated abundance of the 31 significant microbial features. Among these features, Prevotella copri was identified as the most significant by using a random forest model, with an area under the receiver operating characteristic of 0.93 (95% confidence interval, 0.88-0.98). To validate these results, we conducted a custom quantitative polymerase chain reaction assay. This assay confirmed the presence of P. copri (sensitivity, 0.96; specificity, 0.97) in our cohort, with a prevalence of 47.8%, and a mean relative abundance of 21.0% in subjects harboring P. copri. In summary, type 2 diabetes patients with the Prevotella enterotype demonstrated poorer glycemic control and deviations from a healthy dietary pattern. The abundance of P. copri, as a major contributing microbial feature, was associated with the severity in the deficiency in dietary fish and vegetables. Emphasis should be placed on promoting a healthy dietary pattern and understanding the microbial correlations.
Conflict of interest statement
Figures


References
-
- Oggioni C, Lara J, Wells JC, Soroka K, Siervo M. Shifts in population dietary patterns and physical inactivity as determinants of global trends in the prevalence of diabetes: an ecological analysis. Nutr Metabol Cardiovasc Dis. 2014;24:1105–11. - PubMed
-
- Delgado-Lista J, Alcala-Diaz JF, Torres-Pena JD, Quintana-Navarro GM, Fuentes F, Garcia-Rios A, et al. CORDIOPREV Investigators. Long-term secondary prevention of cardiovascular disease with a Mediterranean diet and a low-fat diet (CORDIOPREV): a randomised controlled trial. Lancet. 2022;399:1876–85. - PubMed
-
- Zeevi D, Korem T, Zmora N, Israeli D, Rothschild D, Weinberger A, et al. Personalized nutrition by prediction of glycemic responses. Cell. 2015;163:1079–94. - PubMed
Publication types
MeSH terms
Substances
Supplementary concepts
LinkOut - more resources
Full Text Sources
Medical