. 2024 Jul 15;83(8):1034-1047.
doi: 10.1136/ard-2023-224842.

Inhibition of JAK-STAT pathway corrects salivary gland inflammation and interferon driven immune activation in Sjögren's disease

Affiliations

Inhibition of JAK-STAT pathway corrects salivary gland inflammation and interferon driven immune activation in Sjögren's disease

Sarthak Gupta et al. Ann Rheum Dis. .

Abstract

Objectives: Inflammatory cytokines that signal through the Janus kinases-signal transducer and activator of transcription (JAK-STAT) pathway, especially interferons (IFNs), are implicated in Sjögren's disease (SjD). Although inhibition of JAKs is effective in other autoimmune diseases, a systematic investigation of IFN-JAK-STAT signalling and the effect of JAK inhibitor (JAKi) therapy in SjD-affected human tissues has not been fully investigated.

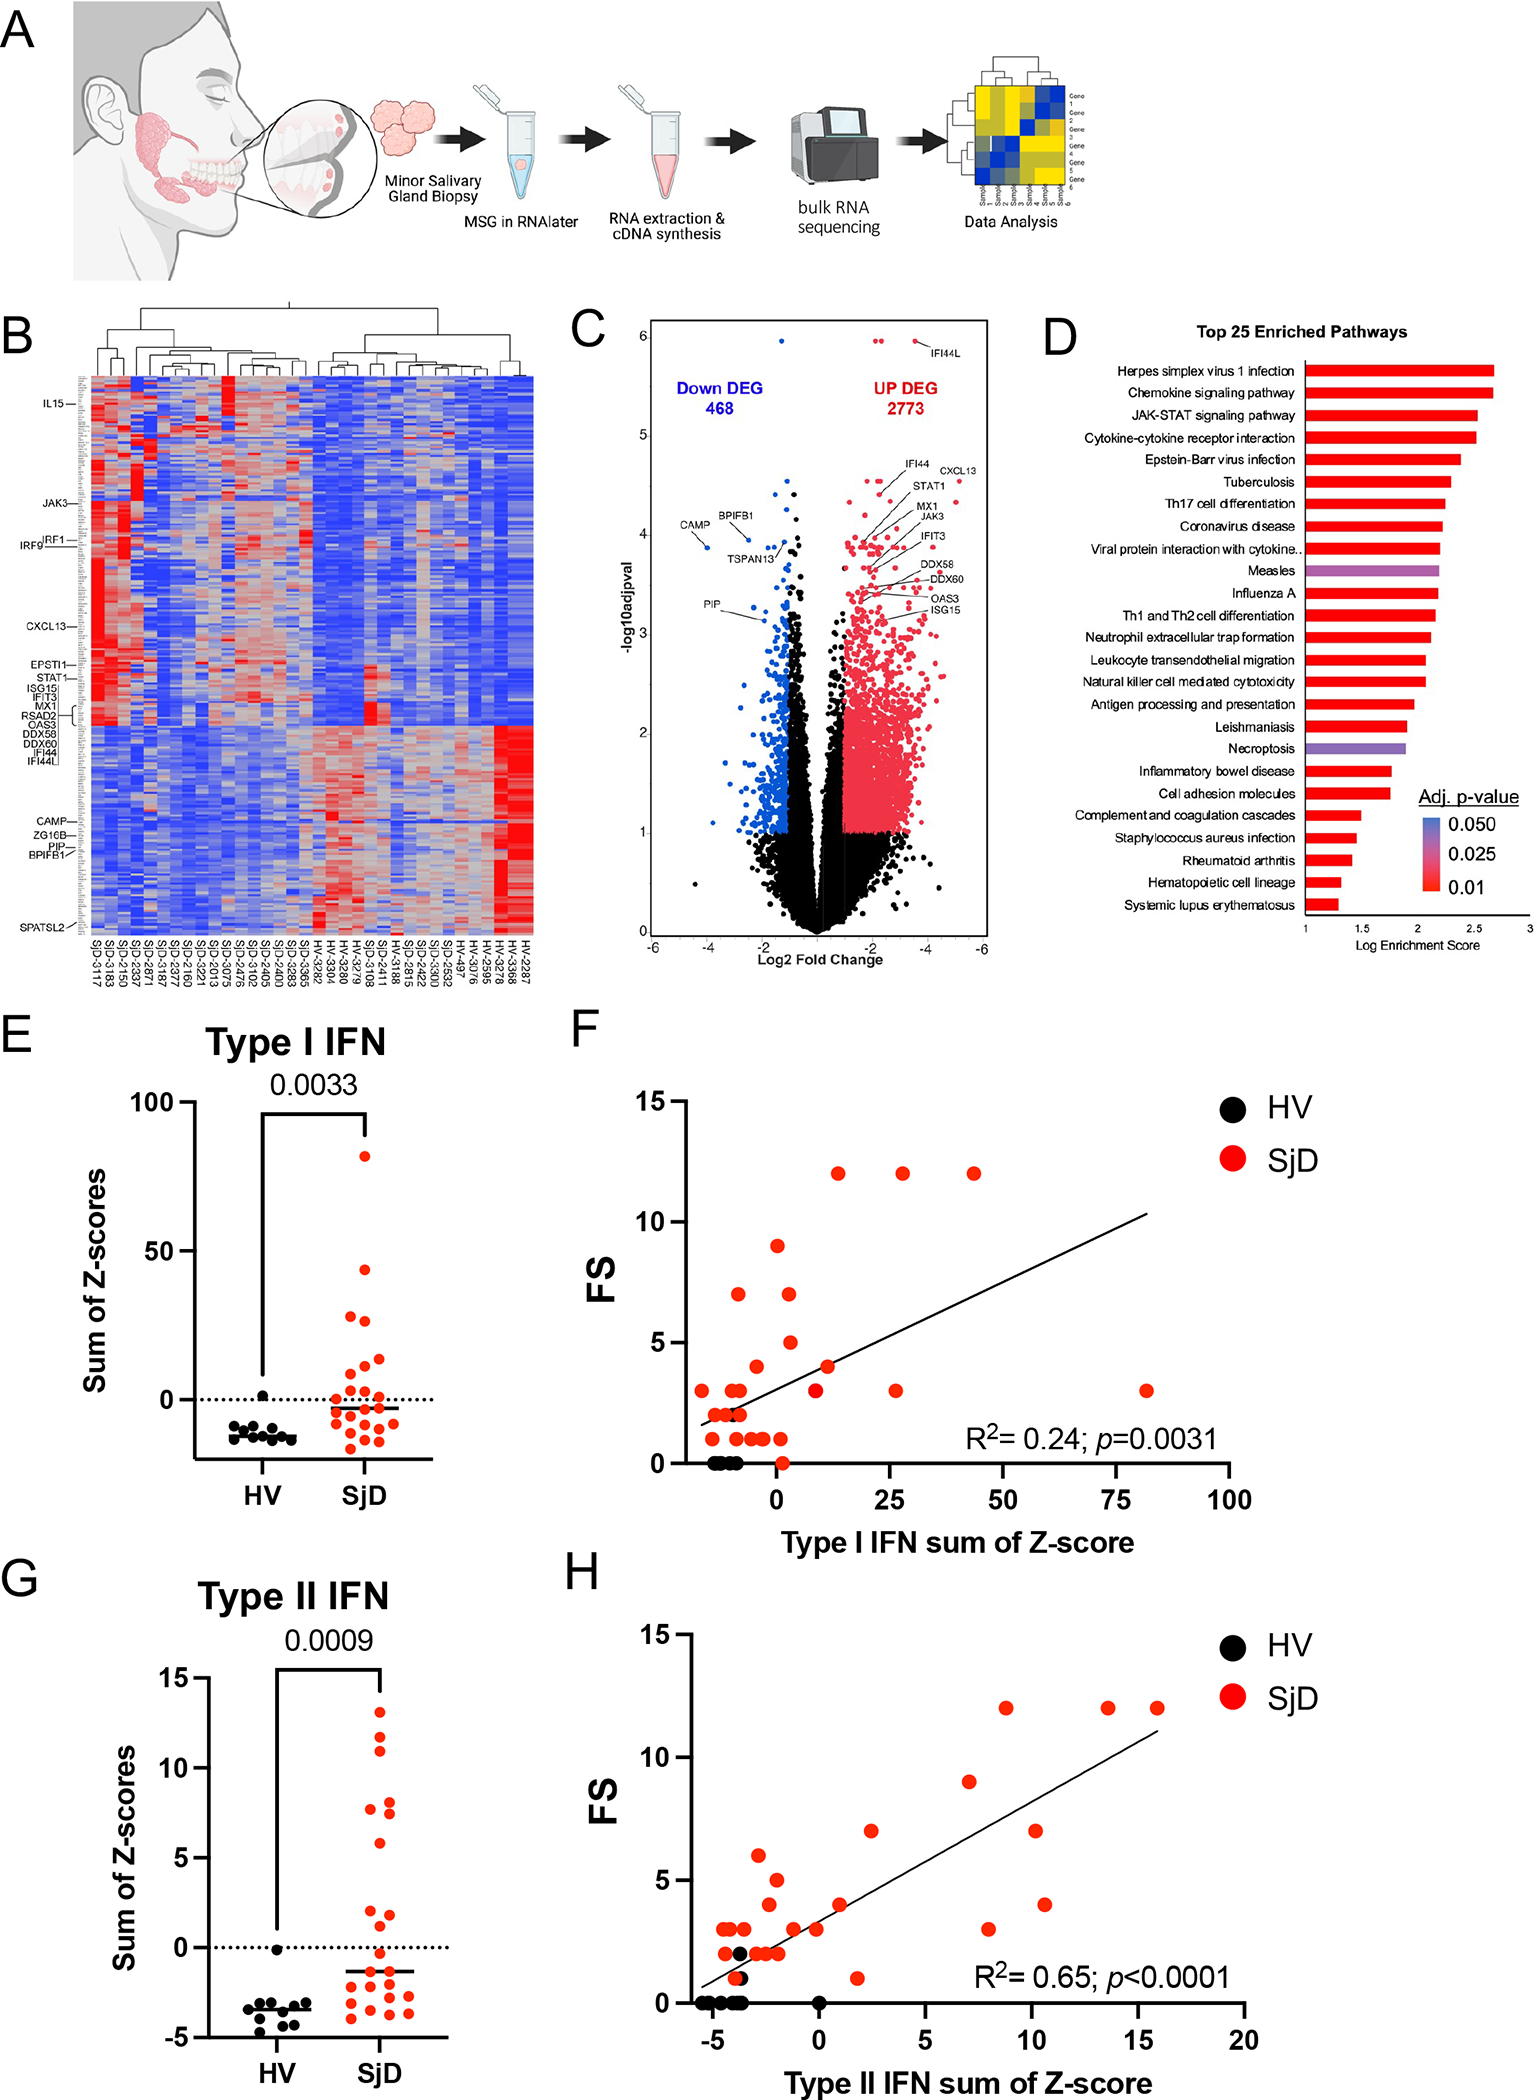
Methods: Human minor salivary glands (MSGs) and peripheral blood mononuclear cells (PBMCs) were investigated using bulk or single-cell (sc) RNA sequencing (RNAseq), immunofluorescence (IF) microscopy and flow cytometry. Ex vivo culture assays on PBMCs and primary salivary gland epithelial cell (pSGEC) lines were performed to model changes in target tissues before and after JAKi.

Results: RNAseq and IF showed activated JAK-STAT pathway in SjD MSGs. Elevated IFN-stimulated gene (ISGs) expression associated with clinical variables (eg, focus scores, anti-SSA positivity). scRNAseq of MSGs exhibited cell type-specific upregulation of JAK-STAT and ISGs; PBMCs showed similar trends, including markedly upregulated ISGs in monocytes. Ex vivo studies showed elevated basal pSTAT levels in SjD MSGs and PBMCs that were corrected with JAKi. SjD-derived pSGECs exhibited higher basal ISG expressions and exaggerated responses to IFN-β, which were normalised by JAKi without cytotoxicity.

Conclusions: SjD patients' tissues exhibit increased expression of ISGs and activation of the JAK-STAT pathway in a cell type-dependent manner. JAKi normalises this aberrant signalling at the tissue level and in PBMCs, suggesting a putative viable therapy for SjD, targeting both glandular and extraglandular symptoms. Predicated on these data, a phase Ib/IIa randomised controlled trial to treat SjD with tofacitinib was initiated.

Keywords: Antirheumatic Agents; Autoimmune Diseases; Cytokines; Sjogren's Syndrome.


Conflict of interest statement

Competing interests: BMW has Cooperative Research Award and Development Agreements (CRADA) from Pfizer and Mitobridge (a subsidiary of Astellas Pharma). NIAMS has CRADAs with AstraZeneca and Bristol Myers Squibb. These CRADA did not financially support the experimental results presented herein.

Figures

Figure 1:
Figure 1:. Bulk sequencing of minor salivary gland and IFN signature
(A) Overview of MSG biopsy and whole transcriptomic analysis using RNAseq from SjD (n=22) and HV (n=11). (B) Heatmap illustrating the top 250 DEGs in MSG between SjD and HV highlighting multiple ISGs, cytokines, and interleukins, in the DEG. (C) A volcano plot showing the DEGs between SjD and HV; representative genes are highlighted. (D) Pathway enrichment analysis identified JAK-STAT pathway as one of the top three differentially utilized pathway among the 25 significantly enriched pathways in SjD. (E, G) Calculated Type-I and Type-II IFN scores in SjD and HV MSG. Differences in mean values were compared using the Mann-Whitney U-test at a p < 0.05 deemed significant. (F, H) Correlation of IFN signatures noted in bulk RNAseq with FS in the glands. Spearman correlation analysis was used to assess the significance between correlated values at a p < 0.05. MSG, minor salivary gland; RNAseq, RNA sequencing; SjD, Sjogren’s Disease; HV, healthy volunteer; DEGs, differentially expressed genes; ISG, interferon-stimulated genes; FS, focus score.
Figure 2:
Figure 2:. Immunofluorescence microscopy
(A) Overview of MSG biopsy, image acquisition and flow cytometry. (B) MSG IF image showing expression of JAK1 and JAK3 in SjD epithelial and infiltrating immune cells. (C) Mean fluorescence of KRT18, JAK1, and JAK3 in SjD and non-SjD MSGs JAK1 expression was localized to immune cells; but JAK3 expression was present in both epithelial and infiltrating immune cells (Mann-Whitney Test). (D) Cellular population changes in SjD (n=16) and non-SjD (n=7) MSG was characterized by flow cytometry (E) The proportion of pSTAT proteins were measured by flow cytometry for the following proteins: pSTAT1, pSTAT3(Ser727), and pSTAT6 in immune (CD45+ KRT18−) and epithelial (CD45− KRT18+) cells. P value was calculated using Welch’s test. MSG, minor salivary gland; IF, immune fluorescent; SjD, Sjögren’s Disease; KRT18, Keratin-18.
Figure 3:
Figure 3:. Single cell RNAseq and pSTATs frequencies of MSG
(A) UMAP embedding of the entire dataset colored by generated clusters labeled by cell type annotation. From all profiled MSG samples from seven SjD and five non-SjD, Leiden clustering identified 12 different cell clusters corresponding to mucous (MUC5B) and seromucous acinar cells (MUC7), ductal cells (S100A2), plasma cells (IGHA, IGHG1), fibroblasts (COL1A2), myoepithelial (KRT14), pericytes (ACTA2), B cells (CD79A), Macrophages (CD68), T-lymphocytes (CD3D), and erythrocytes (HBB) (n = 51736 cells). (B) Cell density plots show greater immune cell infiltration in SjD MSG. (C) The top 10 DEG in each of the cell types were dominated by ISGs; expression B2M, HLA-B, SAA1, IL32, and MGP. ISGs are highlighted in red characters. (D) Differential expression of IFN score in SjD and non-SjD, immune cells showed the biggest fold-changes in IFN score were in infiltrating immune cell types exhibited higher IFN scores. (E) Fold change expression of JAK-STAT genes in each cell type. UMAP, Uniform manifold approximation and projection; MSG, minor salivary gland; SjD, Sjögren’s Disease; DEG, differentially expressed genes.
Figure 4:
Figure 4:. Single cell RNAseq and pSTATs frequencies of PBMC
(A) Overview of the use of patient’s serum and PBMC for experimental assays. (B) A volcano plot depicting protein expression differences in serum from SjD (right side) and HV (left side) using the Somalogic aptamer-based 1.3K target proteomics analysis with representative proteins highlighted (C) 4-protein IFN regulated protein “score” in SjD, nonSjD, and HV sera. P value were calculated using Kruskal-Wallis test. (D) UMAP embedding of the entire PBMC dataset colored by generated clusters labeled by cell type annotation. Leiden clustering identified 10 different cell clusters from all profiled PBMC samples from SjD (n=8) and non-SjD (n=6) representing a total of 206687 cells. (E) Functional annotation analysis of PBMC scRNAseq. (F) Cell-type and disease-state dependent Type-I IFN scores. SjD, Sjögren’s Disease; UMAP, Uniform manifold approximation and projection; RNAseq, RNA sequencing; ISG, interferon-stimulated genes.
Figure 5:
Figure 5:. Basal pSTATs frequencies in PBMCs
(A-D) Flow cytometry analysis revealed basal pSTAT protein levels in whole live cells of PBMCs in SjD (n=21) compared to HV (n=10). P value was calculated using Welch’s test. SjD, Sjögren’s Disease; HV, healthy volunteer.
Figure 6:
Figure 6:. Treatment effects of tofacitinib in PBMCs
(A) Experimental overview depicting human peripheral blood mononuclear cells (PBMCs) treated ex vivo with IFNβ in the presence and absence of tofacitinib, to assess the therapeutic efficacy of tofacitinib in modulating immune responses. PBMCs were treated with or without 5μM tofacitinib for 1 hour prior to IFNβ treatment for 30 minutes or 6 hours, respectively. (B) Treatment with tofacitinib blocked STATs phosphorylation status induced by IFNβ stimulation in PBMCs from SjD. P value was calculated using Mann-Whitney test. (C) UMAP embedding of the entire dataset colored by generated clusters labeled by four general cell type annotations. (D) Differential utilization of IFN signature of each condition showed tofacitinib abolished the IFNβ-induced IFN score to baseline level. (E) Volcano plot showing DEGs by pseudobulk analysis across SjD and HV, in which some representative genes were highlighted. T cells (129 genes) and monocytes (61 genes) exhibited greater numbers of downregulated ISGs in the context of tofacitinib treatment. RNAseq, RNA sequencing; SjD, Sjögren’s Disease; DEG, differentially expressed genes; HV, healthy volunteer; ISG, interferon-stimulated genes.
Figure 7:
Figure 7:. Treatment effects of tofacitinib in pSGECs
(A) An experimental summary detailing the analysis of primary salivary gland epithelial cells (pSGEC) derived from minor salivary gland (MSG) biopsies, treated with or without IFNβ in the presence and absence of tofacitinib, and assessed through immunofluorescence microscopy and RT-qPCR (B, C) Differential expression of pSTAT1 in the nucleus and cytosol of pSGECs. P value was calculated using Kruskal-Wallis test. (D) Expression change of ISGs on pSGECs in SjD (n=5 individuals’ lines) and HV (n=5 individuals’ lines). One SjD and one HV samples were eliminated from MX1 result. P value was calculated using Mann-Whitney test and Welch’s test. pSGEC, primary salivary gland epithelial cells; SjD, Sjögren’s Disease; HV, healthy volunteer; ISG, interferon stimulated genes. RQ, relative quantification.

Update of

References

    1. Mavragani CP, Moutsopoulos HM. Sjögren’s syndrome: Old and new therapeutic targets. J Autoimmun 2020;110:102364. doi: 10.1016/j.jaut.2019.102364 [published Online First: 20191209] - DOI - PubMed
    1. Xu T, Zhu H-X, You X, et al. Single-cell profiling reveals pathogenic role and differentiation trajectory of granzyme K+CD8+ T cells in primary Sjögren’s syndrome. JCI Insight 2023;8(8) doi: 10.1172/jci.insight.167490 - DOI - PMC - PubMed
    1. Verstappen GM, Gao L, Pringle S, et al. The Transcriptome of Paired Major and Minor Salivary Gland Tissue in Patients With Primary Sjögren’s Syndrome. Front Immunol 2021;12:681941. doi: 10.3389/fimmu.2021.681941 [published Online First: 20210706] - DOI - PMC - PubMed
    1. van Nimwegen JF, Mossel E, van Zuiden GS, et al. Abatacept treatment for patients with early active primary Sjögren’s syndrome: a single-centre, randomised, double-blind, placebo-controlled, phase 3 trial (ASAP-III study). The Lancet Rheumatology 2020;2(3):e153–e63. doi: 10.1016/S2665-9913(19)30160-2 - DOI - PubMed
    1. Oyelakin A, Horeth E, Song EC, et al. Transcriptomic and Network Analysis of Minor Salivary Glands of Patients With Primary Sjögren’s Syndrome. Front Immunol 2020;11:606268. doi: 10.3389/fimmu.2020.606268 [published Online First: 20210108] - DOI - PMC - PubMed

MeSH terms