. 2024 Mar 25;15(1):2637.
doi: 10.1038/s41467-024-46927-z.

Phenome-wide Mendelian randomisation analysis of 378,142 cases reveals risk factors for eight common cancers

Affiliations

Phenome-wide Mendelian randomisation analysis of 378,142 cases reveals risk factors for eight common cancers

Molly Went et al. Nat Commun. .

Abstract

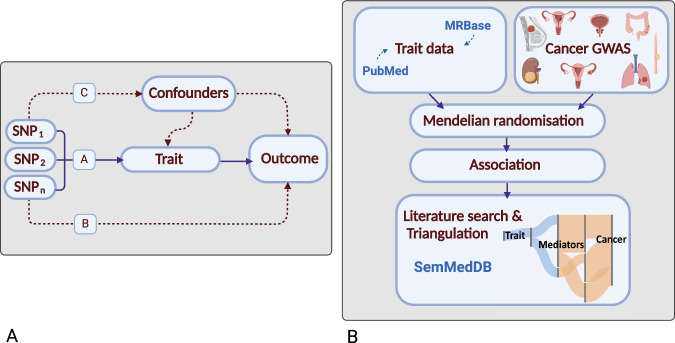
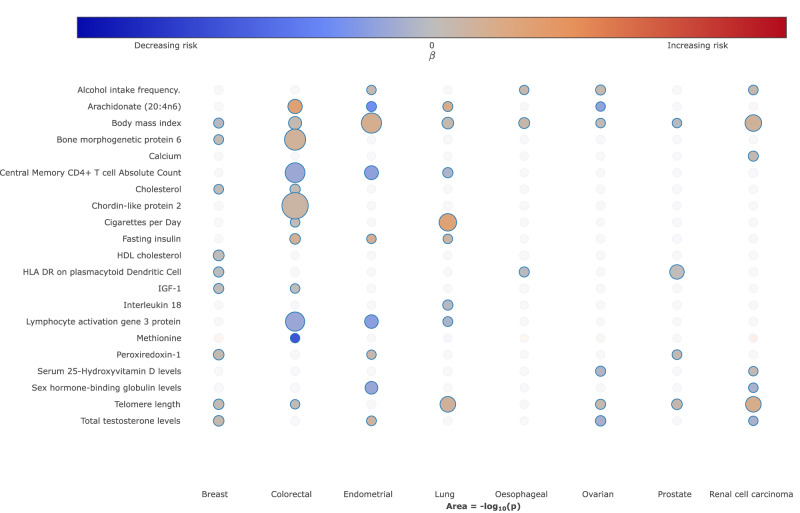
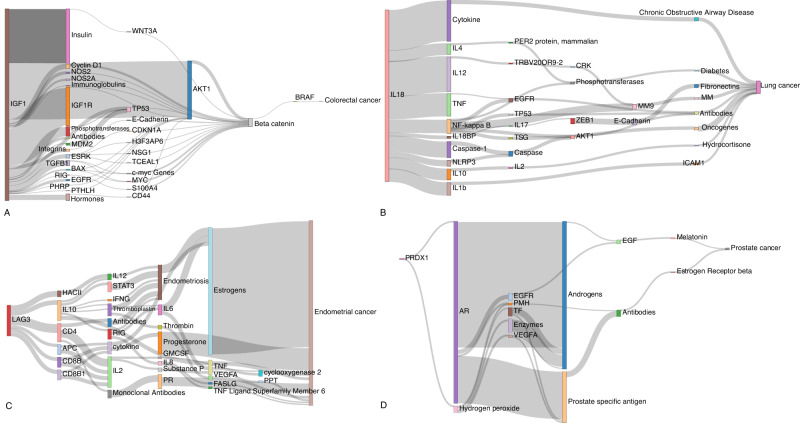
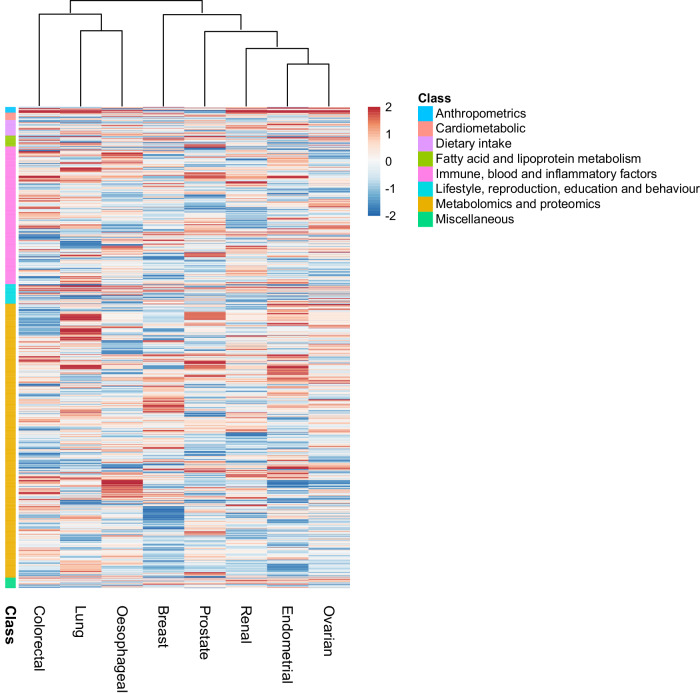
For many cancers there are only a few well-established risk factors. Here, we use summary data from genome-wide association studies (GWAS) in a Mendelian randomisation (MR) phenome-wide association study (PheWAS) to identify potentially causal relationships for over 3,000 traits. Our outcome datasets comprise 378,142 cases across breast, prostate, colorectal, lung, endometrial, oesophageal, renal, and ovarian cancers, as well as 485,715 controls. We complement this analysis by systematically mining the literature space for supporting evidence. In addition to providing supporting evidence for well-established risk factors (smoking, alcohol, obesity, lack of physical activity), we also find sex steroid hormones, plasma lipids, and telomere length as determinants of cancer risk. A number of the molecular factors we identify may prove to be potential biomarkers. Our analysis, which highlights aetiological similarities and differences in common cancers, should aid public health prevention strategies to reduce cancer burden. We provide a R/Shiny app to visualise findings.


Conflict of interest statement

The authors declare no competing interests.

Figures

Fig. 1
Fig. 1. Principles of Mendelian randomisation (MR) and study overview.
A Assumptions in MR that need to be satisfied to derive unbiased causal effect estimates. Dashed lines represent direct causal and potential pleiotropic effects that would violate MR assumptions. A, indicates genetic variants used as IVs are strongly associated with the trait; B, indicates genetic variants only influence cancer risk through the trait; C, indicates genetic variants are not associated with any measured or unmeasured confounders of the trait-cancer relationship. SNP, single-nucleotide polymorphism; B Study overview. Genetic variants serving as instruments for exposure traits under investigation were identified from MRBase or PubMed. GWAS data for the eight cancers was acquired and MR analysis was performed. Results were triangulated through literature mining to provide supporting evidence for potentially causal relationships. Created with BioRender.com. GWAS genome-wide association study.
Fig. 2
Fig. 2. Power to predict causal relationships in the Mendelian randomisation analysis across the eight different cancers.
Each line represents an individual trait with the line colour indicating the F-statistic, a measure of instrument strength. The analysis of most traits is well powered across a modest range of odds ratios. Generally, better powered traits are those with a higher F-statistic. F-stat: F-statistic.
Fig. 3
Fig. 3. Hierarchical classification of associations.
Potentially causal relationships between non-binary traits and cancers were categorised into four hierarchical levels of statistical significance a priori; robust (PIVW-RE < 1.4 × 10−5; corresponding to a P-value of 0.05 after Bonferroni correction for multiple testing (0.05/3,500), PWME or PMBE < 0.05, predicted true causal direction and >1 IVs), probable (PIVW-RE < 0.05, PWME or PMBE < 0.05, predicted true causal direction and >1 IVs), suggestive (PIVW-RE < 0.05 or PWALD < 0.05), and non-significant (PIVW-RE ≥ 0.05 or PWALD ≥ 0.05). Weighted median estimates (WME) and mode-based estimates (MBE) were used in addition to an inverse weighted random effects (IVW-RE) model, to assess the robustness of our findings, while MR-Egger regression assessed the extent to which directional pleiotropy could affect causal estimates. MR-Steiger was used to ascertain that the exposure trait influenced the outcome and not vice versa. Binary traits were classified associations as being supported (P < 0.05) or not supported (P > 0.05). MR, Mendelian randomisation; IV, instrumental variable.
Fig. 4
Fig. 4. Bubble plot of the potentially causal relationship between selected traits and risk of different cancers.
The columns correspond to different cancer types. The colours on the heatmap correspond to the strength of associations (odds ratio) and their direction (red positively correlated, blue negatively correlated). P-values represent the results from two-sided tests and are unadjusted. The size of each node corresponds to the -log10 P-value, with increasing size indicating a smaller P-value. In the available R/Shiny app (https://software.icr.ac.uk/app/mrcan), moving the cursor on top of each bubble will reveal the underlying MR statistics.
Fig. 5
Fig. 5. Sankey diagram of literature spaces for exemplar cancer risk factors.
These diagrams illustrate the relationship between exposure traits and cancers via their linked literature triples. The thickness of the line connecting two mediating traits indicates the frequency with which that triple is mentioned in the literature. Relationships for: A IGF-1 and colorectal cancer; B IL-18 and lung cancer; C LAG−3 and endometrial cancer; D PRDX1 and prostate cancer. AR androgen receptor, EGF: epidermal growth factor, EGFR epidermal growth factor receptor, ESRK extracellular signal regulated kinases, GMCSF granulocyte-macrophage colony-stimulating factor, HACII histocompatibility antigens class II, IFNG interferon gamma, MM matrix metalloproteinases, MM9 matrix metalloproteinase 9, PHRP parathyroid hormone-related protein, PMH phosphoric monoester hydrolases, PPT: phenylpyruvate tautomerase, PR progesterone receptor, RIG recombinant interferon-gamma, TF transcription factor, TNF tumour necrosis factor, TSG tumour suppressor genes, VEGFA vascular endothelial growth factor A.
Fig. 6
Fig. 6. Heatmap and dendrogram showing clustering of potentially causal associations between traits and cancer risk.
Heatmap based on Z-statistics using the clustering method implemented in the pheatmap function within R. Colours correspond to the strength of associations and their direction (red positive association with risk, blue inverse association with risk). Trait classes are annotated on the left. Only traits showing an association for at least one cancer type are shown. Further heatmaps for individual classes of traits are shown in Supplementary Figs. 1–8.

Update of

References

    1. Sung H, et al. Global Cancer Statistics 2020: GLOBOCAN estimates of incidence and mortality worldwide for 36 cancers in 185 countries. CA Cancer J. Clin. 2021;71:209–249. doi: 10.3322/caac.21660. - DOI - PubMed
    1. International Agency for Research on Cancer Website. https://www.iarc.who.int. World Cancer Report 2008. (International Agency for Research on Cancer, 2008). Date accessed: 02/01/2023.
    1. Stephen, B. & Simon, G. T. Mendelian randomization: Methods for using genetic variants in causal estimation. Biometrics vol. 73 356–356 (CRC Press, Boca Raton, 2021).
    1. Markozannes G, et al. Systematic review of Mendelian randomization studies on risk of cancer. BMC Med. 2022;20:41. doi: 10.1186/s12916-022-02246-y. - DOI - PMC - PubMed
    1. Millard, L. A. et al. MR-PheWAS: hypothesis prioritization among potential causal effects of body mass index on many outcomes, using Mendelian randomization. Sci. Rep. 5, 16645 (2015). - PMC - PubMed