. 2024 Mar 25;15(1):2635.
doi: 10.1038/s41467-024-46953-x.

SKA2 regulated hyperactive secretory autophagy drives neuroinflammation-induced neurodegeneration

Affiliations

SKA2 regulated hyperactive secretory autophagy drives neuroinflammation-induced neurodegeneration

Jakob Hartmann et al. Nat Commun. .

Abstract

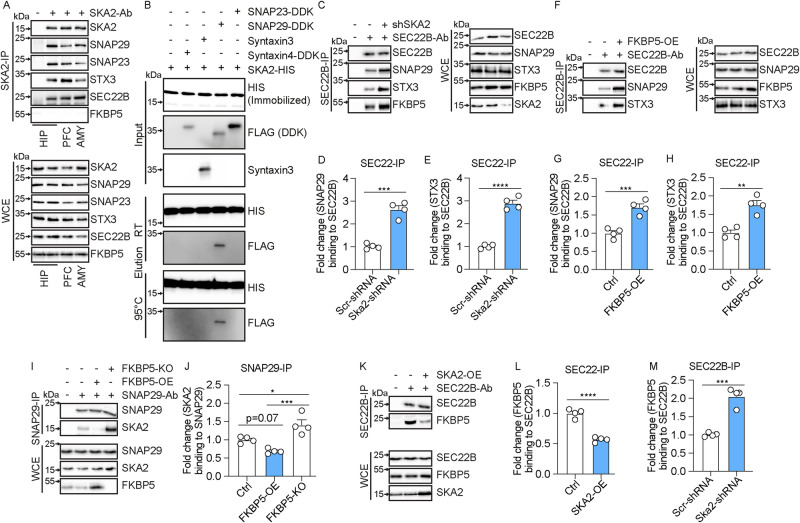
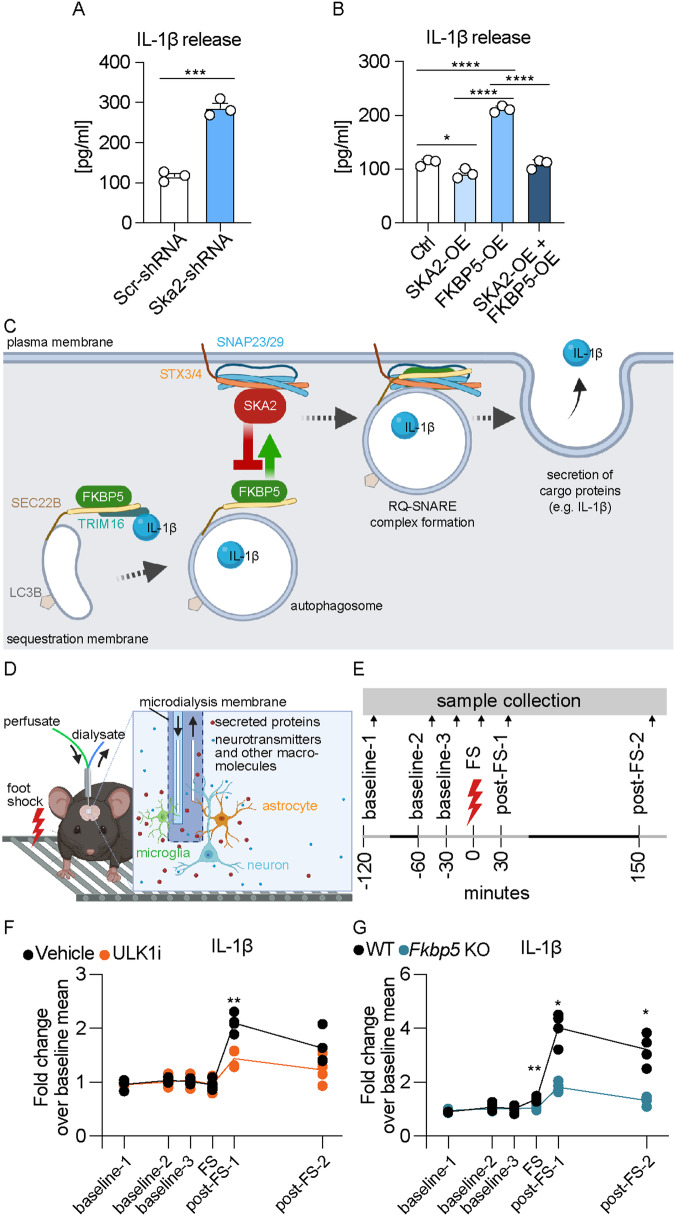
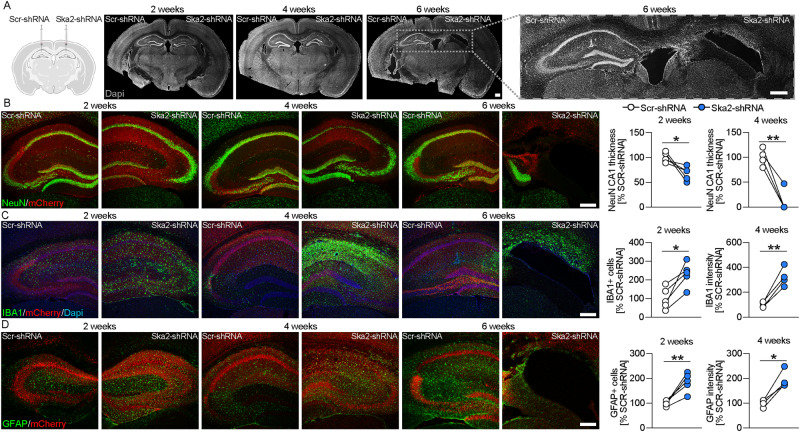
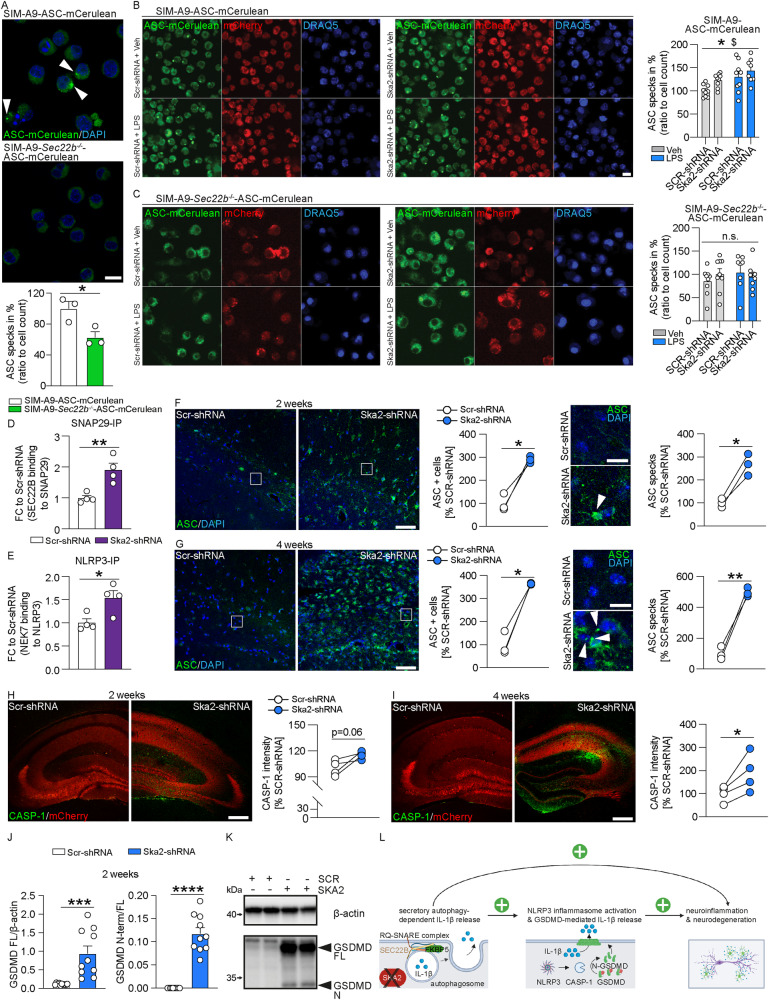
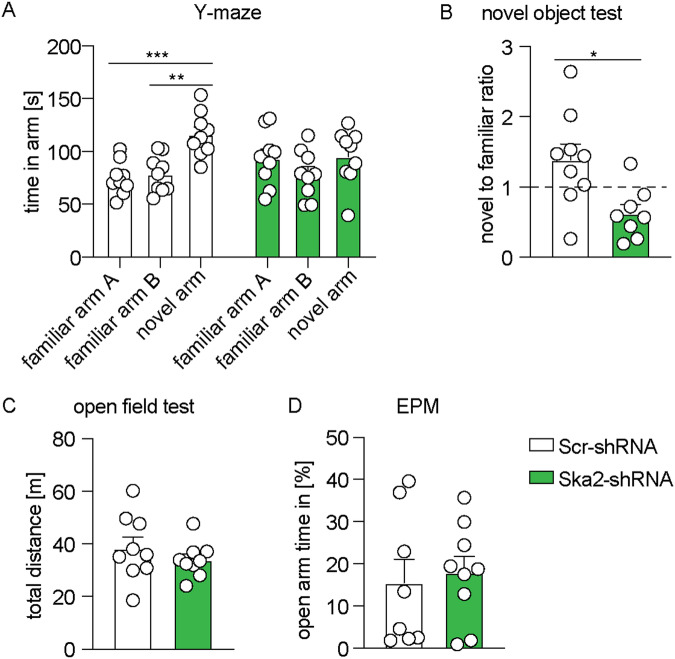
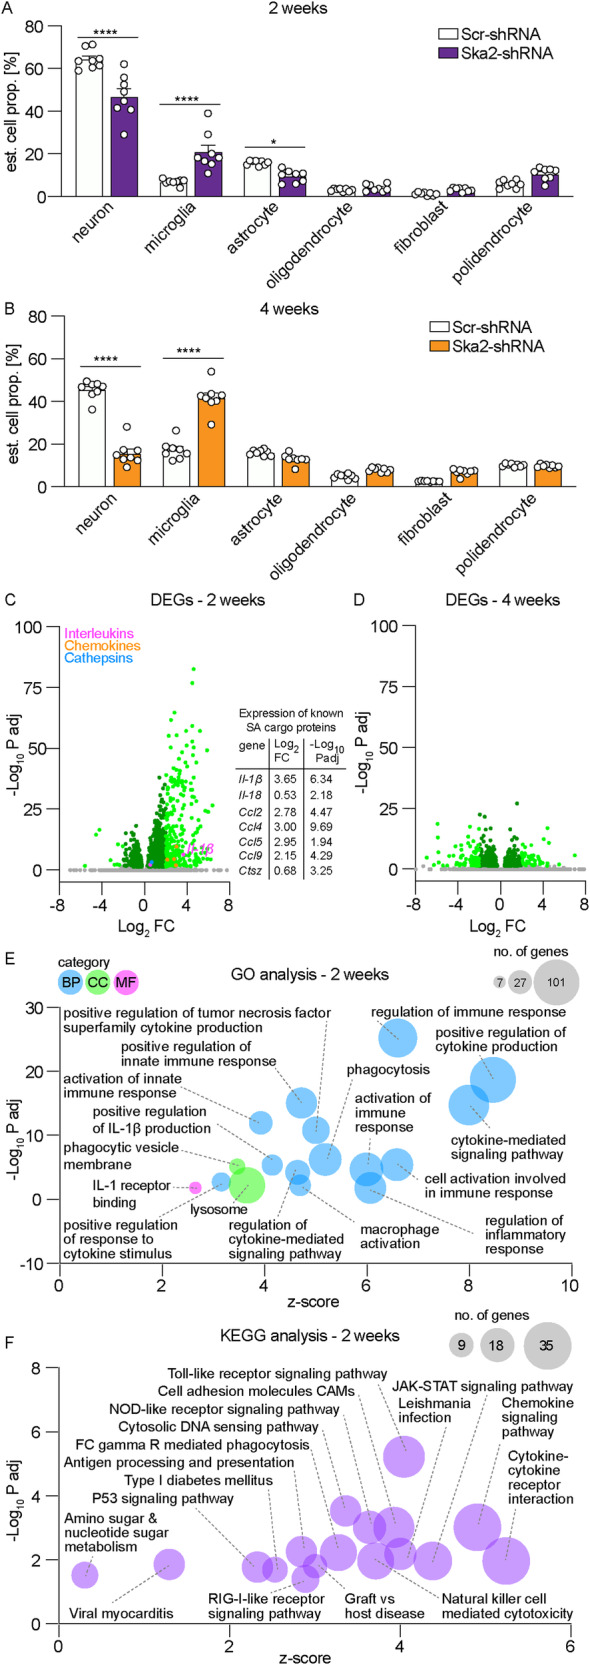
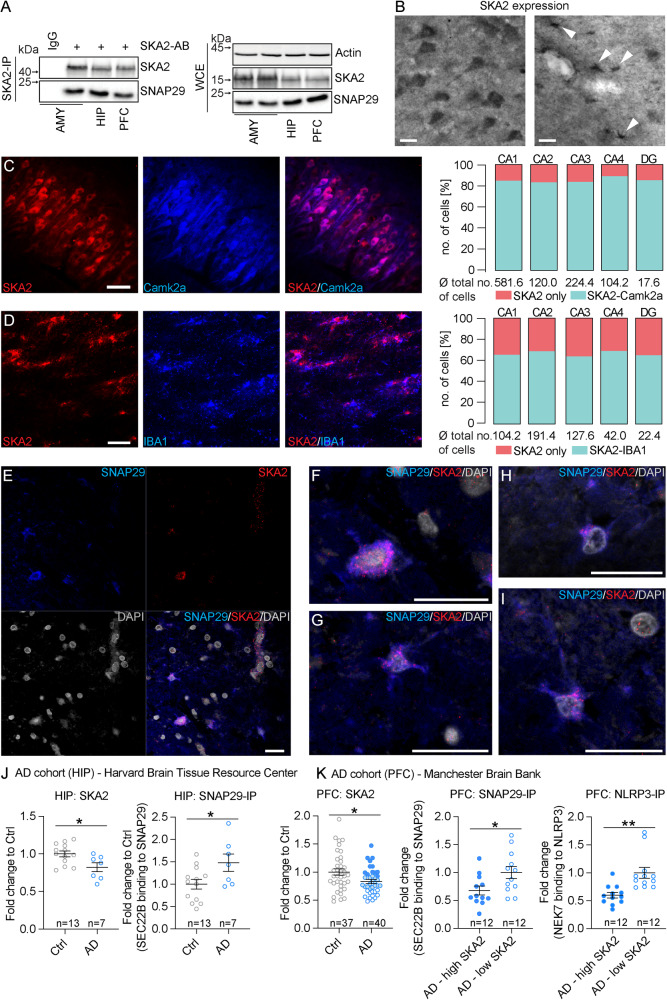
High levels of proinflammatory cytokines induce neurotoxicity and catalyze inflammation-driven neurodegeneration, but the specific release mechanisms from microglia remain elusive. Here we show that secretory autophagy (SA), a non-lytic modality of autophagy for secretion of vesicular cargo, regulates neuroinflammation-mediated neurodegeneration via SKA2 and FKBP5 signaling. SKA2 inhibits SA-dependent IL-1β release by counteracting FKBP5 function. Hippocampal Ska2 knockdown in male mice hyperactivates SA resulting in neuroinflammation, subsequent neurodegeneration and complete hippocampal atrophy within six weeks. The hyperactivation of SA increases IL-1β release, contributing to an inflammatory feed-forward vicious cycle including NLRP3-inflammasome activation and Gasdermin D-mediated neurotoxicity, which ultimately drives neurodegeneration. Results from protein expression and co-immunoprecipitation analyses of male and female postmortem human brains demonstrate that SA is hyperactivated in Alzheimer's disease. Overall, our findings suggest that SKA2-regulated, hyperactive SA facilitates neuroinflammation and is linked to Alzheimer's disease, providing mechanistic insight into the biology of neuroinflammation.


Conflict of interest statement

N.D. is currently an employee of Sumitomo Pharma America. K.M.M. is currently an employee of Jazz Pharmaceuticals. S.M. is currently an employee of Roche Diagnostics. Their contributions pre-date that employment and their co-authorship do not reflect collaboration on this project with these organizations. K.J.R. has received consulting income from Alkermes, Bionomics, and BioXcel and is on scientific advisory boards for Janssen and Verily for unrelated work. He has also received a sponsored research grant support from Takeda, Alto Neuroscience, and Brainsway for unrelated work. T.K. has received consulting income from Alkermes for unrelated work. Within the last 2 years, W.A.C. has served as a consultant for Psy Therapeutics and has had sponsored research agreements with Cerevel Therapeutics and Delix Therapeutics. The remaining authors declare no competing interests.

Figures

Fig. 1
Fig. 1. SKA2 and FKBP5 have opposing roles in the final step of secretory autophagy (SA).
A SNAP29, SNAP23, STX3, SEC22B, and FKBP5 co-immunoprecipitation (SKA2 IP) and whole cell extract (WCE) in hippocampus (HIP), prefrontal cortex (PFC) and amygdala (AMY) samples of mice (n = 8). B HIS pull down assay (replicated in 3 independent in vitro experiments). DDK(Flag)-tagged SNAP23, SNAP29, Syntaxin3 or Syntaxin4 was incubated with purified magnetic beads-HIS-tagged SKA2 or magnetic beads-HIS protein alone. After incubation, bead bound proteins were eluted at room temperature (RT) or at 95 °C and subjected to western blot analysis using antibodies against HIS and FLAG. Input lane contains HIS alone (left) or HIS-tagged SKA2 (right). CM SIM-A9 cells transfected with SKA2, FKBP5 or their respective controls, were harvested 24 h later. After immunoprecipitation (IP) of protein complexes, input and co-IP proteins were quantified by western blotting. C, F, I, K Representative blots of (D, E, G, H, J, L, M). Graphs display quantification of SNAP29/SEC22B, STX3/SEC22B, SKA2/SNAP29, FKBP5/SEC22B protein association after SEC22B or SNAP29 IP (unpaired two tailed t-test: (D) t6 = 8.945, p < 0.0001, (E) t6 = 12.94, p < 0.0001, (G) t6 = 6.056, p = 0.0009, (H) t6 = 5.554, p = 0.0014; one-way ANOVA: (J) F2, 9 = 17.28, p = 0.0008, Tukey’s post hoc test: ctrl vs. FKBP5-OE, p = 0.0743, ctrl vs. FKBP5-KO, p = 0.0218, FKBP5-OE vs. FKBP5-KO, p = 0.0006; unpaired two tailed t-test: (L) t6 = 10.27, p < 0.0001, (M) t6 = 8.140, p = 0.0002; n = mean derived from four independent in vitro experiments). * = p < 0.05; ** = p < 0.01; *** = p < 0.001; **** = p < 0.0001. Data are presented as mean + SEM. Source data are provided as a Source Data file.
Fig. 2
Fig. 2. Activation of secretory autophagy (SA) increases cargo protein release in vitro and in vivo.
A, B IL-1β release measured via ELISA from supernatants of SIM-A9 cells 24 h after manipulation of SKA2 and/or FKBP5 expression, and following overnight LPS (100 ng/mL) and treatment with LLOMe (0.25 mM) for 3 h (unpaired two tailed t-test: (A) t4 = 11.99, p = 0.0003; one-way ANOVA: B F3, 8 = 158.6, p < 0.0001; Tukey’s post hoc test: ctrl vs. SKA2-OE, p = 0.0384, ctrl vs. FKBP5-OE, p < 0.0001, SKA2-OE vs. FKBP5-OE, p < 0.0001, FKBP5-OE vs. SKA2 + FKBP5 OE, p < 0.0001; n = mean derived from three independent in vitro experiments). C Schematic overview of the SA pathway with SKA2 and FKBP5. The cargo receptor TRIM16, together with SEC22B, transfers molecular cargo (e.g., IL-1β) to the autophagy-related LC3B-positive membrane carriers. SEC22B, now acting as an R-SNARE on the delimiting membrane facing the cytosol, carries out fusion at the plasma membrane in conjunction with the Qbc-SNAREs, SNAP23 and SNAP29 (SNAP23/29), and one of the plasma membrane Qa-SNAREs, STX3 or STX4 (STX3/4), thus delivering IL-1β to the extracellular milieu, where it exerts its biological functions. FKBP5 acts as a positive regulator of SA by enhancing TRIM16-SEC22B complex formation as well as autophagosome-plasma membrane fusion via the SNARE-protein complex assembly. In contrast, SKA2 inhibits the SNARE-protein complex formation during vesicle-plasma membrane fusion, thereby acting as gatekeeper of SA. D, E Schematic overview of in vivo microdialysis and the experimental design and timeline; each sample was collected over 30 min indicated by the light gray lines. Quantifications of IL-1β, determined by capillary-based immunoblotting from in vivo medioprefrontal cortex microdialysis of C57Bl/6NCrl mice injected intraperitoneally with ULK1 inhibitor (ULK1i, an autophagy inhibitor) or saline (F; repeated measures two-way ANOVA, time × treatment interaction: F5, 30 = 7.064, p = 0.0002; Šidák’s multiple comparisons post hoc test, post-FS-1: p = 0.0084; n = 4 mice per group) as well as of wild type (WT) and global Fkbp5 knockout mice (G; repeated measures two-way ANOVA, time × genotype interaction: F5, 30 = 34.15, p < 0.0001; Šidák’s multiple comparisons post hoc test: FS: p = 0.009, post-FS-1: p = 0.0163, post-FS-2: p = 0.0294; n = 4 mice per group). FS foot shock. * = p < 0.05; ** = p < 0.01; *** = p < 0.001; **** = p < 0.0001. Data are presented as mean + SEM. Source data are provided as a Source Data file.
Fig. 3
Fig. 3. Hippocampal Ska2 knockdown induces neuroinflammation-mediated neurodegeneration in mice.
A Schematic representation of viral injections (Scr-shRNA-AAV and Ska2-shRNA-1-AAV) into the hippocampus (left). (right) Representative IHC images of DAPI (gray) 2, 4 and 6 weeks after viral injections. B IHC images of NeuN (green) and mCherry (red, viral marker) 2, 4, and 6 weeks after viral injection. Quantification of CA1 thickness 2 and 4 weeks after viral injection (paired t-test: 2 weeks, t4 = 3.194, p = 0.0331; n = 5 mice; 4 weeks, t3 = 6.711, p = 0.0068; n = 4 mice). C IHC images of IBA1 (green), mCherry (red), and DAPI (blue) 2, 4, and 6 weeks after viral injection. Quantification of IBA1 expression 2 and 4 weeks after viral injection (paired t-test: 2 weeks, t4 = 4.295, p = 0.0127; n = 5 mice; 4 weeks, t3 = 7.165, p = 0.0056; n = 4 mice). D IHC images of GFAP (green) and mCherry (red) 2, 4, and 6 weeks after viral injection. Quantification of GFAP expression 2 and 4 weeks after viral injection (paired t-test: 2 weeks, t4 = 5.524, p = 0.0052; n = 5; 4 weeks, t3 = 5.764, p = 0.0104; n = 4 mice). * = p < 0.05; ** = p < 0.01; Scale bars represent 250 µm. Source data are provided as a Source Data file.
Fig. 4
Fig. 4. Hyperactivity of SA induces inflammasome formation.
A SIM-A9 Sec22b−/− cells expressing ASC (apoptosis-associated speck-like protein containing a CARD) -mCerulean (via epifluorescence) show a significantly decreased number of intracellular (white arrows) ASC specks compared to wild type (WT) SIM-A9 cells (unpaired two tailed t-test: t4 = 3.206, p = 0.0327; n = mean derived from three independent in vitro experiments). B In WT SIM-A9 cells knockdown of Ska2 or LPS treatment leads to a significantly increased number of intracellular ASC specks compared to Scr-shRNA or LPS-treated cells (2-way ANOVA: main LPS treatment effect ($), F1,31 = 10.60, p = 0.0027, main Ska2 knockdown effect (*), F1,31 = 5.482, p = 0.0258; n = 9 WT Veh SCR-shRNA, n = 9 WT Veh SKA2-shRNA, n = 9 WT LPS SCR-shRNA, n = 8 WT LPS SKA2-shRNA). C In contrast, knockdown of Ska2 or LPS treatment does not have any effects on the number of ASC specks in SIM-A9 Sec22b−/− cells (2-way ANOVA: n. s. treatment effect F1,29 = 0.312, p = 0.5804, main Ska2 knockdown effect, F1,29 = 0.055, p = 0.8157; n = 9 for SEC22B KO Veh SCR-shRNA and SKA2-shRNA, n = 7 SEC22B KO LPS SCR-shRNA, n = 8 SEC22B KO LPS SKA2-shRNA). D, E Knockdown of Ska2 leads to significantly increased SEC22B binding to SNAP29 (unpaired two tailed t-test: t4 = 4.113, p = 0.0063; n = 4 independent biological replicates) as well as NEK7 binding to NLRP3 in protein lysates of organotypic hippocampal slice cultures (unpaired two tailed t-test: t4 = 2.998, p = 0.0241; n = 4 independent biological replicates). F IHC images of ASC (green) and DAPI (blue) 2 weeks after viral injection (Scr-shRNA-AAV and Ska2-shRNA-1-AAV) into the hippocampus. Quantification of ASC+ cells (left) and ASC specks (right) 2 weeks after viral injection (paired t-test: ASC+ cells, t2 = 6.414, p = 0.0235, ASC specks, t2 = 6.937, p = 0.0202; n = 3 mice). G IHC images of ASC (green) and DAPI (blue) 4 weeks after viral injection (Scr-shRNA-AAV and Ska2-shRNA-1-AAV) into the hippocampus. Quantification of ASC+ cells (left) and ASC specks (right) 4 weeks after viral injection (paired t-test: ASC+ cells, t2 = 8.511, p = 0.0135; ASC specks, t2 = 10.99, p = 0.0082; n = 3 mice). H IHC images of CASPASE-1 (CASP-1) (green) and mCherry (red, viral marker) 2 weeks after viral injection (Scr-shRNA-AAV and Ska2-shRNA-1-AAV) into the hippocampus (left). (right) Quantification of CASP-1 expression 2 weeks after viral injection (paired t-test: t3 = 2.842, p = 0.0655, n = 4 mice). I IHC images of CASP-1 (green) and mCherry (red, viral marker) 4 weeks after viral injection (Scr-shRNA-AAV and Ska2-shRNA-1-AAV) into the hippocampus (left). (right) Quantification of CASP-1 expression 4 weeks after viral injection (paired t-test: t3 = 3.367, p = 0.0435, n = 4 mice). J Full length Gasdermin D (GSDMD FL) levels as well as the ratio of the cleaved N-terminal form of GSDMD (GSDMD N-term) to GSDMD FL are increased 2 weeks after Ska2 knockdown (unpaired two tailed t-test; GSDMD FL/ β-actin: t18 = 4.105, p = 0.0007, GSDMD N-term/GSDMD FL: t18 = 9.259, p < 0.0001; n = 10 independent biological replicates per group). K Examples blots of (E). L Schematic overview of the interaction between secretory autophagy (SA) and the GSDMD-mediated IL-1β release. SKA2 depletion results in increased SA-dependent IL-1β release, serving as a molecular vicious feed-forward loop for inflammasome activation. Inflammasome assembly activates CASP-1 enzymatic function. ASC in the inflammasome complex recruits CASP-1. Activation of CASP-1 cleaves GSDMD to release the N-terminal domain, which forms pores in the plasma membrane for uncontrolled IL-1β release. * = p < 0.05; ** = p < 0.01; *** = p < 0.001, **** = p < 0.0001. Data are presented as mean + SEM. Scale bar represents 5 µm in A, 50 µm in (F, G) (left), 10 µm in (B, F, G) (right), and 250 µm in (H, I). Source data are provided as a Source Data file.
Fig. 5
Fig. 5. Hippocampal Ska2 knockdown leads to cognitive impairment in mice.
In the Y-maze test, mice injected with Scr-shRNA spent significantly more time in the novel arm compared to both familiar arms (A, B). These effects were abolished following Ska2 knockdown (2-way ANOVA: condition × arm interaction, F2,48 = 3.626, p = 0.0342, Tukey’s post hoc test: familiar arm A vs. novel arm, p = 0.0007, familiar arm B vs. novel arm, p < 0.002; n = 9 per group). B In contrast to control animals, Ska2-shRNA mice did not discriminate between a novel and familiar object during the novel object recognition test (unpaired t-test: t15 = 2.840, p = 0.0124; n = 9 Scr-shRNA mice, n = 8 Ska2-shRNA mice). C, D Ska2 knockdown did not alter general locomotor activity in the open field test (unpaired t-test: p > 0.05, n = 9 per group) or anxiety-related behavior in the elevated plus maze (EPM) (unpaired t-test: p > 0.05, n = 8 Scr-shRNA mice, n = 9 Ska2-shRNA mice). * = p < 0.05; ** = p < 0.01; *** = p < 0.001. Data are presented as mean + SEM. Source data are provided as a Source Data file.
Fig. 6
Fig. 6. RNA sequencing analyses following hippocampal knockdown of Ska2 identify transcriptional signatures associated with increased activity of secretory autophagy (SA) and cell death processes.
Deconvolution analysis of the RNA sequencing data (n = 8 per group) at 2 weeks (A) and 4 weeks (B) following hippocampal Ska2 knockdown reveals altered estimated cell proportions in the hippocampus (main cell types shown) (2-way ANOVA: 2 weeks: condition × cell type interaction F5,84 = 23.44, p < 0.0001, Bonferroni’s post hoc test: neuron, p < 0.0001, microglia, p < 0.0001, astrocyte, p = 0.0320, n = 8 per group; 4 weeks: condition × cell type interaction F5,84 = 115.2, p < 0.0001, Bonferroni’s post hoc test: neuron, p < 0.0001, microglia, p < 0.0001, n = 8 per group). * = p < 0.05; **** = p < 0.0001; Data are presented as mean + SEM. Differential gene expression analysis 2 (C) and 4 weeks (D) following hippocampal Ska2 knockdown after correction for changes in the proportion in cell types. Differentially expressed genes (DEGs) (p < 0.05 adjusted with Bonferroni correction) are depicted in dark green (absolute Log2FC < 2) or light green (absolute Log2FC > 2). Magenta data points depict significant differentially expressed interleukins, while orange data points show chemokines and blue data points illustrate cathepsins. Gray data points are not significant (39 data points at 2 weeks and 25 data points at 4 weeks are outside the axis limits; for full list of all DEGs see Supplementary Data 1, 2). Gene expression changes of some known SA cargo proteins at 2 weeks are depicted in the table. E Gene ontology (GO) enrichment analysis with DEGs at 2 weeks. Selected enriched GO terms relevant to SA are depicted (for full list of all GO terms see Supplementary Data 3). Circle size is proportional to the number of genes. BP biological process, CC cellular component, MF molecular function. F Kyoto Encyclopedia of Genes and Genomes (KEGG) pathway enrichment analysis with DEGs at 2 weeks. Circle size is proportional to the number of genes. Source data are provided as a Source Data file.
Fig. 7
Fig. 7. Secretory autophagy is increased in human postmortem Alzheimer’s disease samples.
A SNAP29 co-immunoprecipitation (SKA2 IP) and whole cell extract (WCE) control in amygdala (AMY), hippocampus (HIP), and prefrontal cortex (PFC) human postmortem samples (n = 3). B SKA2 immunostaining in neurons in CA1 stratum pyramidale (left) and microglia in CA1 stratum oriens (right) of the HIP from control subjects (n = 5). C Representative co-immunohistochemistry (IHC) image (left) and quantification (right) of SKA2 (red) and neuronal marker Camk2a (blue) in the HIP (n = 5). D Representative co-IHC image in stratum oriens CA1 of the HIP (left) and quantification (right) of SKA2 (red) and microglia marker IBA1 (blue) (n = 5). EI Co-IHC images of the HIP from control subjects (n = 5 control subjects) depict cells labeled with antibodies against SNAP29, SKA2 or DAPI, and the overlap of the three markers. The colocalization of SKA2 with SNAP29 was observed on the cell-surface and cytoplasm of neurons (F) as well as in microglia (GI). High-resolution images capturing single slices through the z-axis indicate that the majority of SKA2 and SNAP29 labeling is not localized within the DAPI-positive nuclei (H&I). J AD cohort from the Harvard Brain Tissue Resource Center (Ctrl n = 13 (8M/5F), AD n = 7 (4M/3F)): SKA2 protein expression (left) is significantly decreased in the hippocampus of AD subjects (ANCOVA: F1,19 = 6.9123, p = 0.0170) while SEC22B binding to SNAP29 (right) is significantly increased in hippocampus tissue of AD subjects (ANCOVA: F1,19 = 5.6769, p = 0.0284). K AD cohort from the Manchester Brainbank (Ctrl n = 37 (10M/27F), AD n = 40 (14M/26F)): SKA2 protein expression (left) is significantly decreased in the prefrontal cortex (PFC) of AD subjects (ANCOVA: F1,76 = 6.4994, p = 0.0128). SEC22B binding to SNAP29 (middle) as well as NEK7 binding to NLRP3 (right) is significantly increased in PFC tissue of the top 12 low (5M/7F) compared to the top 12 high (5M/7F) SKA2 expressing AD subjects (ANCOVA: SEC22B to SNAP29: F1,23 = 2.411, p = 0.0247, NEK7 to NLRP3: F1,23 = 3.696, p = 0.0013). * = p < 0.05; data are presented as mean ± SEM. Scale bars represent 50 µm for (B, D), 100 µm for (C), and 20 µm for (EI). Source data are provided as a Source Data file.

Update of

References

    1. Salter M, Stevens B. Microglia emerge as central players in brain disease. Nat. Med. 2017;23:1018–1027. doi: 10.1038/nm.4397. - DOI - PubMed
    1. Madore C, Yin Z, Leibowitz J, Butovsky O. Microglia, lifestyle stress, neurodegeneration. Immunity. 2020;52:222–240. doi: 10.1016/j.immuni.2019.12.003. - DOI - PMC - PubMed
    1. Heneka MT, McManus RM, Latz E. Inflammasome signalling in brain function and neurodegenerative disease. Nat. Rev. Neurosci. 2018;19:610–621. doi: 10.1038/s41583-018-0055-7. - DOI - PubMed
    1. Prinz M, Jung S, Priller J. Microglia biology: one century of evolving concepts. Cell. 2019;179:292–311. doi: 10.1016/j.cell.2019.08.053. - DOI - PubMed
    1. Dupont N, et al. Autophagy-based unconventional secretory pathway for extracellular delivery of IL-1β. EMBO J. 2011;30:4701–4711. doi: 10.1038/emboj.2011.398. - DOI - PMC - PubMed