. 2024 Mar 25;15(1):2412.
doi: 10.1038/s41467-024-46702-0.

Fire suppression makes wildfires more severe and accentuates impacts of climate change and fuel accumulation

Affiliations

Fire suppression makes wildfires more severe and accentuates impacts of climate change and fuel accumulation

Mark R Kreider et al. Nat Commun. .

Abstract

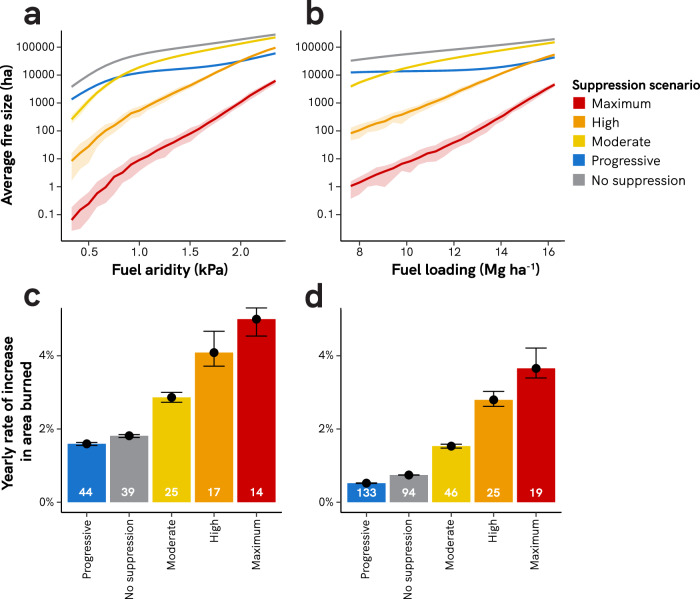
Fire suppression is the primary management response to wildfires in many areas globally. By removing less-extreme wildfires, this approach ensures that remaining wildfires burn under more extreme conditions. Here, we term this the "suppression bias" and use a simulation model to highlight how this bias fundamentally impacts wildfire activity, independent of fuel accumulation and climate change. We illustrate how attempting to suppress all wildfires necessarily means that fires will burn with more severe and less diverse ecological impacts, with burned area increasing at faster rates than expected from fuel accumulation or climate change. Over a human lifespan, the modeled impacts of the suppression bias exceed those from fuel accumulation or climate change alone, suggesting that suppression may exert a significant and underappreciated influence on patterns of fire globally. Managing wildfires to safely burn under low and moderate conditions is thus a critical tool to address the growing wildfire crisis.


Conflict of interest statement

The authors declare no competing interests.

Figures

Fig. 1
Fig. 1. Conceptual diagram of how suppression influences fire.
a Potential fire behavior depends on the fire triangle (topography, weather, fuel) and ignitions. Intentional ignitions (i.e., prescribed fires and cultural burning) do not pass through the suppression filter, as they are allowed to burn unimpeded if within prescription. Unplanned human ignitions and lightning ignitions only burn if they successfully pass through the “suppression filter.” Fire “removed” by the suppression filter leads to fuel accumulation, influencing fires from all ignition types (suppression paradox, brown color). Wildfires that do burn are biased toward the fire that was not removed (suppression bias, red). These wildfires, together with intentional fires, form the realized fire regime with the suppression paradox and suppression bias inherently incorporated. b The suppression filter. 1) Initial attack success probability as a function of fireline intensity and fire size at initial attack (from Hirsch et al.); 2) Proportion of escaped fire suppressed as a function of fire intensity. Suppression becomes increasingly impossible at high fire intensities. Colors depict the suppression scenarios used in the simulation. c Fire perimeters (viewed from overhead) after the first day of burning for an example ignition. Colors correspond to suppression scenarios shown in panel b. Fire intensity of the burned area is displayed with a color ramp.
Fig. 2
Fig. 2. Effects of fire suppression on fire severity.
Panels a and b show the proportion of high-severity fire (CBI > 2.25) across ranges of fuel aridity and fuel loading. Panels c and d show mean fire severity across ranges of fuel aridity and fuel loading. Insets show the average number of years of modeled climate change (vapor pressure deficit increase of 0.008 kPa yr−1) or fuel accumulation (100-h fuel accumulation rate of 0.036 Mg ha−1 yr−1) to yield the difference in fire severity between suppressed and unsuppressed fires. Variability across the 40 simulation replications is shown with 95% confidence intervals (too small to see for some) or error bars (insets on c and d). Fuel loading in panel b and d depicts 100-h surface fuel loading values. Simulations across the fuel aridity range were run at a constant 100-h surface fuel loading of 11.23 Mg ha−1; simulations across the fuel loading range were run at constant mean fire season vapor pressure deficit of 1.17 kPa.
Fig. 3
Fig. 3. Effects of fire suppression on burned area increase.
Panels a and b show trends in average fire size across ranges of fuel aridity and fuel loading. Fuel loading in panel b depicts 100-h surface fuel loading values. Yearly rates of increase in panels c and d are calculated with a yearly increase in fuel aridity of 0.008 kPa yr−1 or a yearly increase in fuel accumulation (100-h fuel accumulation rate) of 0.036 Mg ha−1 yr−1, respectively. White numbers at the base of bars are the doubling time, in years, of burned area. Variability across the 40 simulation replications is shown with 95% confidence intervals (a and b; too small to see on some curves) or error bars (c and d). Simulations across the fuel aridity range were run at a constant 100-h surface fuel loading of 11.23 Mg ha−1; simulations across the fuel loading range were run at constant mean fire season vapor pressure deficit of 1.17 kPa.
Fig. 4
Fig. 4. Effects of fire suppression on diversity of fire effects.
Panels a and b show the effects of fire suppression on the diversity of fire effects across ranges of fuel aridity and fuel loading. Diversity of fire effects is calculated as the mean absolute deviation of fire severity (CBI) sensu Steel and colleagues. Fuel loading in panel b depicts 100-h surface fuel loading values. Simulations across the fuel aridity range were run at a constant 100-h surface fuel loading of 11.23 Mg ha−1; simulations across the fuel loading range were run at constant mean fire season vapor pressure deficit of 1.17 kPa. c Lorenz curves for each suppression scenario; fires are ranked by increasing area burned. Simulations run at mean seasonal vapor pressure deficit of 1.17 kPa and fuel loading of 11.23 Mg ha−1 (100-h fuel load). The dashed line represents hypothetical fire activity where the area burned is spread equally across all fire days. Variability across the 40 simulation replications is shown with 95% confidence intervals but which are too small to see for some curves.

References

    1. Balch JK, et al. Warming weakens the night-time barrier to global fire. Nature. 2022;602:442–448. doi: 10.1038/s41586-021-04325-1. - DOI - PubMed
    1. Ellis TM, Bowman DMJS, Jain P, Flannigan MD, Williamson GJ. Global increase in wildfire risk due to climate-driven declines in fuel moisture. Glob. Change Biol. 2022;28:1544–1559. doi: 10.1111/gcb.16006. - DOI - PubMed
    1. Bowman DMJS, et al. Vegetation fires in the Anthropocene. Nat. Rev. Earth Environ. 2020;1:500–515. doi: 10.1038/s43017-020-0085-3. - DOI
    1. Xu R, et al. Wildfires, Global Climate Change, and Human Health. N. Engl. J. Med. 2020;383:2173–2181. doi: 10.1056/NEJMsr2028985. - DOI - PubMed
    1. Iglesias V, et al. Fires that matter: reconceptualizing fire risk to include interactions between humans and the natural environment. Environ. Res. Lett. 2022;17:045014. doi: 10.1088/1748-9326/ac5c0c. - DOI