

Detecting abnormal cell behaviors from dry mass time series
- PMID: 38528035
- PMCID: PMC11350042
- DOI: 10.1038/s41598-024-57684-w
Detecting abnormal cell behaviors from dry mass time series
Abstract
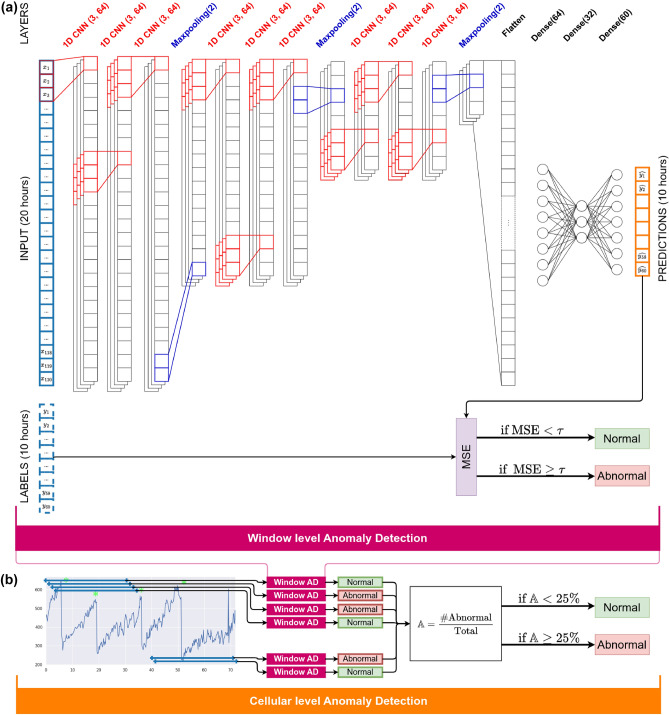
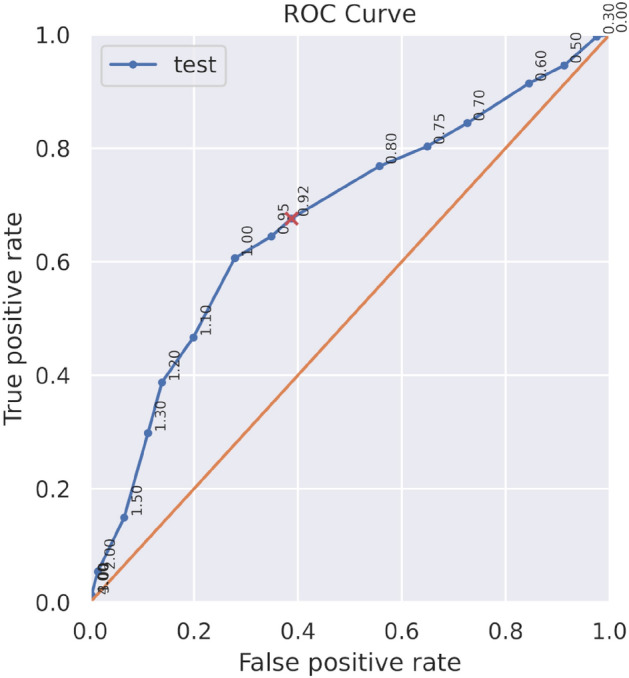
The prediction of pathological changes on single cell behaviour is a challenging task for deep learning models. Indeed, in self-supervised learning methods, no prior labels are used for the training and all of the information for event predictions are extracted from the data themselves. We present here a novel self-supervised learning model for the detection of anomalies in a given cell population, StArDusTS. Cells are monitored over time, and analysed to extract time-series of dry mass values. We assessed its performances on different cell lines, showing a precision of 96% in the automatic detection of anomalies. Additionally, anomaly detection was also associated with cell measurement errors inherent to the acquisition or analysis pipelines, leading to an improvement of the upstream methods for feature extraction. Our results pave the way to novel architectures for the continuous monitoring of cell cultures in applied research or bioproduction applications, and for the prediction of pathological cellular changes.
© 2024. The Author(s).
Conflict of interest statement
The authors declare no competing interests.
Figures


Similar articles
-
Health Monitoring of Air Compressors Using Reconstruction-Based Deep Learning for Anomaly Detection with Increased Transparency.Entropy (Basel). 2021 Jan 8;23(1):83. doi: 10.3390/e23010083. Entropy (Basel). 2021. PMID: 33435637 Free PMC article.
-
Weakly Semi-supervised phenotyping using Electronic Health records.J Biomed Inform. 2022 Oct;134:104175. doi: 10.1016/j.jbi.2022.104175. Epub 2022 Sep 5. J Biomed Inform. 2022. PMID: 36064111 Free PMC article.
-
Self-Supervision-Augmented Deep Autoencoder for Unsupervised Visual Anomaly Detection.IEEE Trans Cybern. 2022 Dec;52(12):13834-13847. doi: 10.1109/TCYB.2021.3127716. Epub 2022 Nov 18. IEEE Trans Cybern. 2022. PMID: 34851847
-
Unsupervised and self-supervised deep learning approaches for biomedical text mining.Brief Bioinform. 2021 Mar 22;22(2):1592-1603. doi: 10.1093/bib/bbab016. Brief Bioinform. 2021. PMID: 33569575 Review.
-
Data-driven modeling and prediction of blood glucose dynamics: Machine learning applications in type 1 diabetes.Artif Intell Med. 2019 Jul;98:109-134. doi: 10.1016/j.artmed.2019.07.007. Epub 2019 Jul 26. Artif Intell Med. 2019. PMID: 31383477 Review.
References
-
- Soelistyo, C. J., Vallardi, G., Charras, G. & Lowe, A. R. Learning biophysical determinants of cell fate with deep neural networks. Nature Mach. Intell.4, 636–644. 10.1038/s42256-022-00503-6 (2022).10.1038/s42256-022-00503-6 - DOI
-
- Soelistyo, C. J., Vallardi, G., Charras, G. & Lowe, A. R. Learning the Rules of Cell Competition Without Prior Scientific Knowledge10.1101/2021.11.24.469554 (2021).
-
- Allier, C. et al. CNN-based cell analysis: From image to quantitative representation. Front. Phys.9 (2022).
MeSH terms
Grants and funding
LinkOut - more resources
Full Text Sources
