. 2024 Mar 25;15(1):2345.
doi: 10.1038/s41467-024-45870-3.

IKK2 controls the inflammatory potential of tissue-resident regulatory T cells in a murine gain of function model

Affiliations

IKK2 controls the inflammatory potential of tissue-resident regulatory T cells in a murine gain of function model

Chelisa Cardinez et al. Nat Commun. .

Abstract

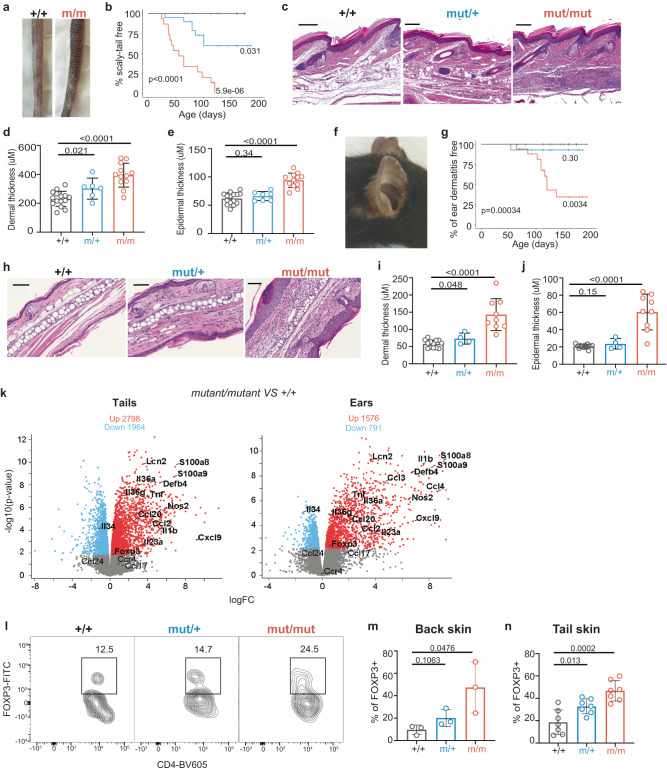
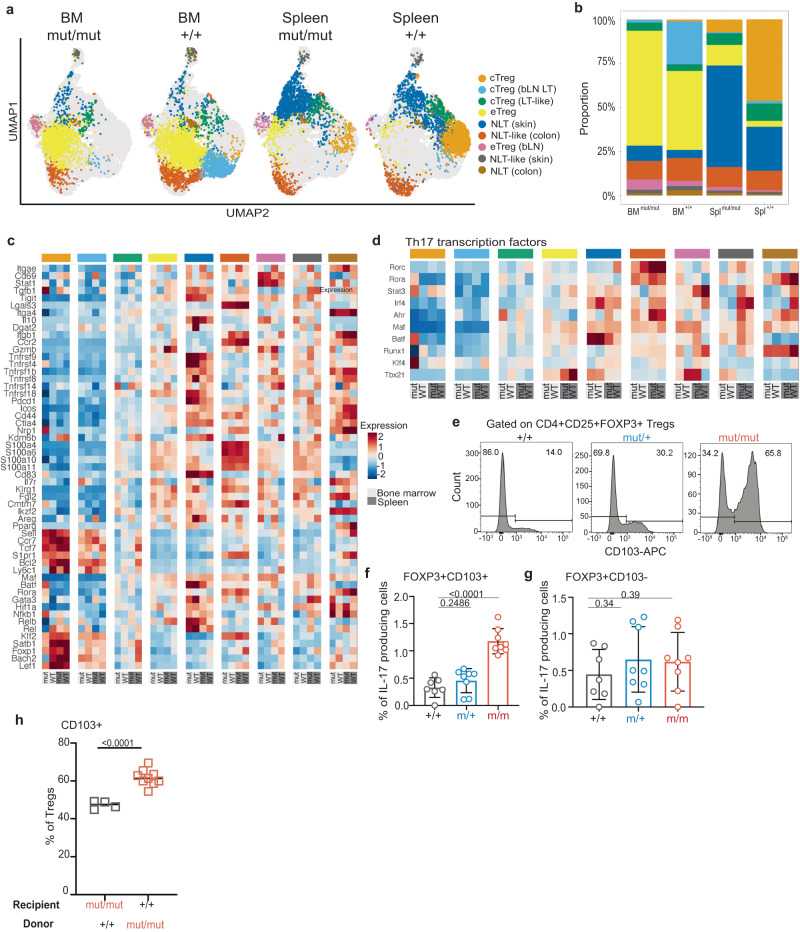
Loss-of-function mutations have provided crucial insights into the immunoregulatory actions of Foxp3+ regulatory T cells (Tregs). By contrast, we know very little about the consequences of defects that amplify aspects of Treg function or differentiation. Here we show that mice heterozygous for an Ikbkb gain-of-function mutation develop psoriasis. Doubling the gene dose (IkbkbGoF/GoF) results in dactylitis, spondylitis, and characteristic nail changes, which are features of psoriatic arthritis. IkbkbGoF mice exhibit a selective expansion of Foxp3 + CD25+ Tregs of which a subset express IL-17. These modified Tregs are enriched in both inflamed tissues, blood and spleen, and their transfer is sufficient to induce disease without conventional T cells. Single-cell transcriptional and phenotyping analyses of isolated Tregs reveal expansion of non-lymphoid tissue (tissue-resident) Tregs expressing Th17-related genes, Helios, tissue-resident markers including CD103 and CD69, and a prominent NF-κB transcriptome. Thus, IKK2 regulates tissue-resident Treg differentiation, and overactivity drives dose-dependent skin and systemic inflammation.


Conflict of interest statement

The Authors declare no competing interests.

Figures

Fig. 1
Fig. 1. Overactive IKK2 leads to psoriasis.
Representative images (a) and Kaplan-Meier plots of cumulative incidence (b) of tail pathology in Ikbkb+/+ (n = 13), Ikbkbmut/+ (n = 19) and Ikbkbmut/mut (n = 15) mice. Tail skin pathology revealed by representative images of skin sections stained with H&E (scale bar, 200 μm) (c), and summaries of dermal (d) and epidermal thicknesses (e). Ikbkb+/+, n = 15; Ikbkbmut/+, n = 7, Ikbkbmut/mut, n = 12. Ear skin pathology revealed by a representative image from an Ikbkbmut/mut mouse (f), Kaplan-Meier plots of cumulative incidence of dermatitis by genotype (g) (n = 13-18/genotype), representative images of sections of ear skin stained with H&E (scale bar, 100 μm) (h), and summaries of dermal (i) and epidermal thicknesses (j). Ikbkb+/+, n = 15; Ikbkbmut/+, n = 4; Ikbkbmut/mut, n = 9. k Volcano plot depicting differentially expressed genes in Ikbkbmut/mut and Ikbkb+/+ mice from tail and ear skin (n = 3/genotype). Red dots represent genes highly expressed in mutants relative to wild type while blue dots represent genes lowly expressed in mutants relative to wild type. Gene expression was normalized using trimmed mean of M values and differentially expressed genes were identified with a Benjamini–Hochberg adjusted p value < 0.05. Flow cytometric analysis of Foxp3 expression by CD4+ T cells from skin for indicated Ikbkb genotypes, with representative plots (l), enumeration of Tregs as a proportion of CD4+ T cells from back skin (n = 3/genotype) (m) and tail skin (n) (n = 7/genotype). Summary graphs are presented as mean +/− s.d. Kaplan-Meier curves: log-rank (Mantel-Cox) test; Frequency histograms, one-way ANOVA with Bonferroni’s multiple comparison test.
Fig. 2
Fig. 2. Double dose of Ikbkbmut results in systemic inflammation and psoriatic arthritis.
Arthritis shown by representative images of dactylitis in an Ikbkbmut/mut mouse compared with a Ikbkb+/+ control (a, b) and Kaplan-Meier plots of cumulative incidence of limb arthritis by genotype (c). Ikbkb+/+, n = 32; Ikbkbmut/mut, n = 11; Ikbkbmut/+, n = 17. d. Representative radiographs of limbs from Ikbkb+/+ and Ikbkbmut/mut mice. Asterisk indicates abnormal skeletal structure. e Representative images of fore limb (FL) digits and long bones stained by H&E. f Histological survey of mice by genotype showing sections of nails (top row), ankles (second row), tail vertebrae (third row), and lungs (fourth row) all stained by H&E. Scale bars, 200 μm. Ikbkb+/+, n = 3; Ikbkbmut/+, n = 4; Ikbkbmut/mut, n = 3 (d, f). Statistical analysis of Kaplan-Meier plots by log-rank (Mantel-Cox) test.
Fig. 3
Fig. 3. IL-17-producing Treg population arises in mice with an Ikbkb GoF variant.
a Summary of lymphocyte counts from spleens from Ikbkb mice and C57Bl/6 controls. C57Bl/6, n = 6; Ikbkb+/+, n = 7; Ikbkbmut/+, n = 8; Ikbkbmut/mut, n = 3. Flow cytometric analysis of Helios and Foxp3 expression by splenic CD4+ T cells for each genotype, with representative plots (b) and a summary of the proportion of Helios+ Foxp3+ Tregs by Ikbkb genotype (c). Ikbkb+/+, n = 7; Ikbkbmut/+, n = 6; Ikbkbmut/mut, n = 7. Analysis of mixed bone marrow chimeras constructed, showing the experimental design (d), gating strategy for allotype-marked splenic Foxp3+ CD4+ Treg cells (e), and results for the Foxp3+ Treg cells expressed as proportions of splenocytes (f). Ikbkb+/+, n = 11;, Ikbkbmut/+, n = 8, Ikbkbmut/mut, n = 8 from two independent experiments. Intracellular expression of IFNγ and IL-17A by CD4+ T cells by Ikbkb genotype, showing representative plots (g) and summary results (h). Ikbkb+/+, n = 7;, Ikbkbmut/+, n = 10, Ikbkbmut/mut, n = 9. Induction of IFNγ and IL-17A expression after culturing naïve CD4+ T cells under Th17-inducing conditions showing representative flow cytometric analysis (i) and summary results (j) (n = 5–6 biological replicates/genotype). Ex vivo expression of IL-17A (k, l) and IFNγ (k, m) by splenic Foxp3 + CD4+ T cells, showing representative flow cytometric analysis (k) and summary results (l, m), n = 10/genotype. Analysis of IL-17A and Foxp3 expression by CD4+ cells recovered from tail skin, showing representative flow cytometric analysis (n) and summaries of IL-17A+ (o) and IFNγ+ (p) Foxp3+ lymphocytes as a proportion of CD45+ cells, n = 6-7/genotype. q Representative flow cytometric histograms of Foxp3 expression by CD3 + IL-17A+ cells from skin. r Summary of geometric mean fluorescence intensity (gMFI) of Foxp3 expression in IL-17A + CD3+ cells. Summary graphs are from 2-3 independent experiments and show mean +/− s.d. Tests of statistical significance were performed by one-way ANOVA with Bonferroni’s multiple comparison test. Each symbol represents a biological replicate.
Fig. 4
Fig. 4. Foxp3 + CD4+ T cells retain suppressive function.
a, b Flow cytometric evaluation of conventional T cell proliferation by CTV dilution during coculture with Tregs. Representative histograms indicate the proportion of live cells that have completed >1 division for each Treg genotype (a) and summary of inhibition (b). Representative of 2 independent experiments. Adoptive transfer experiment showing experimental design (c), change in body mass after adoptive transfer of cells from indicated strains (d, e). Each line represents results from one mouse, n = 3-4 per group (defined as shown). Comparison at week 6 post-transfer by two-tailed unpaired t-tests. f Representative histology of colon samples, H&E staining. Scale bars, 50 μm. n = 4 per group.
Fig. 5
Fig. 5. Treg expansion results from a T cell-intrinsic action of Ikbkbmut.
Reciprocal bone marrow chimera experiment (Ikbkbmut/mut recipients, n = 4; Ikbkb+/+ recipients, n = 9), showing experimental design (a), proportions of CD25+Foxp3+ Tregs in indicated chimeric strains (b), serum IL-17A, TNFα and IFNγ concentrations (c) (p values from Student’s t-tests), and representative histology of tail, tarsals, and ankles of chimeras (scale bars, 1000 μm for tails and tarsals, 500 μm for ankles) (d). The transparent bar in b shows mean Treg proportions observed in intact Ikbkb+/+ mice (grey) and Ikbkbmut/mut mice (red) for comparison (as shown in Fig. 1e). Adoptive transfer experiment showing experimental design (e), Kaplan-Meier plots of mice remaining free of ear dermatitis after adoptive transfer of sorted Ikbkbmut/mut x Foxp3-GFP Tregs (f). Representative images (g) and sections of ears and digits stained by H&E after second phase transfer of Ikbkbmut/mut Tregs (h). Scale bars, ears, 200 μm; digits, 500 μm. n = 3 per group. Comparison of Kaplan Meier curves was performed using a log-rank test.
Fig. 6
Fig. 6. Ikbkbmut Tregs are modified non-lymphoid tissue skin Tregs.
a UMAP plot of scRNASeq analysis of spleen and bone marrow CD4+ Foxp3GFP Tregs sorted from Ikbkb+/+ and Ikbkbmut/mut mice (n = 3 per genotype). Cells are highlighted by cluster. b Summary of each cluster as a proportion of all cells within the sample. c Average gene expression of established markers for each identified Treg cluster from Ikbkb+/+ and Ikbkbmut/mut mice identified in spleen and bone marrow. Clusters are based on references,. cTreg = central Treg, eTreg = effector Treg, LT = lymphoid tissue, NLT = non-lymphoid tissue, bLN = brachial lymph nodes. Lower panel: light grey, bone marrow; dark grey, spleen. d Average gene expression levels of established markers from Th17 transcription factor program within each cell population of every Treg sample. Lower panel: light grey, bone marrow; dark grey, spleen. e Representative flow cytometric histograms of CD103 expression, gated on CD4+ CD25+ Foxp3+ Tregs from spleen. Summaries of IL-17 producing CD103+ Tregs (CD103+Foxp3+) (f) and IL-17 producing CD103- Tregs (CD103-Foxp3+) (g) from spleen. Ikbkb+/+, n = 7; Ikbkbmut/+, n = 8; Ikbkbmut/mut, n = 8. h Proportion of CD103+ Tregs from chimeras. Ikbkbmut/mut recipients, n = 4, Ikbkb +/+ recipients, n = 9. Summary graphs show means +/- s.d. One-way ANOVA with Bonferroni’s multiple comparison test (f, g) and Student’s t-test (h).
Fig. 7
Fig. 7. NF-kB transcriptome of non-lymphoid tissue skin Tregs.
a Average gene expression of skin NLT genes,. Lower panel: light grey, bone marrow; dark grey, spleen. b Hallmark pathway analysis showing top 10 ranked significant pathways (defined by normalized enrichment score – NES) in NLT (skin) Treg cluster either up- or down-regulated. c Barcode plot showing upregulation of genes in Hallmark pathway TNFA_Signaling_Via_NF-κB in NLT (skin) Treg cluster. NES = 2.1722, p adj = 0. p values for a collection of gene sets was determined by the fast pre-ranked gene set enrichment analysis (adjusted p-value cut-off = 0.05). d Average gene expression of NF-kB-dependent genes from reference (GSEA systemic name: M14435). Lower panel: light grey, bone marrow; dark grey, spleen.

References

    1. Fontenot JD, Gavin MA, Rudensky AY. Foxp3 programs the development and function of CD4+CD25+ regulatory T cells. Nat. Immunol. 2003;4:330–336. doi: 10.1038/ni904. - DOI - PubMed
    1. Hori S, Nomura T, Sakaguchi S. Control of regulatory T cell development by the transcription factor Foxp3. Science. 2003;299:1057–1061. doi: 10.1126/science.1079490. - DOI - PubMed
    1. Rudensky AY. Regulatory T cells and Foxp3. Immunol. Rev. 2011;241:260–268. doi: 10.1111/j.1600-065X.2011.01018.x. - DOI - PMC - PubMed
    1. Sakaguchi S, Yamaguchi T, Nomura T, Ono M. Regulatory T cells and immune tolerance. Cell. 2008;133:775–787. doi: 10.1016/j.cell.2008.05.009. - DOI - PubMed
    1. Kieback E, et al. Thymus-derived regulatory T cells are positively selected on natural self-antigen through cognate interactions of high functional avidity. Immunity. 2016;44:1114–1126. doi: 10.1016/j.immuni.2016.04.018. - DOI - PubMed