. 2024 Apr;43(8):1420-1444.
doi: 10.1038/s44318-024-00067-8. Epub 2024 Mar 25.

Regulation of Zbp1 by miR-99b-5p in microglia controls the development of schizophrenia-like symptoms in mice

Affiliations

Regulation of Zbp1 by miR-99b-5p in microglia controls the development of schizophrenia-like symptoms in mice

Lalit Kaurani et al. EMBO J. 2024 Apr.

Abstract

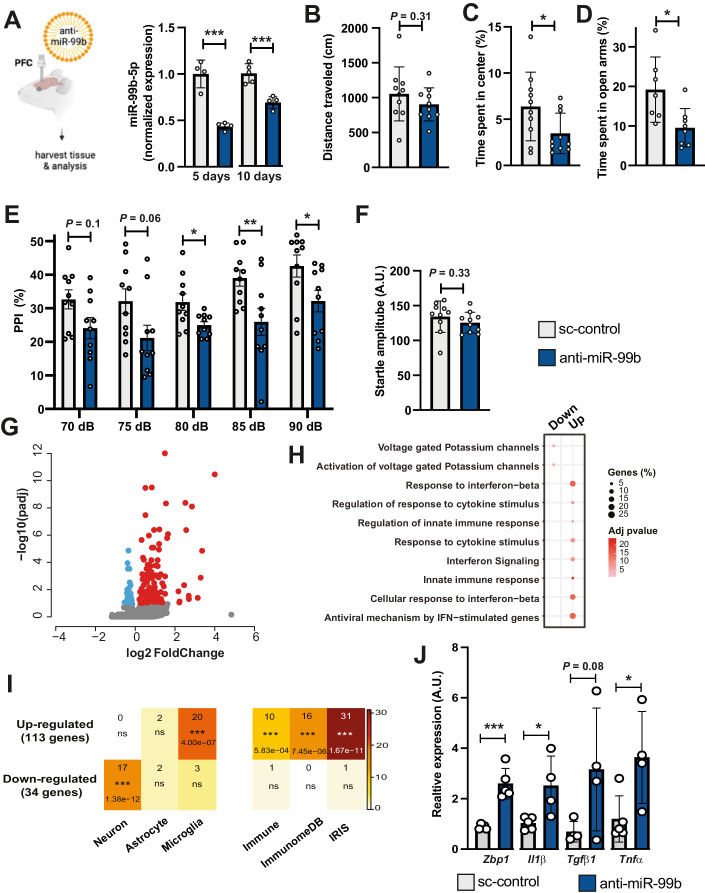
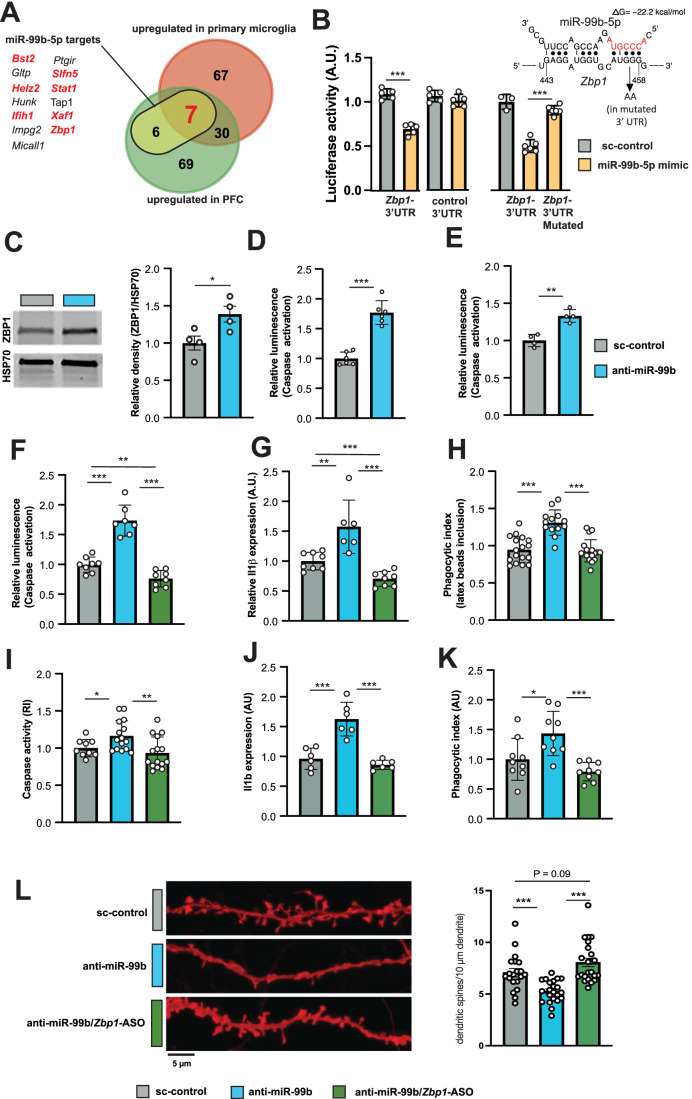
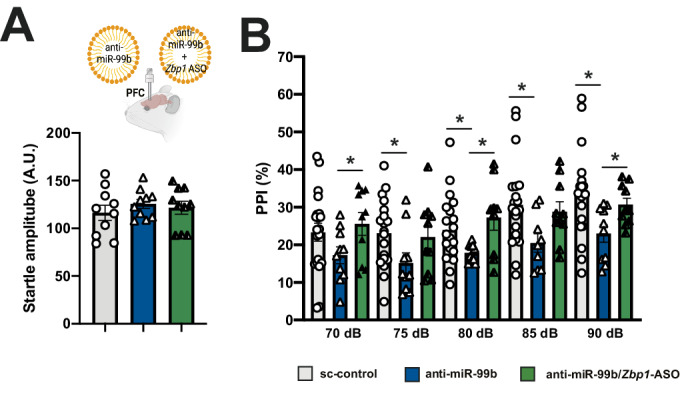
Current approaches to the treatment of schizophrenia have mainly focused on the protein-coding part of the genome; in this context, the roles of microRNAs have received less attention. In the present study, we analyze the microRNAome in the blood and postmortem brains of schizophrenia patients, showing that the expression of miR-99b-5p is downregulated in both the prefrontal cortex and blood of patients. Lowering the amount of miR-99b-5p in mice leads to both schizophrenia-like phenotypes and inflammatory processes that are linked to synaptic pruning in microglia. The microglial miR-99b-5p-supressed inflammatory response requires Z-DNA binding protein 1 (Zbp1), which we identify as a novel miR-99b-5p target. Antisense oligonucleotides against Zbp1 ameliorate the pathological effects of miR-99b-5p inhibition. Our findings indicate that a novel miR-99b-5p-Zbp1 pathway in microglia might contribute to the pathogenesis of schizophrenia.

Keywords: Microglia; Schizophrenia; Zbp1; miR-99b; microRNA.


Conflict of interest statement

The authors declare no competing interests.

Figures

Figure 1
Figure 1. Identification of microRNAs that play a role in the pathogenesis of SZ.
(A) Experimental scheme. (B) Violin plots showing the results of WGCNA analysis. Depicted is the comparison of the eigenexpression in the 3 co-expression modules in SZ patients (n = 242) and in control (n = 331), showing a decrease in SZ patients. The ‘n’ value for each module indicates the number of associated microRNAs. (C) Violin plots showing the results of WGCNA analysis. The eigenexpression of the 5 co-expression modules was higher in SZ patients than in controls. The ‘n’ value for each module indicates the number of associated microRNAs (for (B) and (C): unpaired t test; **P  <  0.01, ***P  <  0.001; ****P  <  0.0001, a P value < 0.01 was considered as significant). (D) Heat map showing the correlation of the eigenexpression of the co-expression modules shown in (A) and (B) with the corresponding clinical phenotypes. The numbers in each rectangle represent the correlation (upper number) and the corresponding p-value (lower number). A P value < 0.01 was considered as significant. (E) Volcano plot depicting the results of the differential expression analysis when comparing miRs in blood samples from SZ patients (n = 242) and controls (n = 331) shown in (A) (FDR < 0.01, log2FC > 1). (F) Volcano plot demonstrating the results of the differential expression analysis when comparing miRs from postmortem brain samples from SZ patients (n = 13) and controls (n = 17) (FDR < 0.01, log2FC > 1). (G) Venn diagram comparing the microRNAs detected in blood samples when performing differential expression analysis (Blood DESEQ2_DE), the microRNAs of the ME_Turquoise and ME_Pink co-expression modules and the microRNAs differentially expressed when comparing postmortem brain tissue (brain_DE). miR-99b-5p is the only microRNA decreased in all comparisons. (H) Heat map showing the correlation of miR-99b-5p expression levels to the clinical phenotypes for the individuals as analyzed in (A). The numbers in each rectangle represent the correlation (upper number) and the corresponding p-value (lower number). Data information: In the violin plots in (B, C), the body illustrates the distribution of the data, showing both density and range. The centerline indicates the median, while the thickness of the plot represents the density of the data at different values. Source data are available online for this figure.
Figure 2
Figure 2. Decreasing miR-99b-5p levels in the PFC of mice leads to SZ-like phenotypes and increases the expression of genes linked to microglia activation.
(A) Left panel: Experimental design. Right panel: Bar graph showing qPCR results for miR-99b-5p in tissue obtained from the PCF of mice 5 or 10 days after injection of anti-miR-99b or sc-control oligonucleotides (n = 4/group; ***P  <  0.001, unpaired t test, Error bars indicate SD). (B) Bar graph showing the distance traveled in the open field test of mice injected to the PFC with either anti-miR-99b or sc-control oligonucleotides (n = 10/group; unpaired t test; Error bars indicate SD). (C) Bar graph showing the time spent in the center of the open field in mice injected to the PFC with either anti-miR-99b or sc-control oligonucleotides (n = 10/group; *P < 0.05; unpaired t test; Error bars indicate SD). (D) Bar graph showing the time spent in the open arms when an elevated plus maze test was performed in mice injected to the PFC with either anti-miR-99b or sc-control oligonucleotides (n = 10/group; *P < 0.05; unpaired t test; Error bars indicate SD). (E) Bar graph showing the results of a PPI experiment of mice injected with either anti-miR-99b or sc-control oligonucleotides. A repeated-measures ANOVA was run to test whether anti-mir-99b had any effects on PPI at different intensity levels. Given that we observed a statistically significant effect, F(2.6,47.8) = 5.7, *P < 0.05, we conclude that PPI is affected in anti-miR-99b injected mice. To further reinforce this finding, the panel further shows post hoc unpaired t-tests applied independently at each indicated dB level (n = 10/group); *P  <  0.05; **P  <  0.01; Error bars indicate SD (F). Bar graph showing the basic startle response among groups (n = 10/group; unpaired t test; Error bars indicate SD). (G) Volcano plot showing the differentially expressed genes (upregulated in red, downregulated in blue) when RNA-seq was performed from the PFC of mice injected with either anti-miR-99b or sc-control oligonucleotides. Genes with log2-fold change ± 0.5 and adjusted p value < 0.05 are highlighted (n = 3/group, Wald test:Deseq2). RNA seq was performed from individual mice. (H) GO-term analysis of the upregulated genes found in (E). (I) Heat maps showing the enrichment of the upregulated genes as determined in (E) in various datasets. Left panel shows that the upregulated genes are enriched for microglia-specific genes, while the downregulated genes are enriched for neuron-specific genes. The right panel shows that the upregulated genes are over-represented in 3 different databases for immune function-related genes (Fisher’s exact test). (J) Bar graph showing the qPCR results of the Zbp1, Il1ß, Tgfb1, and Tnfa genes in FACS-sorted microglia collected from the PFC of mice injected with anti-miR-99b or sc-control oligonucleotides (n = 4 or 5/group; unpaired t test; *P  <  0.05; ***P  <  0.001). Error bars indicate SD. Data information: Bars and error bars in panels (BF, J) indicate mean ± SD. Source data are available online for this figure.
Figure 3
Figure 3. Decreasing miR-99b-5p levels in microglia increases phagocytosis and reduces synapse number in cortical neurons.
(A) Left panel: Experimental design. (B) Volcano plot showing differential expressed genes when comparing microglia treated with anti-miR-99b or sc-control LNAs. Genes with statistical significance are highlighted. (C) Bar chart showing the top GO terms represented by the upregulated genes shown in (B) (ClueGO v2.2.5 plugin of Cytoscape 3.2.1 was used. Two-sided hypergeometric test was used to calculate the importance of each term and the Benjamini-Hochberg procedure was applied for the P value correction.). (D) Bar charts showing qPCR results for Tgfb1, Il1ß, and Tnfa comparing microglia treated with anti-miR-99b or sc-control LNAs (n = 6/group; unpaired t test; *P  <  0.05; **P  <  0.01, ****P  <  0.0001; Error bars indicate SEM). (E) Bar chart showing the results of a phagocytosis assay performed in microglia treated with anti-miR-99b in comparison to cells treated with sc-control LNAs. The percentage of phagocytic index represents (# of total engulfed beads in an image/# of total cells identified in an image; n = 13 independent experiments; unpaired t test; **P  <  0.01; Error bars indicate SEM). (F) Experimental scheme illustrating the co-culture experiment. (G) Heat map showing the differentially expressed genes from the experiment described in (F). (H) Plot showing the results of a GO term analysis for the up- and downregulated genes displayed in (G) (ClueGO v2.2.5 plugin of Cytoscape 3.2.1 was used. Two-sided hypergeometric test was used to calculate the importance of each term and the Benjamini-Hochberg procedure was applied for the P value correction.). (I) Left panel: Representative image showing DIL dye staining to visualize dendritic spines in co-cultures as illustrated in (F). Scale bar 5 μm. Right panel: Bar chart showing the statistical quantification (spines/10 µm dendrite) of the data depicted in (I). Data was analyzed using tTest. ****P  <  0.0001). Error bars indicate SD. Data information: Bars and error bars in panels (D, E, I) indicate mean ± SEM. Source data are available online for this figure.
Figure 4
Figure 4. miR-99b-5p regulates neuroinflammatory phenotypes via Zbp1.
(A) Venn diagram comparing the genes upregulated in the PFC of mice and in primary microglia when injected or treated with anti-miR99b vs. sc-control LNAs, respectively. The data is further compared to the identified 13 miR-99b-5p target mRNAs detected in the PFC dataset. The left panel shows the gene names of the 13 miR-99b-5p target mRNAs. Red indicates miR-99b-5p targets upregulated in the PCF and in primary microglia upon anti-miR-99b treatment. (B) Bar graphs showing the results of the luciferase assay. Left panel: In comparison to sc-control LNAs, administration of miR-99b-5p mimic decreases luciferase activity when cells express the Zbp1-3’UTR. This effect is not observed when a control 3’UTR that does not bind miR-99b-5p is used (n = 6/group; t-Test; ***P  <  0.001). Right panel: Similarly, the inhibitory effect of miR99b-5p mimic is not observed when we mutated the miR99b-5p seed region within the 3’ UTR of Zbp1. One-way ANOVA revealed a significant difference among the groups (p < 0.0001). Subsequent pairwise t-tests were performed to examine specific group differences. The upper right panel shows the predicted binding of miR-99b-5p to the 3’UTR of Zbp1. The mutation GG → AA with respect to the data shown in the right panel is indicated by an arrow. (C) Left panel: Representative immunoblot image showing ZBP1 levels in microglia treated with sc-control LNAs or anti-miR-99b. HSP70 was used as a loading control. Right panel: Bar graph showing the quantification of the data depicted in the left panel (n = 4/group; unpaired t test; *P  <  0.05). (D) Bar graph showing quantification of caspase activity in primary microglia treated with sc-control LNAs or anti-miR-99b (n = 6/group; unpaired t test; ***P  <  0.001). (E) Bar graph showing quantification of caspase activity in protein lysates isolated from the PFC of mice injected with anti-miR-99b or sc-control (n = 4/group; unpaired t test; **P  <  0.01). (F) Bar graph showing quantification of caspase activity in primary microglia treated with either sc-control LNAs, anti-miR-99b or anti-miR-99b together with Zbp1-ASOs (n = 6/group; unpaired t test; **P  <  0.01; ***P  <  0.001). (G) Bar graph showing qPCR results for Il1ß in primary microglia treated with either sc-control LNAs, anti-miR-99b or anti-miR-99b together with Zbp1-ASOs (n = 6/group; unpaired t test; **P  <  0.01; ***P  <  0.001). (H) Bar graph showing the results of a phagocytosis assay performed in primary microglia treated with either sc-control LNAs, anti-miR-99b or anti-miR-99b together with Zbp1-ASOs (n = 16 independent experiments; unpaired t test; ***P  <  0.001). (I) Bar graph showing quantification of caspase activity in human iPSC-derived microglia treated with either sc-control LNAs, anti-miR-99b or anti-miR-99b together with Zbp1-ASOs (n = 13-16 samples/group; unpaired t test; *P  <  0.05; **P  <  0.01). (J) Bar graph showing qPCR results for IL1ß in human iPSC-derived microglia treated with either sc-control LNAs, anti-miR-99b or anti-miR-99b together with Zbp1-ASOs (n = 6/group; unpaired t test; ***P  <  0.001). (K) Bar graph showing the results of a phagocytosis assay performed in human iPSC-derived microglia treated with either sc-control LNAs, anti-miR-99b or anti-miR-99b together with Zbp1-ASOs. The percentage of phagocytic index represents (# of total engulfed beads in an image/# of total cells identified in an image; n = 9 independent experiments; unpaired t test; *P  <  0.05; ***P  <  0.001. (L) Left panel: Representative image showing DIL dye staining to visualize dendritic spines in co-cultures. Scale bar 5 μm. Right panel: Bar chart showing the statistical quantification (spines/10 µm dendrite). One-way ANOVA revealed a difference amongst groups (P < 0.09). (The data was further analyzed via tTest; ***P  <  0.001). In all panels of this figure, error bars represent the Standard Deviation (SD) of the data. RI: relative immunofluorescent. Data information: Bars and error bars in panels (BL) indicate mean ± SEM. For the data shown in panels (FL). One-way ANOVA revealed a significant difference among the groups (P < 0.0001). Subsequent pairwise t-tests were performed to examine specific group differences. Source data are available online for this figure.
Figure 5
Figure 5. miR-99b-5p regulates neuroinflammatory phenotypes via Zbp1 a.
(A) Upper panel: Experimental design. LNPs loaded with either sc-control, anti-miR-99b, or anti-miR-99b together with Zbp1 ASOs were injected into the PFC before mice were subjected to behavioral testing. Lower panel: Bar graph showing that the basic startle response is not different amongst experimental groups (n = 10/group). (B) Bar graph showing results from the PPI experiment comparing mice injected to the PFC with either sc-control (n = 10), anti-miR-99b (n = 10), or anti-miR-99b together with Zbp1 ASOs (n = 10). Missing data made us rely on a linear mixed-model to test whether anti-mir-99b (or anti-mir-99b/Zbp1-ASO) had any effects on PPI. Results indicated either of the injections—or both—had a statistically significant effect, F(2.4,66) = 11.9, *P < 0.0001, but without specifically indicating which one was behind this result. Applying pairwise unpaired t-tests to compare each of the groups at specific dB values, we observe that, in agreement with our previous data, PPI is impaired when comparing the sc-control group to mice injected with anti-miR-99b (*P < 0.01 for each intensity ranging from 75 up to 90 dB). In contrast, no difference was observed when the sc-control group was compared to mice injected with anti-miR-99b together with Zbp1 ASOs. Asterisks indicate significance (*P < 0.05). Error bars indicate SEM. Data information: Bars and error bars in panels (A, B) indicate mean ± SEM. Source data are available online for this figure.
Figure EV1
Figure EV1. Clinical phenotypes of the individuals subjected for small RNA-seq analysis.
We analyzed 242 healthy controls and 331 SZ patients of the PsyCourse study. Depicted are the clinical phenotypes that differ significantly between groups, namely the positive and negative syndrome rating scale (PANSS), the total PANSS, the Beck depression inventory (BDI-II) and the global assessment of functioning (GAF) scores. ****P < 0.0001, tTest.
Figure EV2
Figure EV2. Analysis of candidate miR expression to SZ phenotypes.
(A) Venn diagram showing the overlap between the miRs present within the co-expression modules that were increased in SZ patients (modules represented by yellow, blue and green color), that were increased when analyzed via DSEQ2 differential expression analysis in blood (Blood DSEQ2_DE) and were increased in postmortem brain samples from SZ patients (brain_DE). In total 5 miRs were consistently increased in blood, brain and a co-expression module (B) Heat map showing the correlation of candidate miR expression levels of individuals of the PsyCourse study to the clinical phenotypes. The numbers in each rectangle represent the correlation (upper number) and the corresponding p-value (lower number). Values for miR-99b-5p are shown within Fig. 1H. MiR-21-5p and miR-501-3p have been previously linked to SZ and show the highest correlation values. MiR-221-5p is significantly correlated to the PANSS scores but not the GAF and BDI-II (The significance of correlations was determined using Pearson correlation coefficients and assessed for statistical significance through permutation testing). (C) Heat map showing the correlation of six miRs from our dataset that were not differentially expressed in the blood or brain of SZ patients (not regulated). miR-23a-3p, miR-140-3p, and miR-532-3p were randomly selected, while miR-146a-5p, miR-181a-5p, and miR-148a-3p were recently identified as a biomarker signature for Alzheimer’s disease (Islam et al, 2021) (The significance of correlations was determined using Pearson correlation coefficients and assessed for statistical significance through permutation testing).
Figure EV3
Figure EV3. Administration of anti-miR-99b-5p reduces the levels of miR-99b-5p detectable via qPCR.
(A) To test if the administration of anti-miR-99b oligonucleotides reduces the levels of miR-99b-5p detected via qPCR we treated HEK293 cells—which show low endogenous expression of miR-99b-5p—with either control oligonucleotides (sc-control), miR-99b mimic, anti-miR-99b or the combination of miR-99b mimic and anti-miR99b. While administration of the miR-99b mimic significantly increased the detection of miR-99b-5p via qPCR when compared to sc-control (P = 0.001, t-Test), the co-administration significantly reduced detectable miR-99b-5p (P < 0.0001, t-test). N = 3/group. Measurements were performed 48 after treatment. (B) Primary mouse microglia (DIV 8) were treated with sc-control or anti-miR-99b for either 48 h or 5 days before RNA was collected for qPCR. At both time points anti-miR-99b treatment significantly reduced the detectability of miR-99b-5p (n = 4/group, t-test). It is important to note that LNA-based anti-miRs are known to sequester the target RNA rather than causing the degradation of the target miR. Therefore, the reduced detection of miR-99b-5p upon anti-miR-99b treatment is likely due to the formation of exonuclease-resistant duplexes that are not denatured during cDNA synthesis. Consequently, the miR-99b-5p is less accessible for reverse transcription, resulting in lower detected levels compared to the scramble control-treated samples in the subsequent qPCR reaction. Nevertheless, qPCR is a suitable method to assay target engagement of anti-miR-99b-5p. (C) Left panel: Experimental design. Anti-miR-99b oligonucleotides (anit-mIR-99b) were injected—along with their corresponding control—into the prefrontal cortex (PCF) of mice. Right panel: Bar graph showing qPCR results for miR-99b-5p in tissue obtained from the hippocampus of mice after injection of anti-miR-99b (n = 4) or sc-control oligonucleotides (n = 5) to the PFC. There is no significant difference between the groups. (D) Left panel: Experimental design. Anti-miR-99b or anti-miR-99b along with Zbp1-ASOs (anti-miR99b/Zbp1-ASO) were injected into the prefrontal cortex (PCF) of mice. Middle panel: QPCR results from the PFC show that the expression of miR-99b-5p is decreased in the anti-miR-99b group (n = 4; P = 0.0002, unpaired t-Test) and in the anti-miR99b/Zbp1-ASO group (n = 4; P = 0.0014, unpaired t-Test) when compared to the sc-control group (n = 4). One-way ANOVA revealed a significant difference among the groups (p < 0.0001). Right panel: QPCR results from the PFC show that the expression of Zbp1 is increased in the anti-miR-99b group (n = 4; P = 0.0008, unpaired t-Test) and in the anti-miR99b/Zbp1-ASO group (n = 4; P = 0.002, unpaired t-Test) when compared to the sc-control group (n = 4). One-way ANOVA revealed a significant difference among the groups (p < 0.0001). (E) Right panel: Bar graph showing qPCR results for miR-99b-5p in tissue obtained from the hippocampus of mice after injection of anti-miR-99b along with Zbp1 ASOs (anti-miR99b/Zbp1-ASO group; n = 4) or control oligonucleotides (n = 4) into the PFC. There is no significant difference between the groups. Left panel: Bar graph showing qPCR results for Zbp1 in tissue obtained from the hippocampus of mice after injection of anti-miR-99b along with Zbp1 ASOs (anti-miR99b/Zbp1-ASO group; n = 4) or control oligonucleotides (n = 5) into the PFC. There is no significant difference between the groups. Data information: Bars and error bars in panels (AE) indicate mean ± SEM.
Figure EV4
Figure EV4. Loss of miR-99b-5p levels increases the expression of pro-inflammatory cytokines and phagocytosis in IMG cells.
(A) IMG cells were treated with vehicle control solution (control) or 10 mg/ml LPS. In a similar experiment, IMG cells were treated with LNPs loaded with either sc-control LNAs or anti-miR-99b. qPCR analysis was performed for the pro-inflammatory cytokines Il1b and Tgf1b. The expression of Il1b and Tgf1b were significantly increased upon LPS treatment or anti-miR-99b treatment when compared to the respective control groups (unpaired t test; n = 2 or 6/group). (B) Bar graph showing that the phagocytic index increases in IMG cells upon LPS treatment (unpaired t test; controls = 8; LPS = 4). (C) Representative images showing the uptake of latex beads by IMG cells treated with either sc-control LNAs or anti-miR-99b. Scale bar: 0.5 µm. (D) Bar graph showing the quantification of (C). The figure presents representative images captured at 63× magnification using a confocal microscope. A scale bar of 0.5 µm is included in each image to provide a reference for size. Treatment with anti-miR-99 increases the phagocytic index (unpaired t test; n = 8/group). *P < 0.05, **P < 0.01, ***P < 0.001. Error bars indicate SEM. Data information: Bars and error bars in panels (A, B, D) indicate mean ± SEM.
Figure EV5
Figure EV5. Genes linked to innate immunity and synaptic pruning are increased in microglia treated with anti-miR-99b and in schizophrenia patients.
(A) Bar graph showing qPCR results for C1qa, C1qb, C1qc, and C3 in primary microglia treated with sc-control LNAs or anti-miR-99b. (B) Bar graph showing qPCR results for C1qa, C1qb, C1qc, and C3 when RNA was isolated from co-cultures in which primary cortical neurons were treated with microglia that had received LNPs loaded with either sc-control LNAs or anti-miR-99b. (C) QPCR analysis was used to measure C1qa, C1qb, C1qc, and C3 expression in human postmortem PFC samples obtained from control individuals and SZ patients (unpaired tTest, **P < 0.01, *P < 0.05; n = 4/group). Data information: Bars and error bars in panels (A, B, C) indicate mean ± SEM.

References

    1. Abbas AR, Baldwin D, Ma Y, Ouyang W, Gurney A, Martin F, Fong S, van Lookeren Campagne M, Godowski P, Williams PM, et al. Immune response in silico (IRIS): immune-specific genes identified from a compendium of microarray expression data. Genes Immun. 2005;6:319–331. doi: 10.1038/sj.gene.6364173. - DOI - PubMed
    1. Achim AM, Maziade M, Raymond E, Olivier D, Mérette C, Roy MA. How prevalent are anxiety disorders in schizophrenia? A meta-analysis and critical review on a significant association. Schizophr Bull. 2011;37:811–821. doi: 10.1093/schbul/sbp148. - DOI - PMC - PubMed
    1. Ayata P, Badimon A, Strasburger HJ, Duff MK, Montgomery SE, Loh YE, Ebert A, Pimenova AA, Ramirez BR, Chan AT, et al. Epigenetic regulation of brain region-specific microglia clearance activity. Nat Neurosci. 2018;21:1049–1060. doi: 10.1038/s41593-018-0192-3. - DOI - PMC - PubMed
    1. Banach E, Szczepankiewicz A, Kaczmarek L, Jaworski T, Urban-Ciećko J. Dysregulation of miRNAs levels in glycogen synthase kinase-3β overexpressing mice and the role of miR-221-5p in synaptic function. Neuroscience. 2022;490:287–295. doi: 10.1016/j.neuroscience.2022.03.024. - DOI - PubMed
    1. Barbato C, Giacovazzo G, Albiero F, Scardigli R, Scopa C, Ciotti MT, Strimpakos G, Coccurello R, Ruberti F. Cognitive decline and modulation of Alzheimer’s disease-related genes after inhibition of microRNA-101 in mouse hippocampal neurons. Mol Neurobiol. 2020;57:3183–3194. doi: 10.1007/s12035-020-01957-8. - DOI - PubMed