. 2024 May;27(5):836-845.
doi: 10.1038/s41593-024-01599-2. Epub 2024 Mar 25.

Pervasive environmental chemicals impair oligodendrocyte development

Affiliations

Pervasive environmental chemicals impair oligodendrocyte development

Erin F Cohn et al. Nat Neurosci. 2024 May.

Abstract

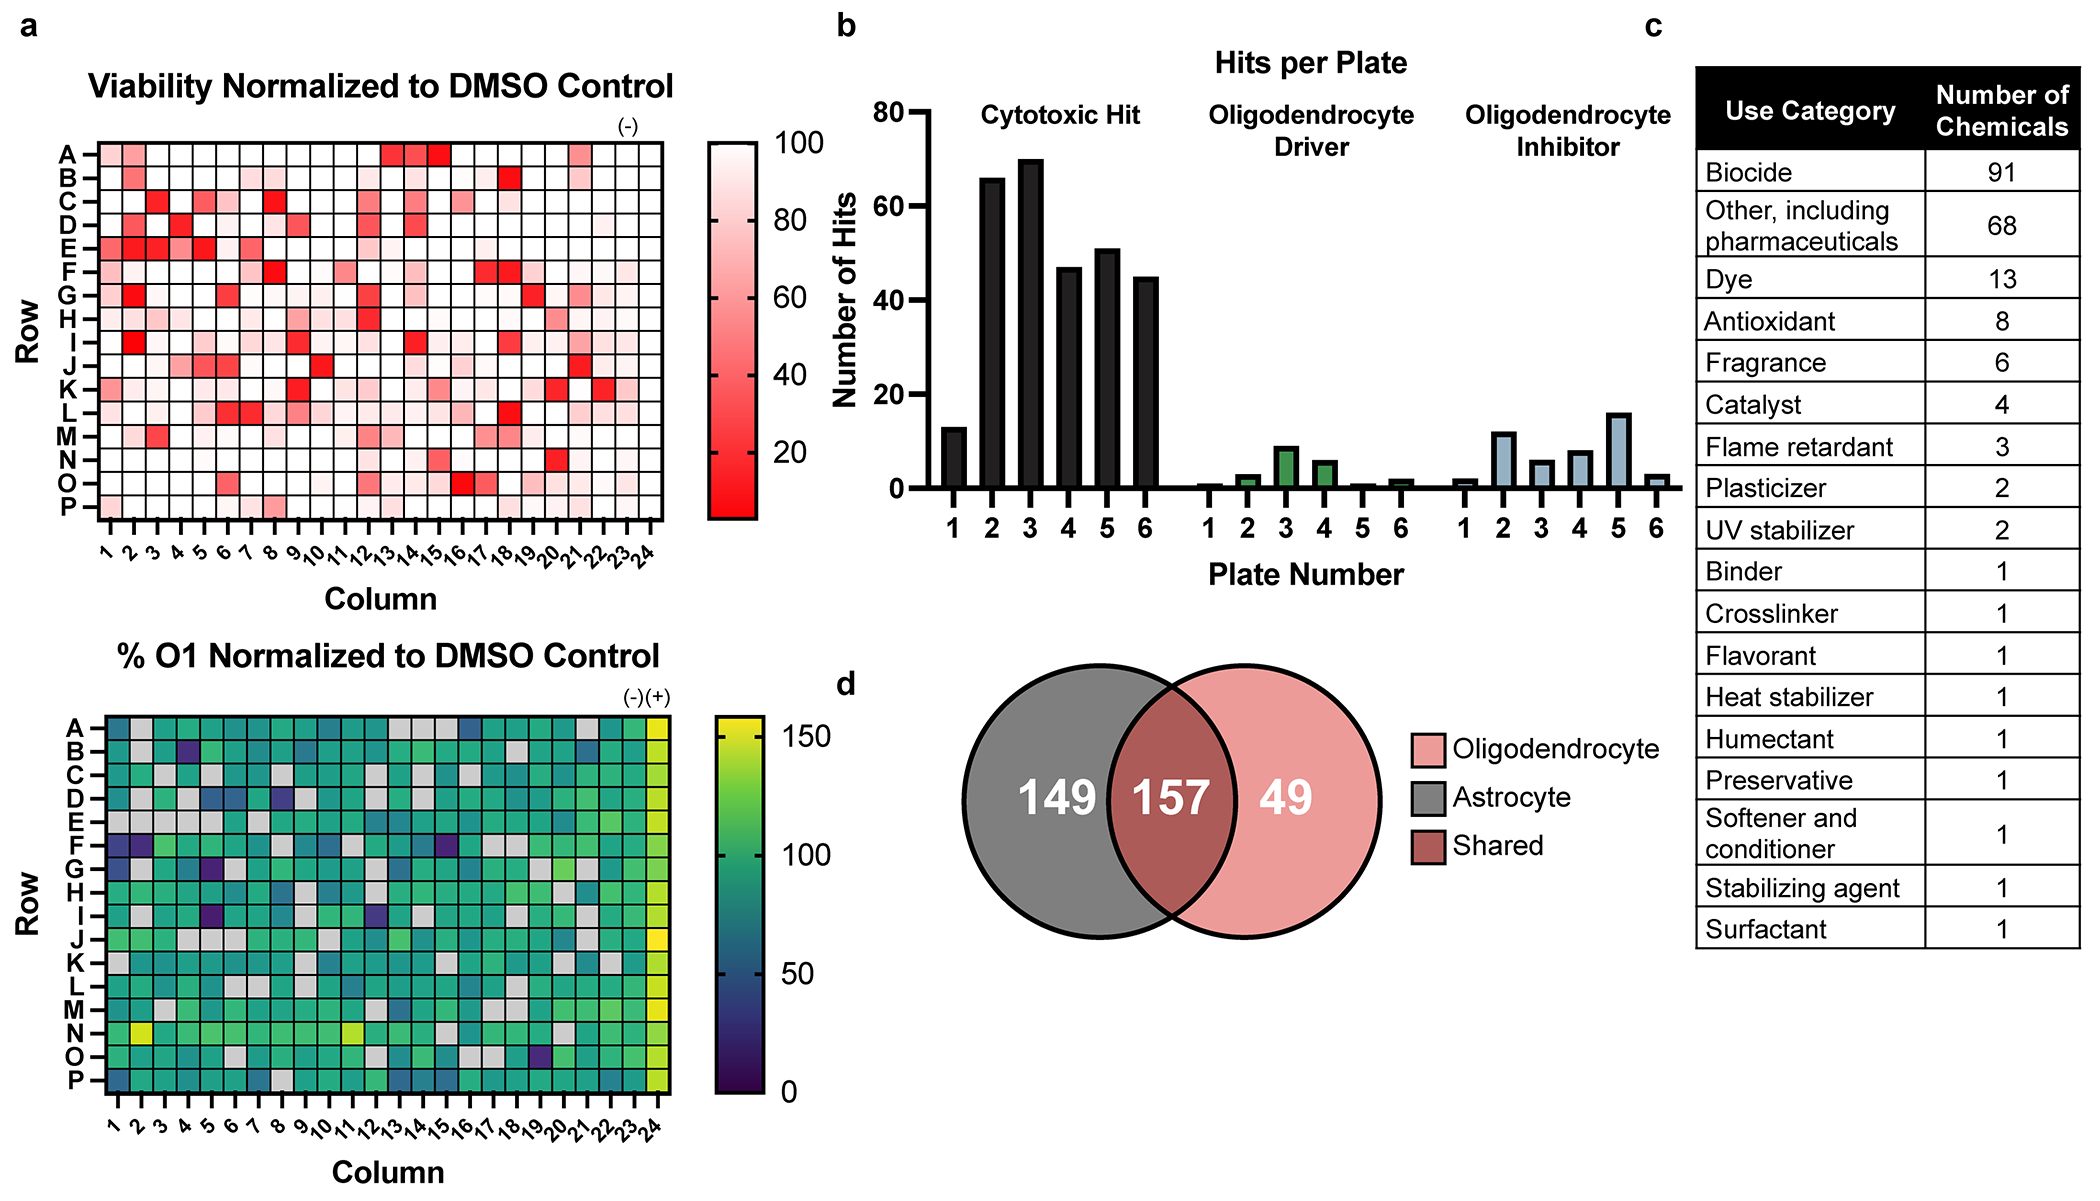
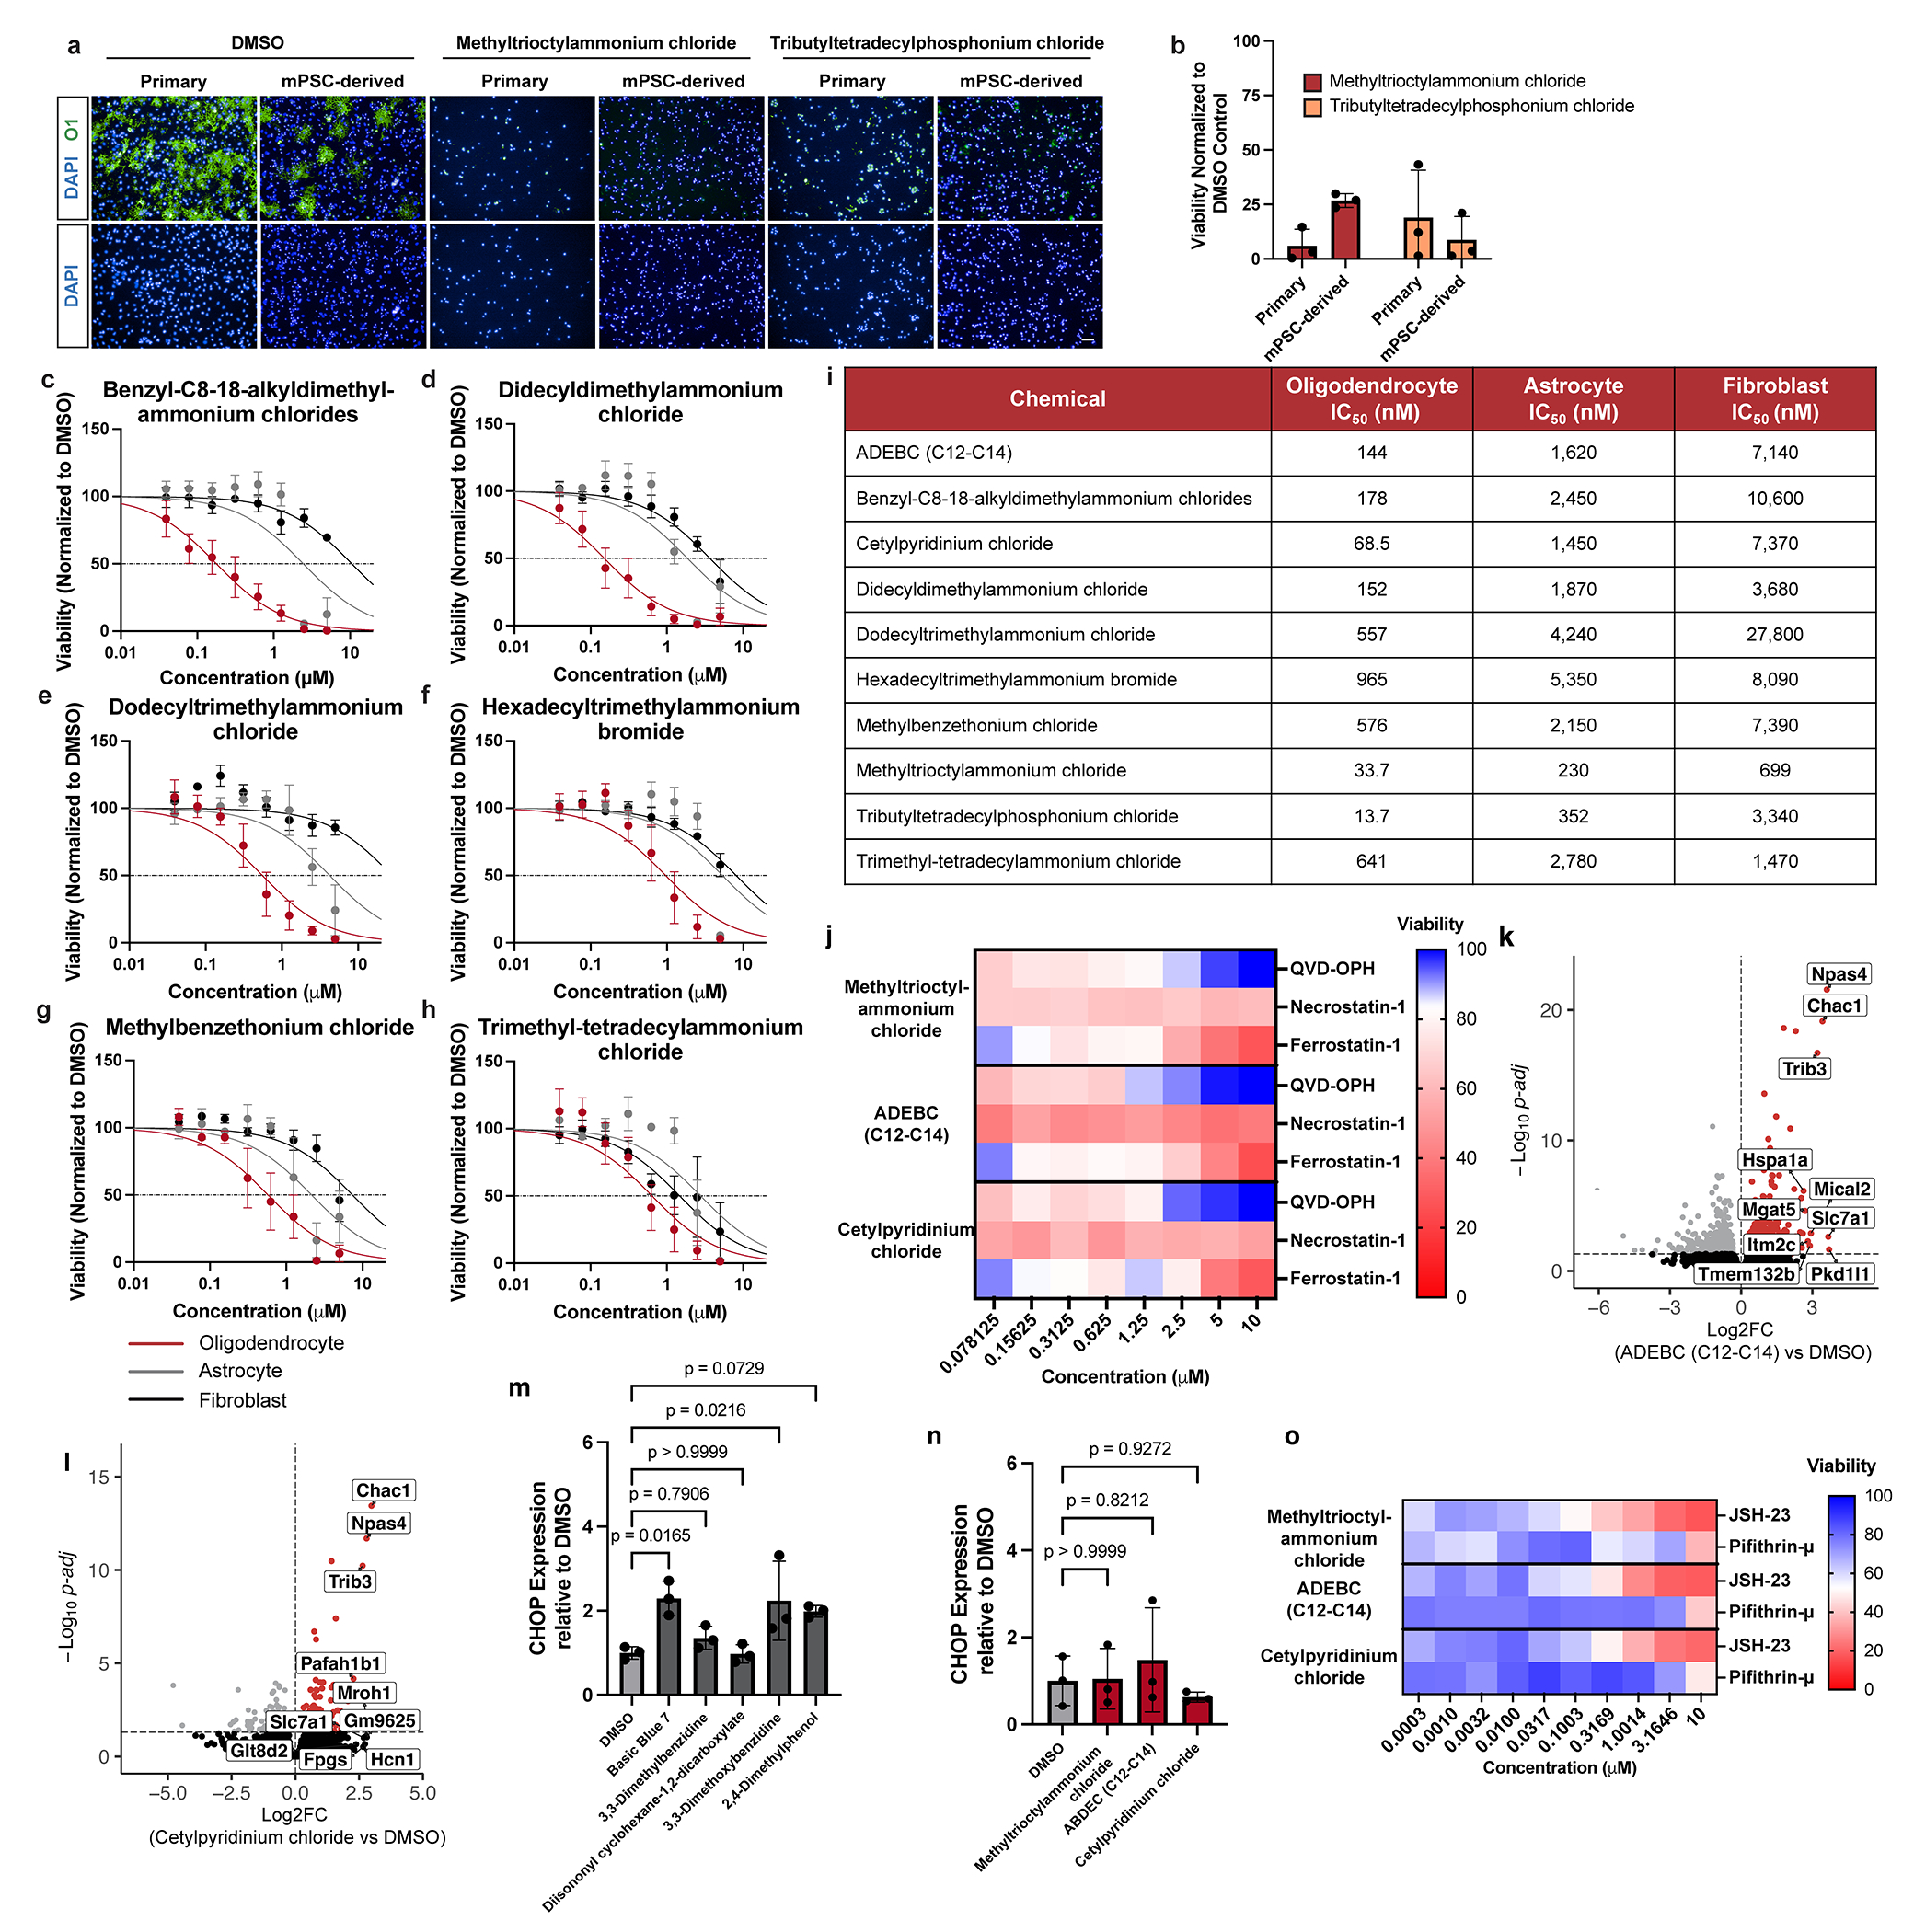
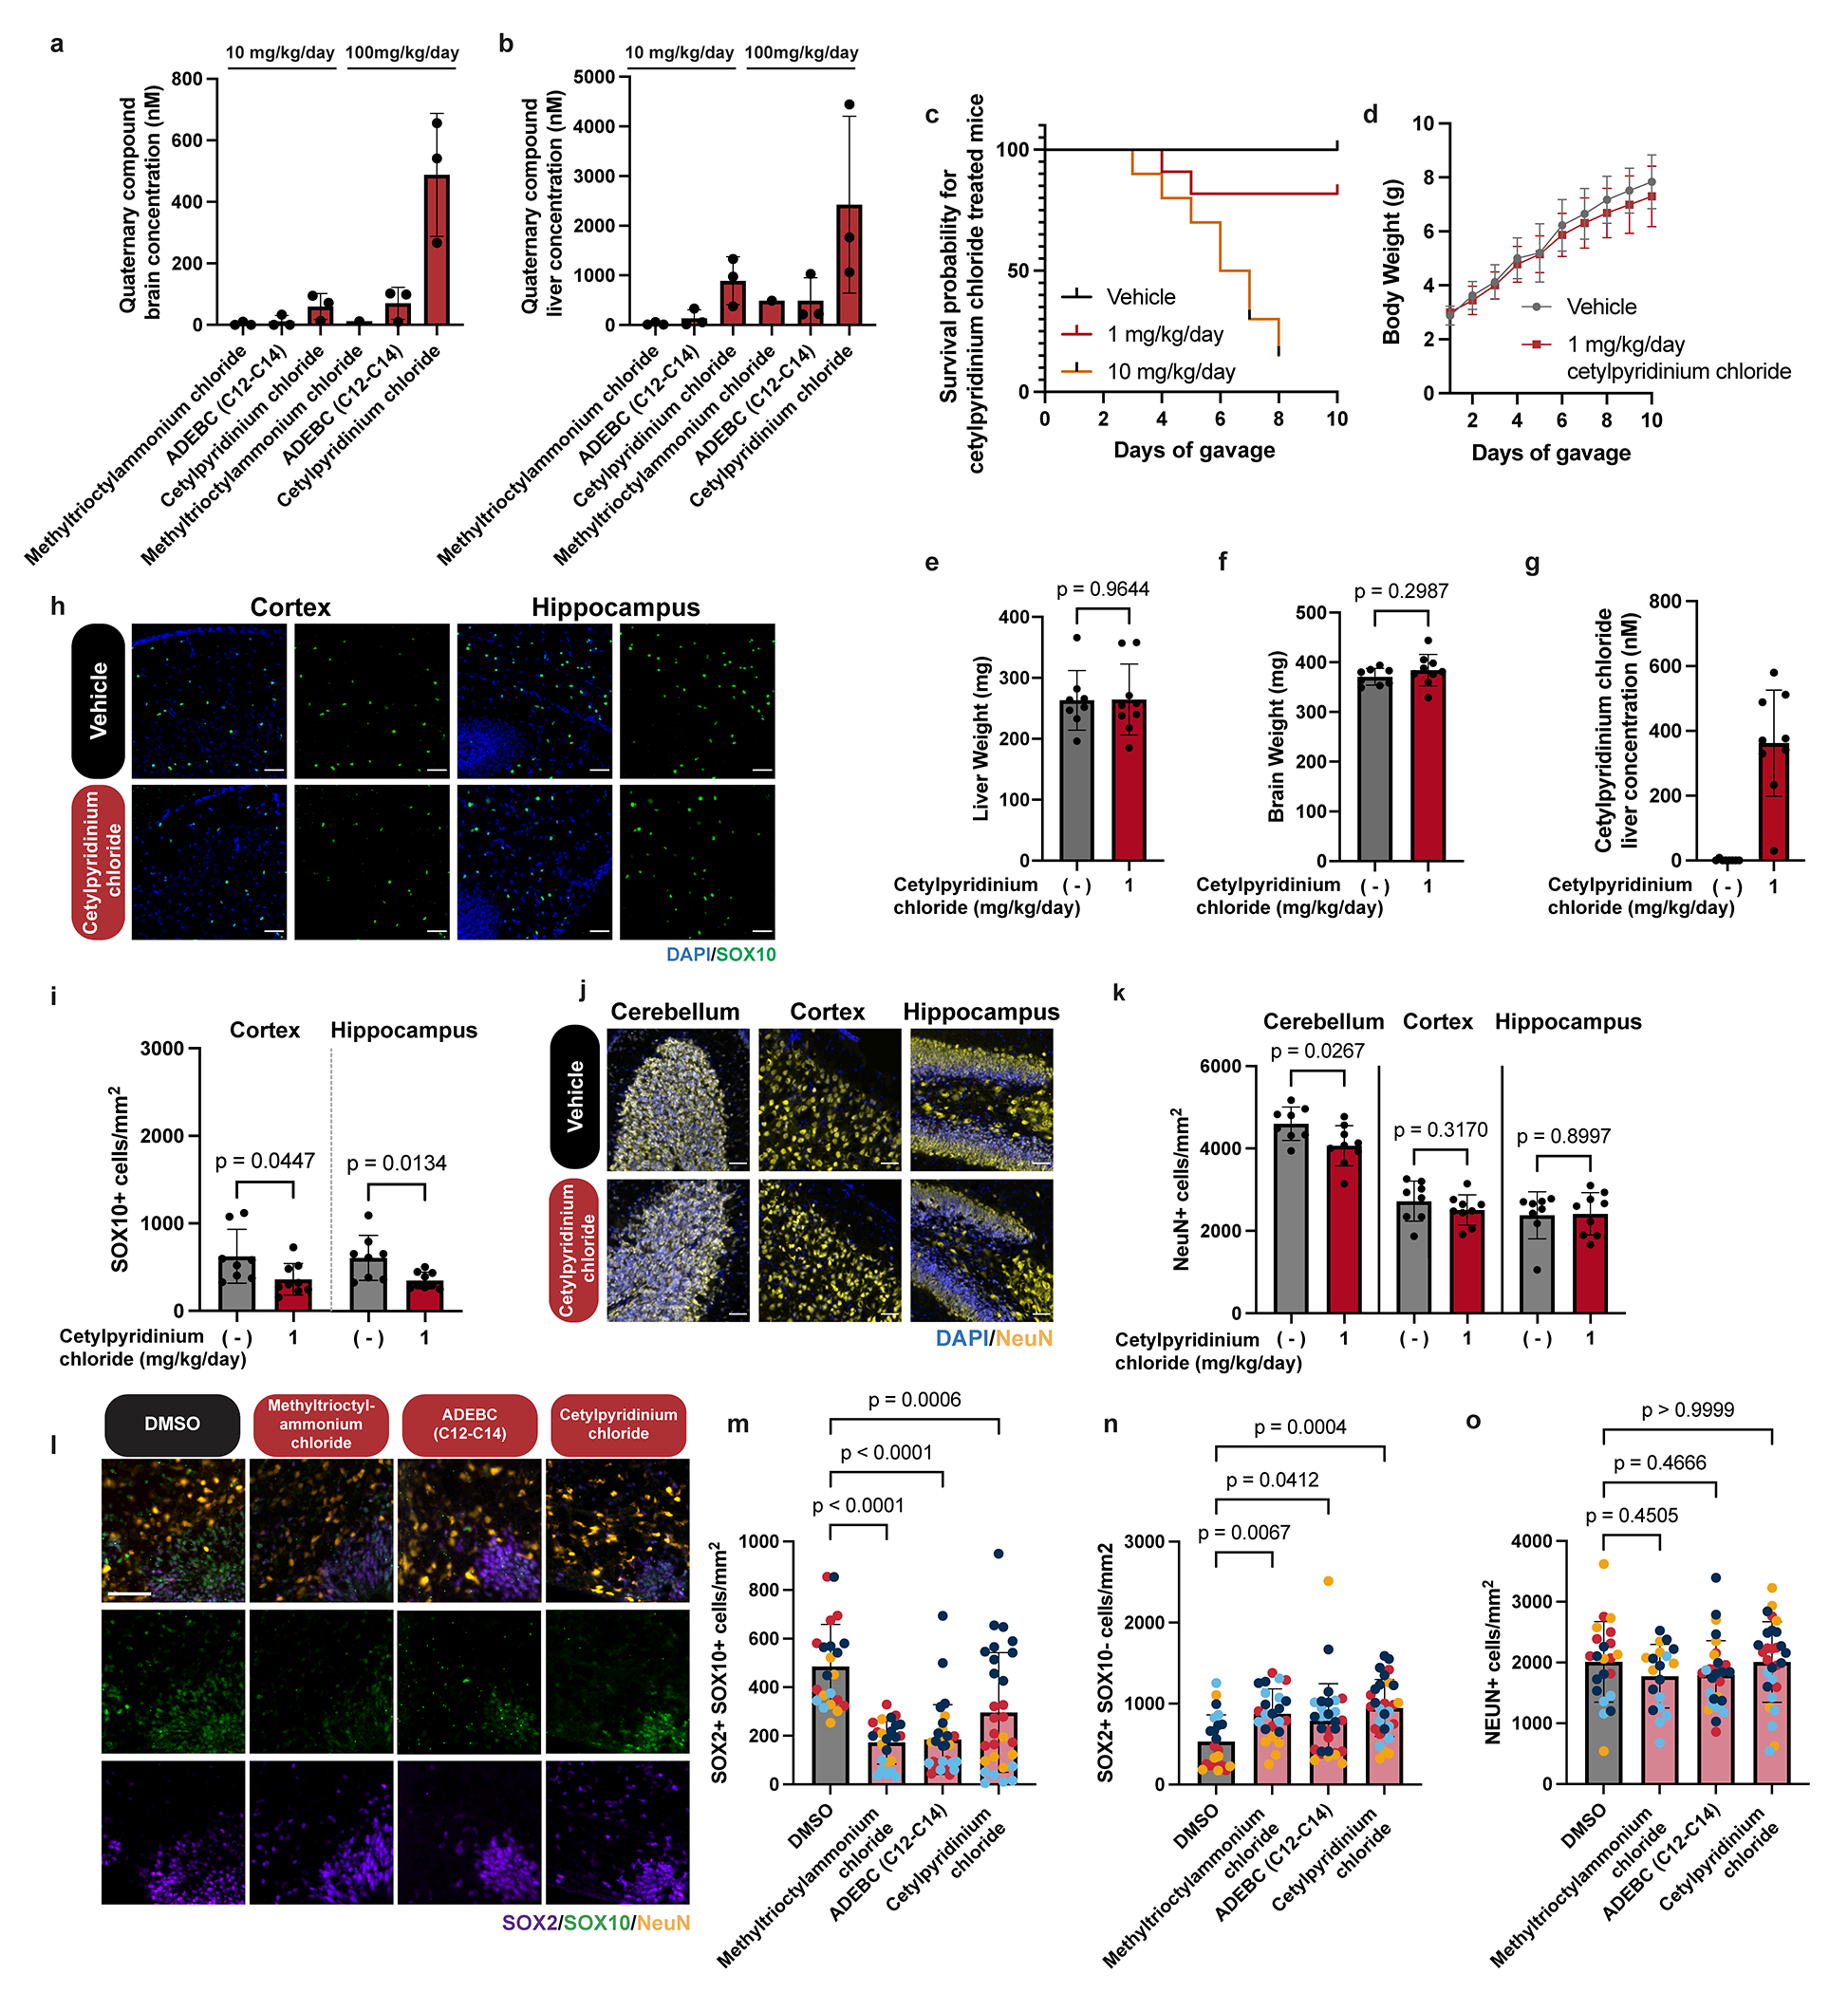
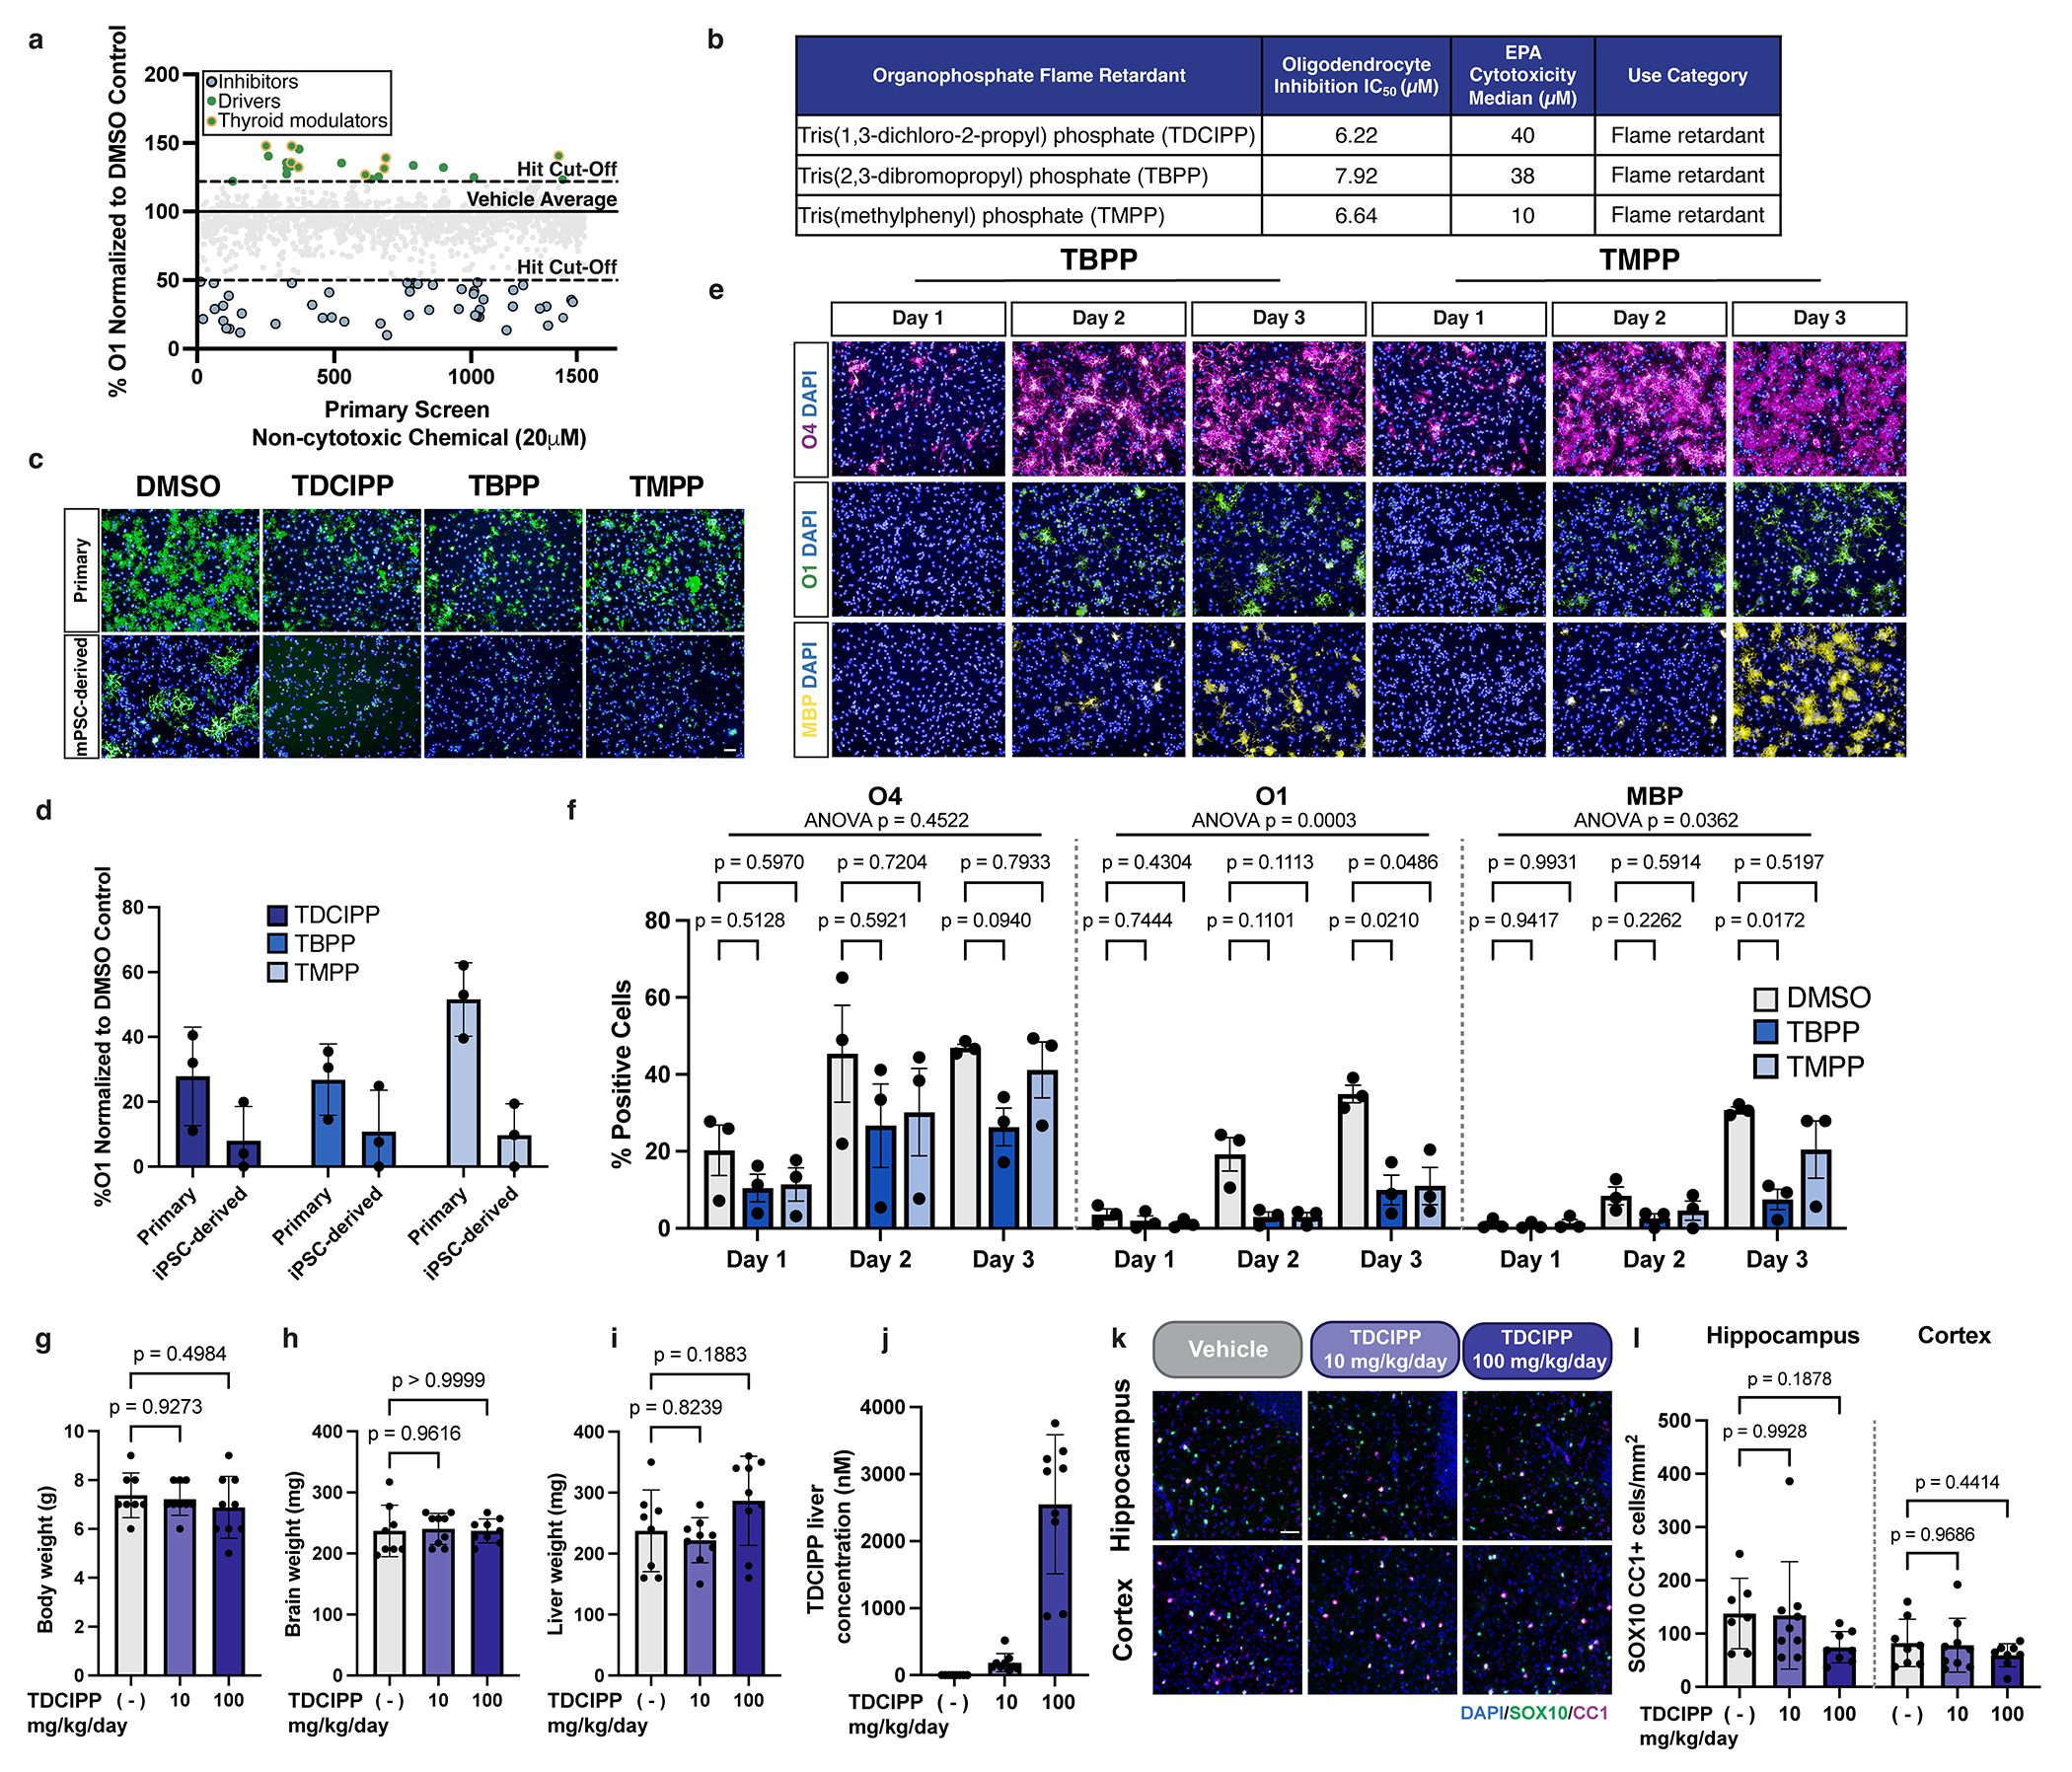
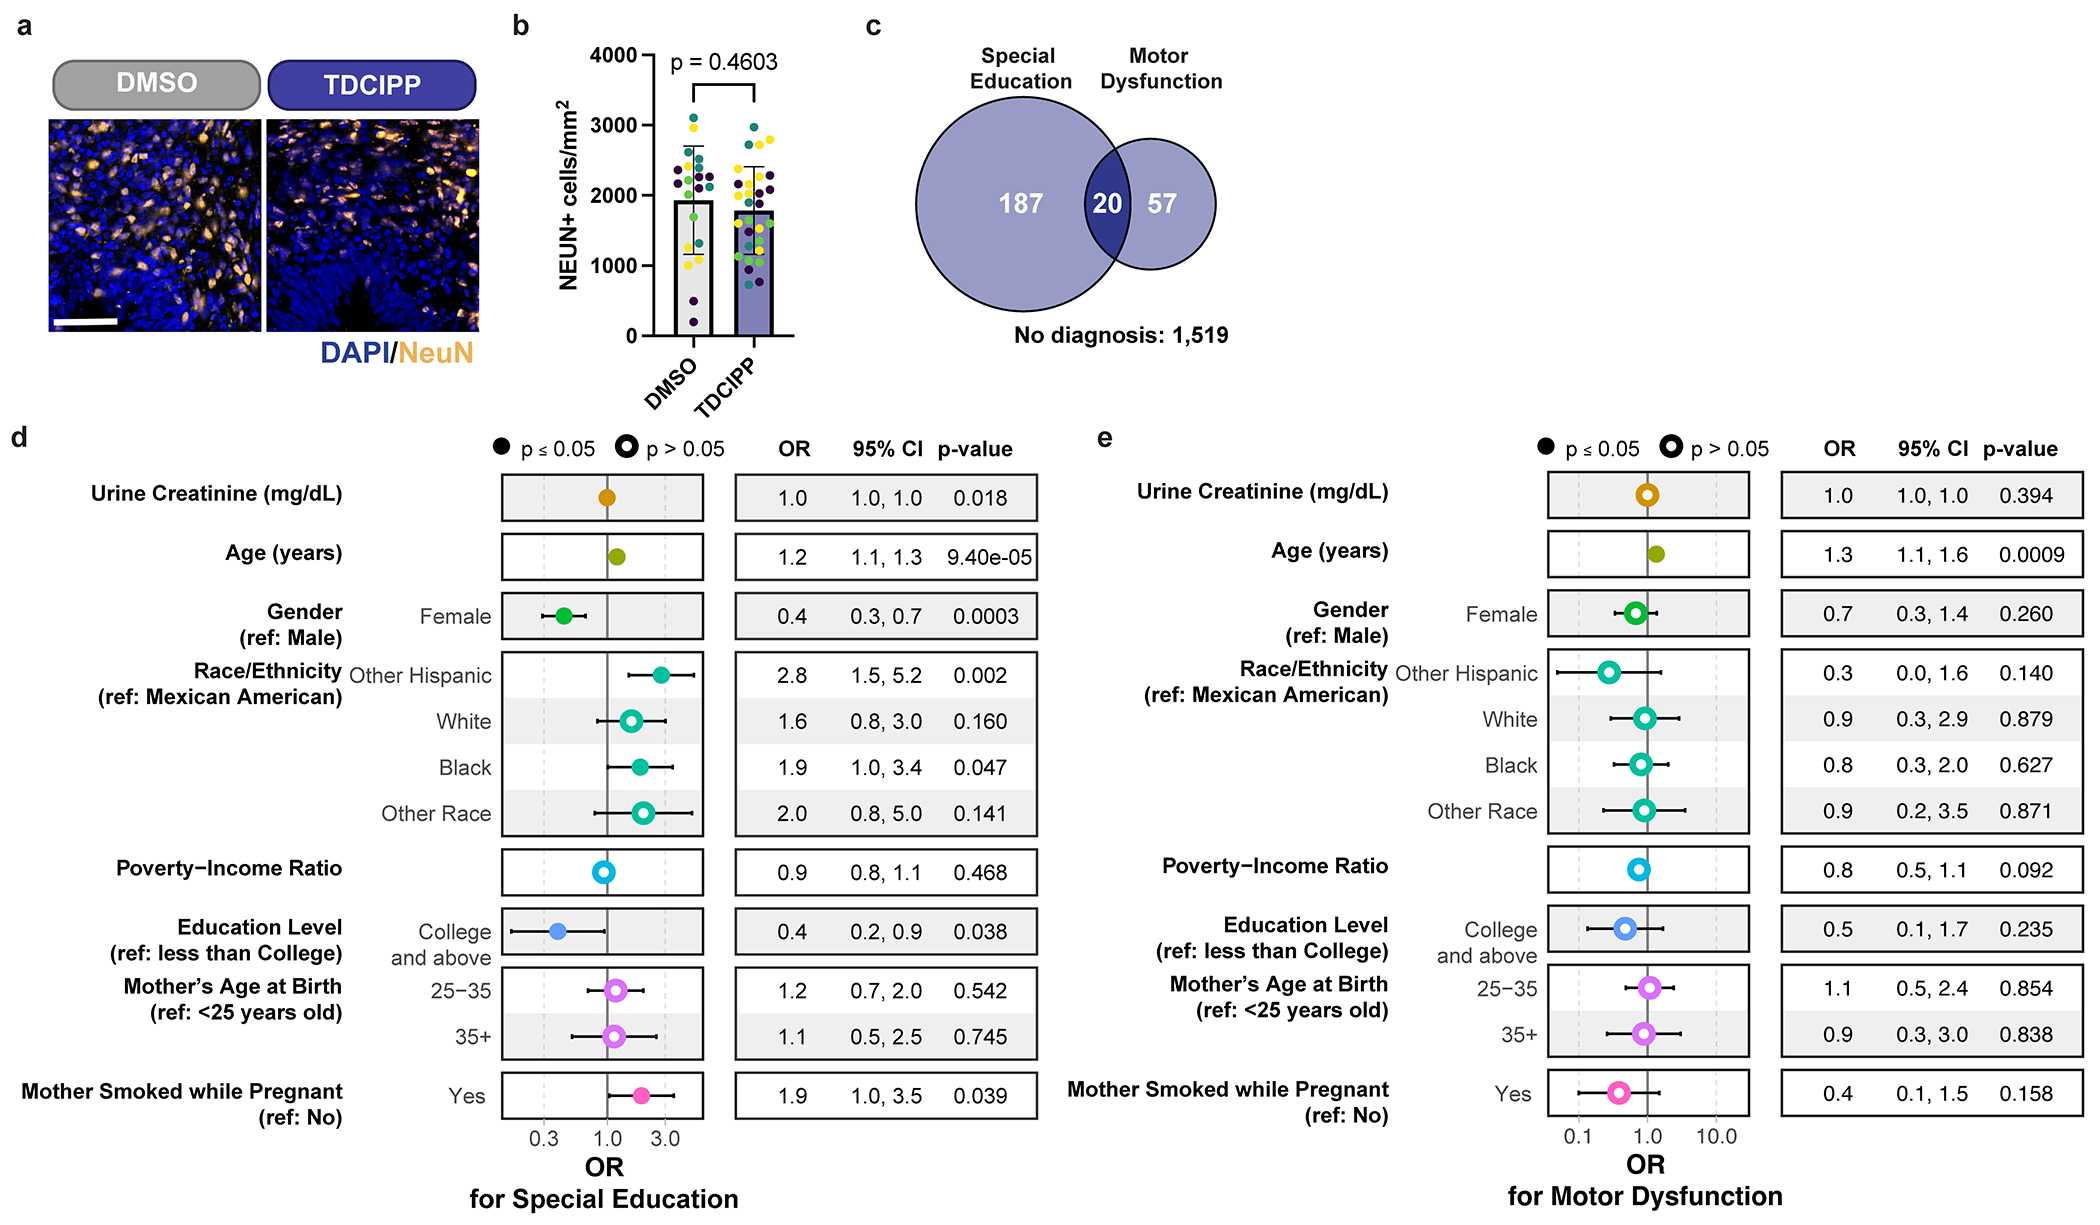
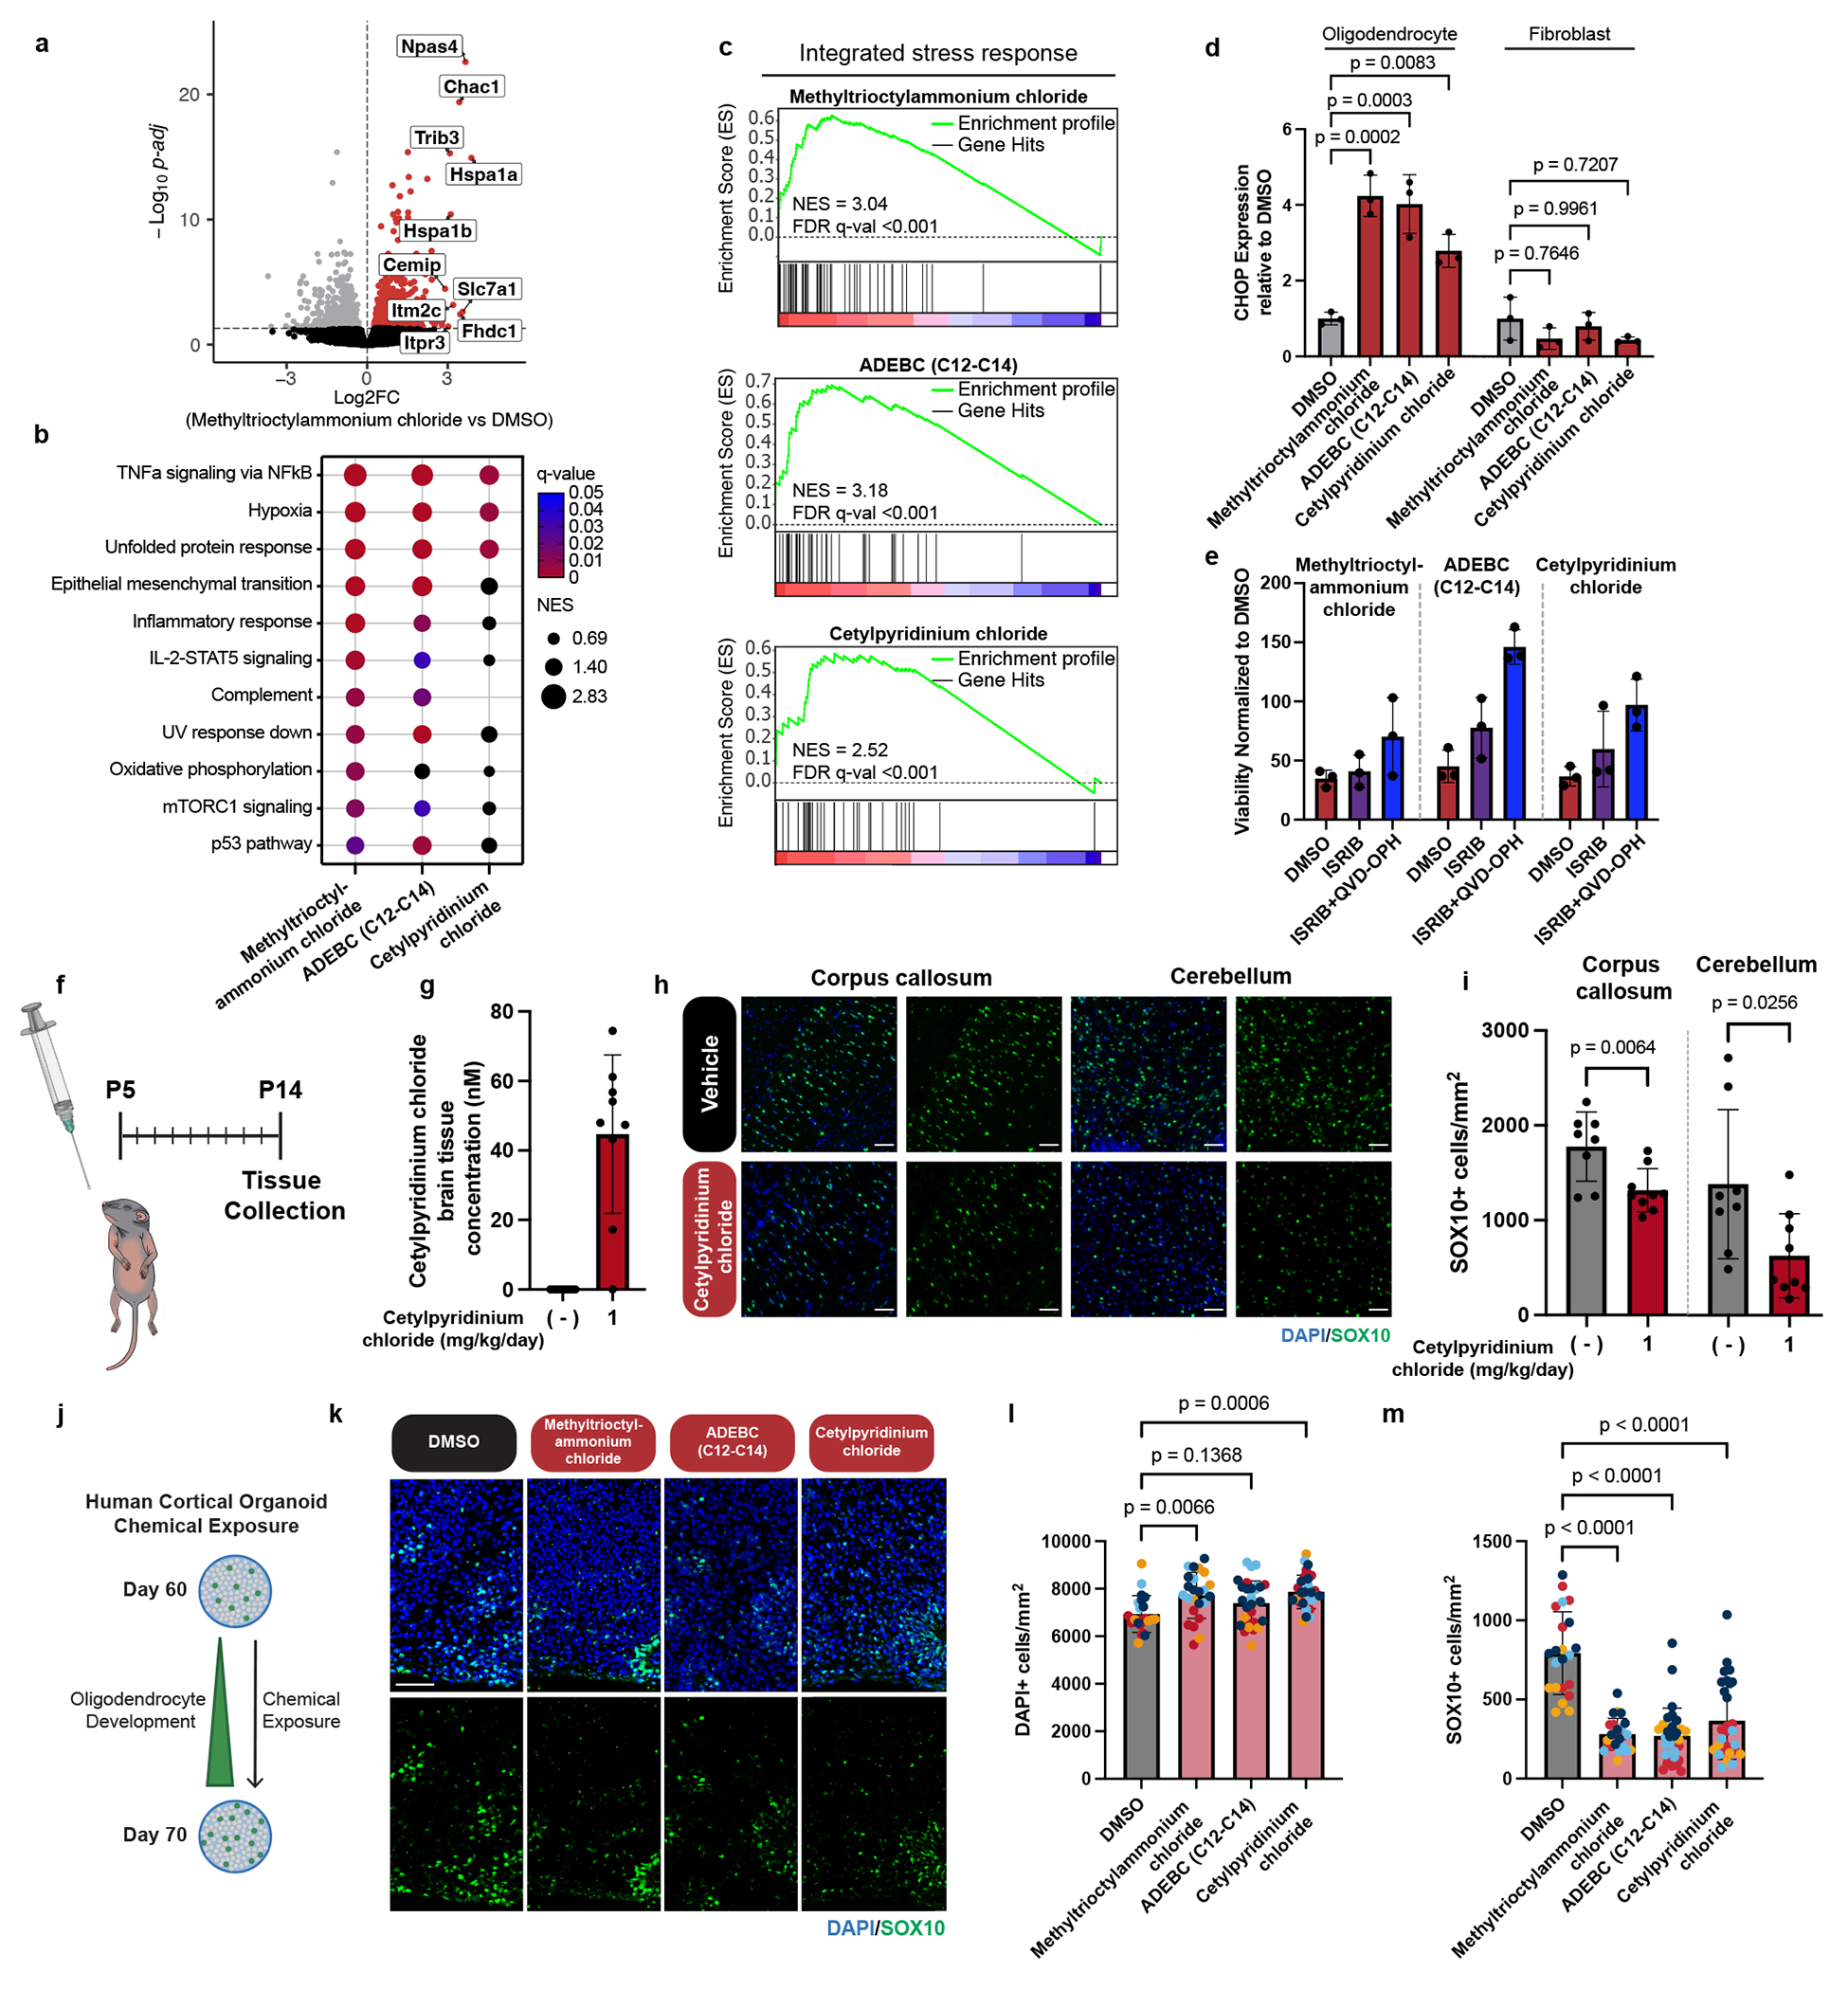
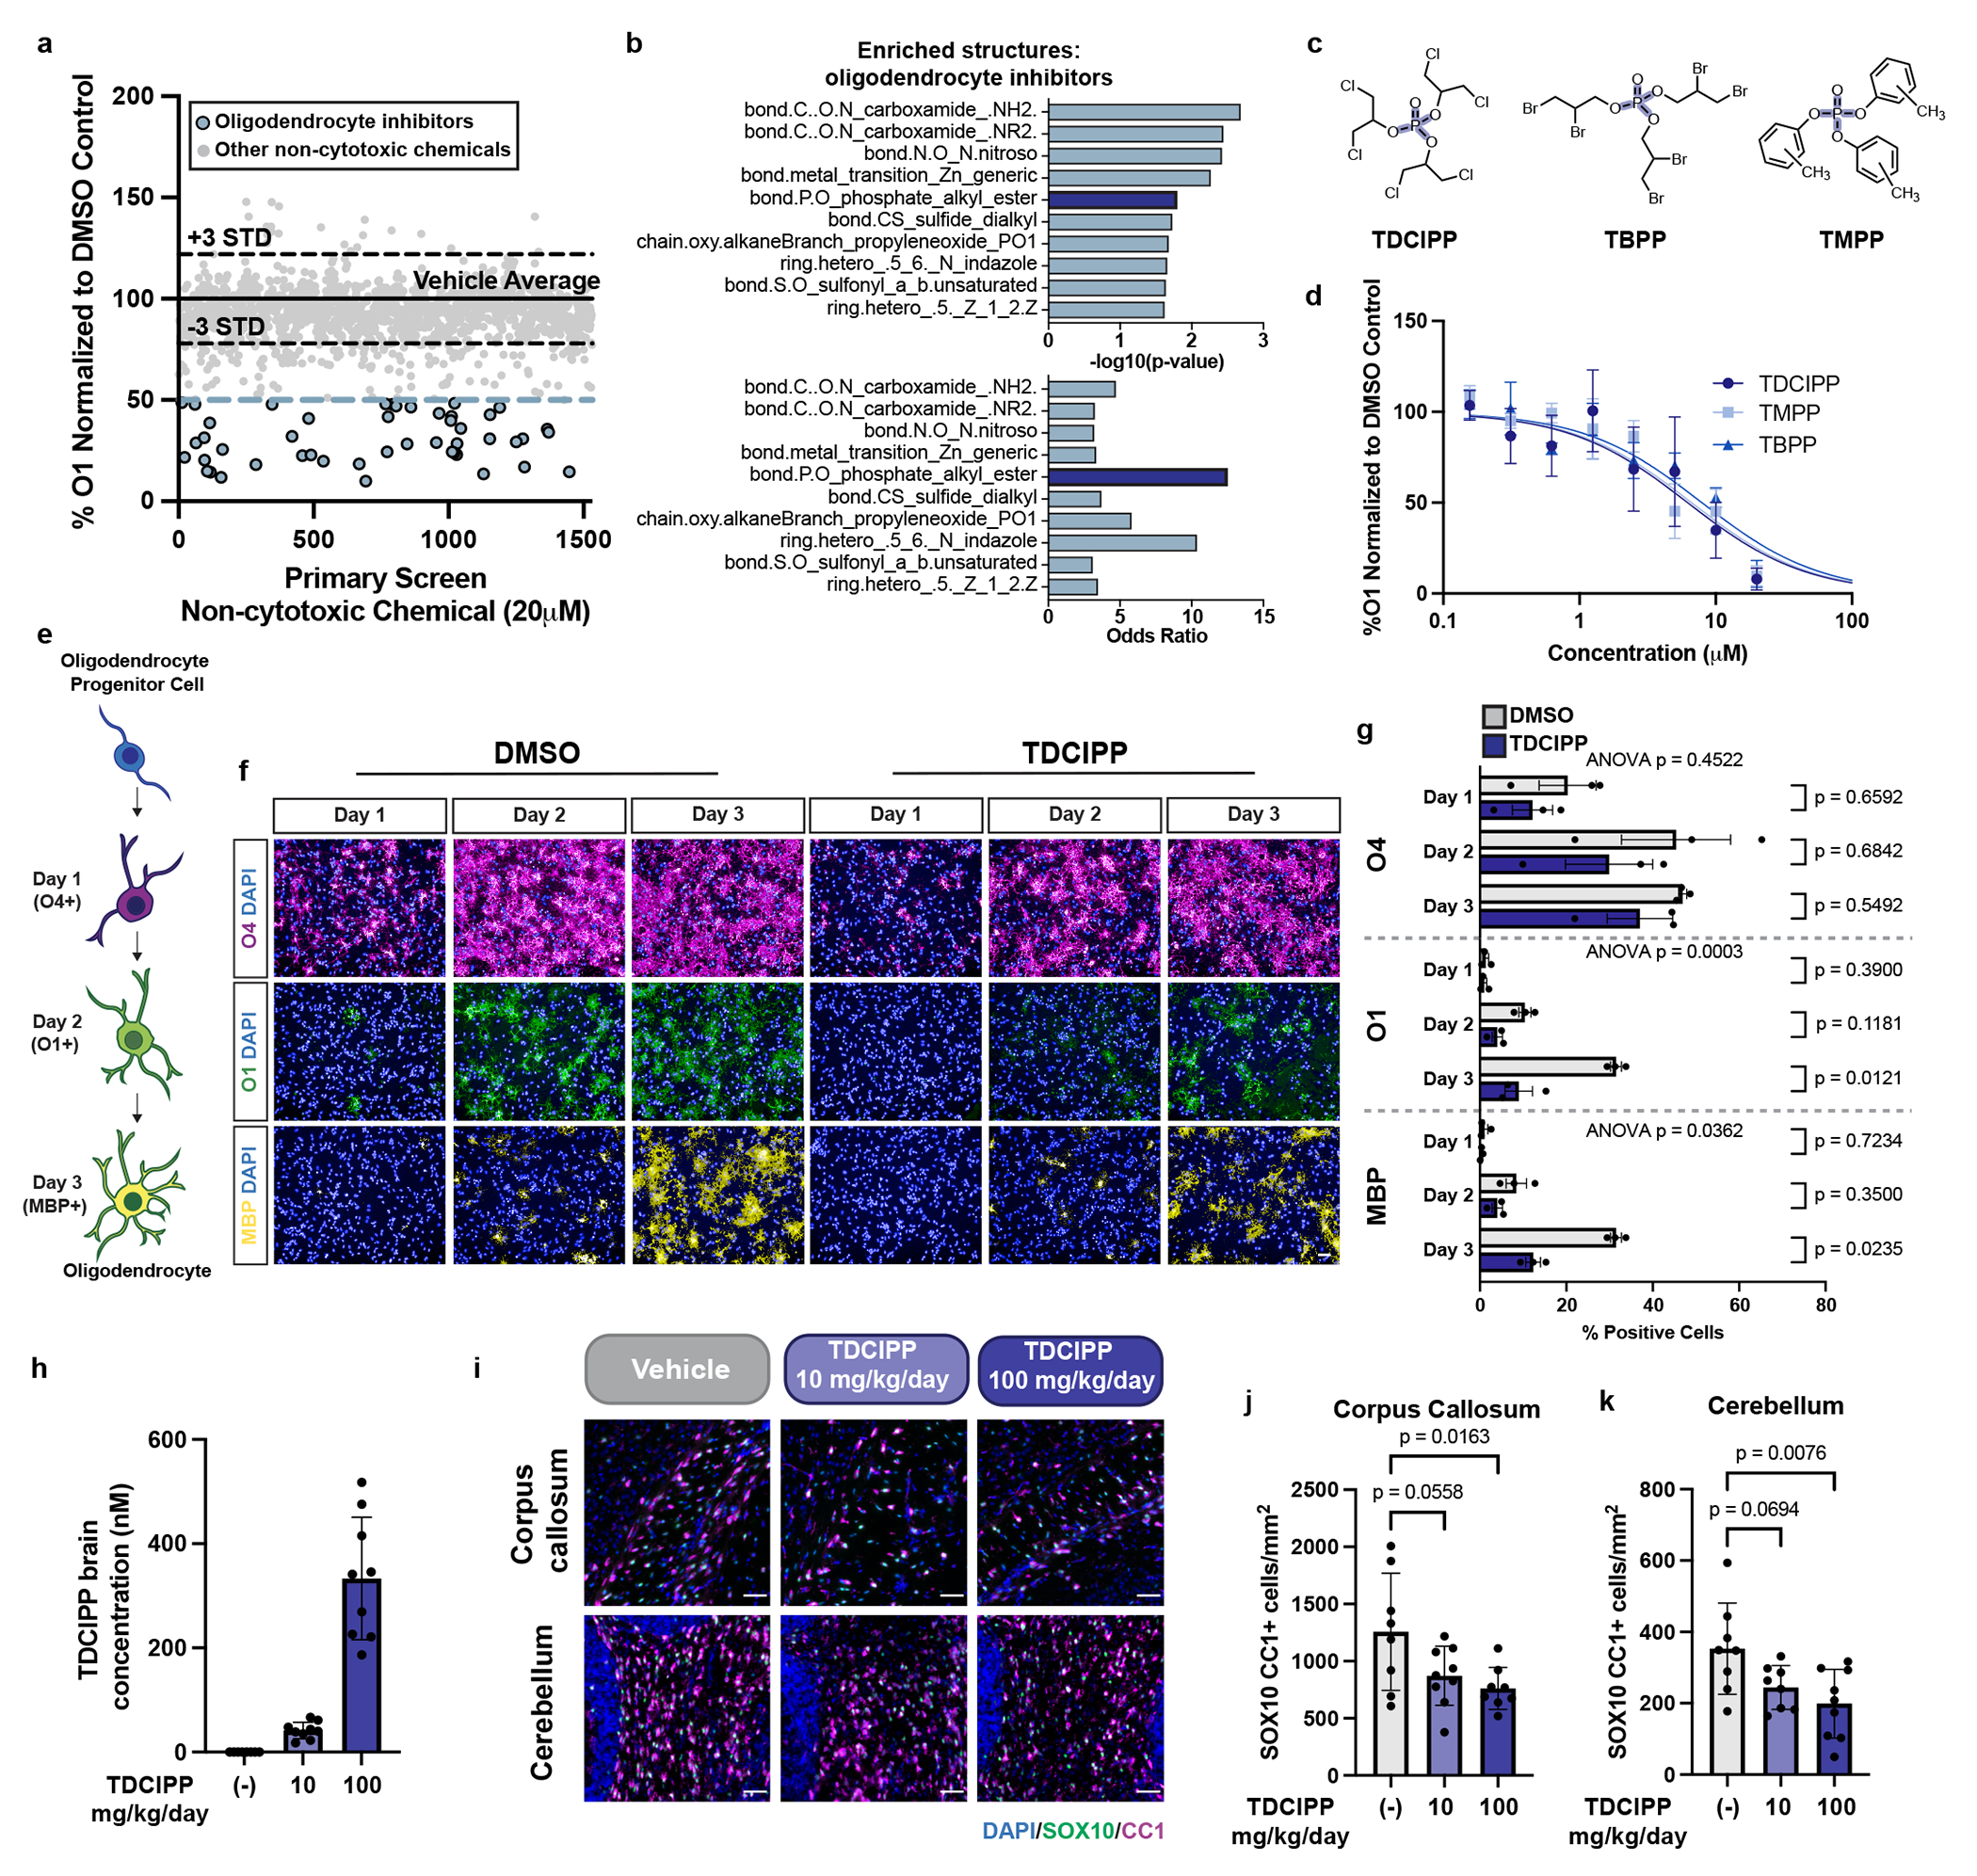
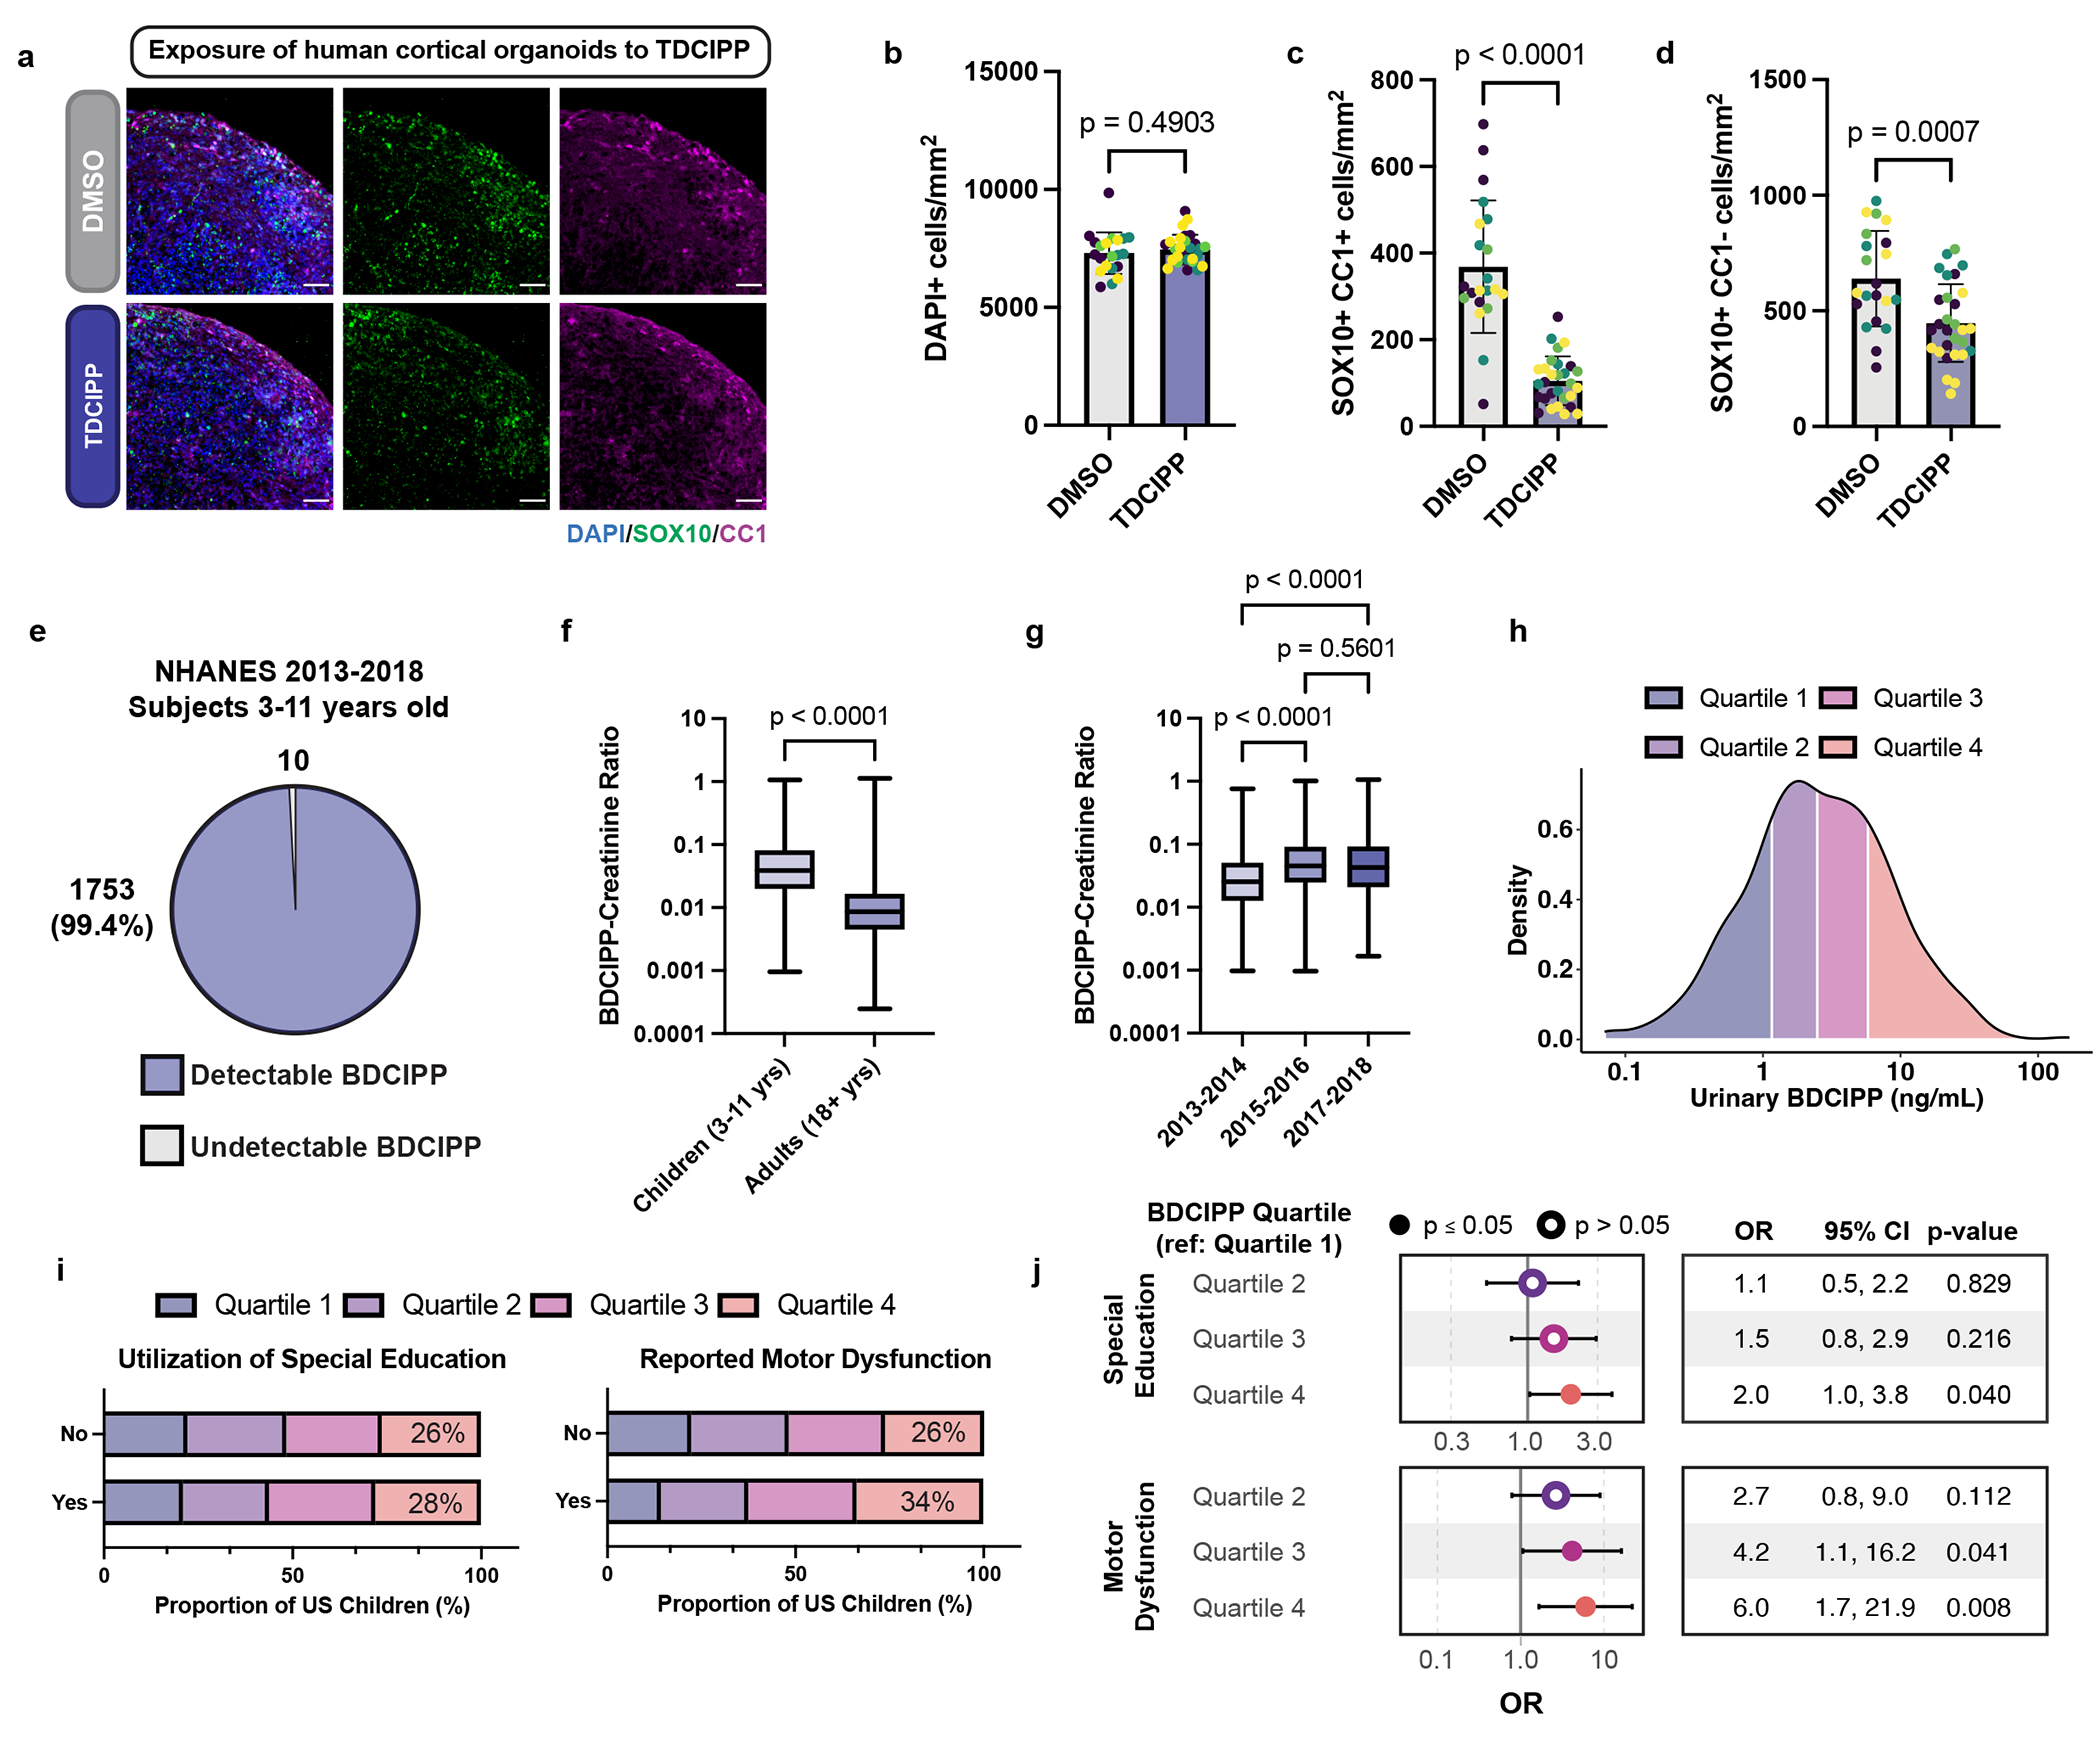
Exposure to environmental chemicals can impair neurodevelopment, and oligodendrocytes may be particularly vulnerable, as their development extends from gestation into adulthood. However, few environmental chemicals have been assessed for potential risks to oligodendrocytes. Here, using a high-throughput developmental screen in cultured cells, we identified environmental chemicals in two classes that disrupt oligodendrocyte development through distinct mechanisms. Quaternary compounds, ubiquitous in disinfecting agents and personal care products, were potently and selectively cytotoxic to developing oligodendrocytes, whereas organophosphate flame retardants, commonly found in household items such as furniture and electronics, prematurely arrested oligodendrocyte maturation. Chemicals from each class impaired oligodendrocyte development postnatally in mice and in a human 3D organoid model of prenatal cortical development. Analysis of epidemiological data showed that adverse neurodevelopmental outcomes were associated with childhood exposure to the top organophosphate flame retardant identified by our screen. This work identifies toxicological vulnerabilities for oligodendrocyte development and highlights the need for deeper scrutiny of these compounds' impacts on human health.


Conflict of interest statement

COMPETING INTERESTS:

The authors declare no competing interests related to this work.

Figures

Extended Data Fig. 1:
Extended Data Fig. 1:. Screening a library of environmental chemicals in developing oligodendrocytes identifies cytotoxic chemicals and modulators of oligodendrocyte generation.
a. Representative heatmaps of one of 6 primary screening 384-well plates depicting cytotoxic compounds (red), oligodendrocyte inhibitors (blue), and drivers (yellow). Viability and percent O1+ oligodendrocytes are normalized to DMSO vehicle control (−). Thyroid hormone, a known driver of oligodendrocyte generation, is included as a positive control (+) for oligodendrocyte development. Cytotoxic hits (gray) were omitted from heatmap displaying normalized O1 percentage. b. Quantification of hits across 6 primary screening plates showing distribution of chemicals identified as cytotoxic (black), drivers (green), and inhibitors (blue). c. Top use categories for 206 validated cytotoxic chemicals and the number of chemicals belonging to each category. d. Venn diagram showing the overlap of 206 validated cytotoxic chemicals identified in the oligodendrocyte screen compared to cytotoxic hits identified in an identical screen performed in mouse astrocytes.
Extended Data Fig. 2:
Extended Data Fig. 2:. Quaternary compounds are selectively cytotoxic to oligodendrocytes through activation of the integrated stress response.
a-b. mPSC-derived oligodendrocytes and primary mouse oligodendrocytes were treated with 20 μM methyltrioctylammonium chloride and tributyltetradecylphosphonium chloride. a. Representative images showing DAPI and O1 immunostaining. Scale bar, 50 μm. b. Quantification of viability normalized to DMSO. Data are mean ± SD, n=3 biological replicates. c-h. Viability of mouse PSC-derived oligodendrocytes, primary astrocytes, and fibroblasts, normalized to DMSO after treatment with quaternary compounds. Data are mean ± SEM, n=3 biological replicates. i. IC50 concentrations of quaternary compounds in mouse oligodendrocytes, astrocytes, and fibroblasts, n=3 biological replicates. j. Viability of oligodendrocytes normalized to DMSO cultured in the presence of methyltrioctylammonium chloride, ADEBC (C12-C14), or cetylpyridinium chloride at their respective IC75 and QVD-OPH, necrostatin-1, and ferrostatin-1. Data are mean, n=3 biological replicates k,l. Volcano plot of differentially expressed genes in oligodendrocytes treated with 370 nM (IC75) ADEBC (C12-C14) (k) or 181 nM (IC75) cetylpyridinium chloride (l) for 4 hours. Log2FC and padj were calculated with DESeq2. Genes highlighted in red increased (padj ≤ 0.05), n=3 biological replicates. Top 10 genes with the greatest Log2FC are labelled. m. qRT-PCR of CHOP in oligodendrocytes treated with DMSO, or top toxic compounds identified in the primary screen (not quaternary compounds). Oligodendrocytes were cultured for 4 hours in the presence of chemicals at IC75 or 20 μM if the calculated IC75 exceeded the primary screening concentration (388 nM Basic Blue 7, 20 μM 3,3’-dimethylbenzidine, 7.14 μM diisononyl cyclohexane-1,2-dicarboxylate, 1.82 μM 3,3’-dimethoxybenzidine, or 20 μM 2,4-dimethylphenol). Data are mean ± SD, n=3 biological replicates. p-values calculated using one-way ANOVA with Dunnett post-test correction for multiple comparisons. n. qRT-PCR of CHOP in fibroblasts treated for 4 hours normalized to DMSO. Quaternary compounds were tested at their IC75 (calculated from dose response testing in fibroblasts) or 20 μM if IC75 > 20 μM (2.0 μM methyltrioctylammonium chloride, 18.8 μM ADEBC (C12-C14), 20 μM cetylpyridinium chloride). Data are mean ± SD, n=3 biological replicates. p-values calculated using one-way ANOVA with Dunnett post-test correction for multiple comparisons. o. Oligodendrocyte viability (normalized to DMSO) after treatment with quaternary compounds (IC75) and JSH-23 or Pifithrin-μ. Data shown as mean, n=3 biological replicates.
Extended Data Fig. 3:
Extended Data Fig. 3:. Quaternary compounds are toxic to mouse oligodendrocytes in vivo and in human cortical organoids.
a,b. Brain and liver concentration of methyltrioctylammonium chloride, ADEBC (C12-C14), and cetylpyridinium chloride after oral gavage (P9-P10). Data are mean ± SD, n=3 or 1 mice (100 mg/kg/day methyltrioctylammonium chloride mice presented from n=1 mouse due to lethality to other mice included in the study). c. Survival of mice treated with vehicle or cetylpyridinium chloride, n=8 (vehicle), n=10 (10 mg/kg/day), n=11 (1 mg/kg/day). Mice were considered dead if found dead in their cage or cannibalized by dam. d-k. Mice were gavaged P5-P14 with vehicle (water) or 1 mg/kg/day cetylpyridinium chloride. Measurement of daily body (d), P14 liver (e), and P14 brain (f) weights. g. P14 cetylpyridinium chloride liver concentration, with analyte concentrations below the lower limit of detection (1 ng/mL) coded as 0. h. Representative images showing DAPI and SOX10 immunostaining. i. Quantification of oligodendrocyte lineage cell density (SOX10+ per mm2) in cortex and hippocampus of P14 mice. j. Representative images showing DAPI and NEUN immunostaining. k. Quantification of neuron density (NEUN+ per mm2) in cerebellum, cortex, and hippocampus of P14 mice. Data are mean ± SD, n=8 or 9 mice. p-values calculated using unpaired two-tailed t test (e, f, i, k). Scale bars, 50 μm (h, j). l-o. Human cortical organoids were treated with DMSO, 94 nM methyltrioctylammonium chloride, 370 nM ADEBC (C12-C14), or 181 nM cetylpyridinium chloride (IC75). l. Representative images showing immunostaining of oligodendrocyte lineage cells (SOX10+), progenitors (SOX2+), and neurons (NeuN+). Scale bar, 50 μm. Quantification of pre-OPC (SOX2+SOX10+ per mm2) (m), other progenitor (SOX2+SOX10− per mm2) (n), and neuron (NeuN+ per mm2) (o) densities in whole cortical organoids. Data are mean ± SD, n= 22, 24, 29, or 30 biological replicates (individual organoids from 4 independent batches), colored based on batch. p-values calculated using one-way ANOVA with Dunnett post-test correction for multiple comparisons.
Extended Data Fig. 4.
Extended Data Fig. 4.. Organophosphate flame retardants inhibit the development of mouse oligodendrocytes in vitro and in vivo.
a. Primary chemical screen of 1,531 non-cytotoxic environmental chemicals showing the effect of individual chemicals on oligodendrocyte generation, presented as percent O1+ cells normalized to the DMSO control, as shown in Fig. 2a. Dotted lines show the hit cutoffs for drivers and inhibitors. Drivers increase O1+ percentage by 22% (>3 SDs). Inhibitors reduce O1+ percentage by more than 50% (>7 SDs). Thyroid modulators are highlighted in yellow. b. IC50 concentrations, cytotoxicity median values, and use categories for three organophosphate esters identified as inhibitors of oligodendrocyte development, n=3 biological replicates. c-d. mPSC-derived OPCs and mouse primary OPCs were treated with organophosphate flame retardants (20 μM). c. Representative images showing DAPI and O1 immunostaining, scale bar, 50 μm. d. Quantification of oligodendrocytes (O1+). e-f. mPSC-derived OPCs were treated with 20 μM TBPP or TMPP. Representative images (e) and quantification (f) of early (O4+), intermediate (O1+), and late (MBP+) oligodendrocytes. Control images and TDCIPP treated oligodendrocytes are shown in Fig. 2e. Nuclei are marked with DAPI. Scale bar, 50 μm (e). Data are mean ± SEM, n=3 biological replicates p-values calculated using two-way ANOVA (ANOVA p=) for overall chemical differences with Dunnett’s multiple comparison test for differences within each time point (p =) (f). g-l. Mice were treated with vehicle (corn oil), 10 mg/kg/day, or 100 mg/kg/day TDCIPP. Measurement of P14 body (g), brain (h), and liver (i) weights. j. TDCIPP liver concentrations at P14, with analyte concentrations below lower limit of detection (10 ng/mL) coded as 0. k. Representative images showing DAPI, SOX10, and CC1 immunostaining Scale bar, 50 μm. l. Quantification of oligodendrocyte density (SOX10+CC1+ per mm2) in the hippocampus and cortex of P14 mice. Data are mean ± SD from n = 8 or 9 mice (g-j, l). p-values were calculated using one-way ANOVA with Dunnett post-test correction for multiple comparisons (g-i, l).
Extended Data Fig. 5:
Extended Data Fig. 5:. TDCIPP is associated with abnormal neurodevelopmental outcomes in children.
a. Representative images of human cortical organoids treated with 18.7 μM TDCIPP for 10 days, showing DAPI and NEUN immunostaining. Scale bar, 50 μm. b. Quantification of neurons (NEUM+ per mm2) in whole cortical organoids. Data are mean ± SD from n = 21 or 29 biological replicates (individual organoids from 4 independent batches). Data points are colored based on organoid batch. p-values calculated using unpaired two-tailed t test. c. Venn diagram showing co-occurrence of two neurodevelopmental outcomes in the study population. d-e. Adjusted odds ratio and associated p-values for covariates used in the logistic regression model for the neurodevelopmental outcomes requiring special education and gross motor dysfunction, n = 1564 or 1566. Significant odds ratios (p-value ≤ 0.05) are indicated by closed circles. Closed or open circles are the odds ratio and error bars indicate the 95% CI. Odds ratios and p-values were generated and visualized with the “survey” and “gtsummary” R packages. The Wald test was used to calculate p-values.
Fig. 1:
Fig. 1:. Quaternary compounds are potently cytotoxic to developing oligodendrocytes.
a. Schematic of the primary chemical screen in mPSC-derived oligodendrocytes. b. Pie chart of chemical hit categories from the primary screen. c. Representative images of oligodendrocytes cultured with DMSO (vehicle control), or one of three chemicals belonging to distinct hit categories identified by the primary screen, performed in one biological replicate. Nuclei are marked using DAPI and oligodendrocytes are marked using O1 . Scale bar, 50 μm. d. Primary chemical screen results displayed as viability normalized to DMSO. The solid line represents the average of the DMSO control (100%). The dotted line marks a reduction in viability of 30% (>3 SDs). The 206 cytotoxic hits that pass this threshold and were validated by MTS are colored in black. Non-cytotoxic chemicals and cytotoxic hits not validated by MTS are colored in gray. e. Characteristics of 49 oligodendrocyte-specific cytotoxic hits tested in 10-point dose response from (40 nM to 20 μM). IC50 values were determined with curve-fitting (nonlinear regression) and compared to median cytotoxicity values obtained from the EPA database for each chemical. Potency scores were calculated by dividing the cytotoxicity median by the experimentally determined IC50 in oligodendrocytes. Chemicals were ranked based on increasing potency score. Table also includes each chemical’s use category. f. Chemotype analysis for the 49 oligodendrocyte-specific cytotoxic compounds, with the most enriched structural domain, bond.quatN_alkyl_acyclic (p-value = 0.002, OR = 16.2), highlighted in red. p-values were generated using a one-sided Fisher’s exact test. g. Chemical structures for quaternary compounds. The enriched cytotoxicity-associated bond for quaternary ammonium compounds is highlighted in red. The quaternary phosphonium bond is highlighted in orange. h-k. Viability of oligodendrocytes, astrocytes, and fibroblasts treated with quaternary compounds, normalized to DMSO and IC50 determined by curve fitting. Data are presented as mean ± SEM, n = 3 biological replicates for each cell type.
Fig. 2:
Fig. 2:. Quaternary compounds activate the integrated stress response and are cytotoxic to human oligodendrocytes.
a-c. Oligodendrocytes were treated with quaternary compounds at IC75 (94 nM methyltrioctylammonium chloride, 370 nM ADEBC (C12-C14), and 181 nM cetylpyridinium chloride) for 4 hours. a. Volcano plot of differentially expressed genes after treatment with methyltrioctylammonium chloride. Genes in red increased (padj ≤ 0.05), as analyzed by DESeq2. Top 10 genes with the greatest log2FC are labelled. Gene set enrichment analysis (GSEA) of hallmark gene sets, with dots colored black if q-value > 0.05 (b), and an integrated stress response gene set (c), n=3 biological replicates. d. qRT-PCR of CHOP in oligodendrocytes and fibroblasts treated with DMSO, or quaternary compounds at IC75. Data are mean ± SD, n=3 biological replicates. p-values were calculated using one-way ANOVA with Dunnett post-test correction for multiple comparisons. Data for fibroblasts treated with additional concentrations are shown in Extended Data Fig. 2n. e. Oligodendrocyte viability normalized to DMSO after treatment with methyltrioctylammonium chloride, ADEBC (C12-C14), or cetylpyridinium chloride at IC75, in combination with QVD-OPH (10 μM) and/or ISRIB (5 μM). Data are mean ± SD, n=3 biological replicates. f-i. Mice were gavaged daily with vehicle (water) or 1 mg/kg/day cetylpyridinium chloride from P5-P14. f. Schematic depicting delivery scheme. g. P14 cetylpyridinium chloride brain concentration, with analyte concentrations below the lower limit of detection (1 ng/mL) coded as 0. h. Representative images showing DAPI and SOX10 immunostaining. i. Quantification of SOX10+ oligodendrocytes in the corpus callosum and cerebellum. Data are mean ± SD, n=8 or 9 mice. p-values were calculated using an unpaired two-tailed t-test. j-m. Human cortical organoids were treated with DMSO, methyltrioctylammonium chloride, ADEBC (C12-C14), or cetylpyridinium chloride at IC75. j. Schematic depicting 10-day treatment. k. Representative images showing DAPI and SOX10 immunostaining. Quantification of total cell number (DAPI+ per mm2) (l) and oligodendrocytes (SOX10+ per mm2) (m), in whole cortical organoids. Data are mean ± SD from n = 22, 24, 29, or 30 biological replicates (individual organoids generated from 4 independent batches). Individual data points are colored based on organoid batch. p-values were calculated using one-way ANOVA with Dunnett post-test correction for multiple comparisons (l, m). Scale bar, 50 μm (h, k).
Fig. 3:
Fig. 3:. Organophosphate flame retardants arrest oligodendrocyte maturation.
a. Primary chemical screen showing the effect of 1,531 non-cytotoxic environmental chemicals on oligodendrocyte development displayed as percent O1+ cells normalized to DMSO. Dotted lines mark ± 3 SDs. The blue dotted line marks the inhibitor hit cutoff, a reduction in O1+ cells of 50% (>7 SDs). The 47 oligodendrocyte inhibitors that pass this threshold are colored in blue. b. Chemotype analysis for oligodendrocyte inhibitors showing both the p-value and odds ratio. Among the top most significant structural domains, bond.P.O_phosphate_alkyl_ester (p-value = 0.02 , OR = 12.5) has the highest odds ratio, and is highlighted in dark blue. p-values generated using a one-sided Fisher’s exact test. c. Chemical structures for three organophosphate flame retardants containing the structure bond.P.O_phosphate_alkyl_ester, highlighted in blue. d. Percentage of (O1+) oligodendrocytes treated with organophosphate flame retardants normalized to DMSO. Data are mean ± SEM, n=3 biological replicates. e. Schematic showing stages of in vitro oligodendrocyte development and the markers for early (O4), intermediate (O1), and late (MBP) oligodendrocytes. f-g. Representative images (f) and quantification (g) of early (O4+), intermediate (O1+), and late (MBP+) oligodendrocytes after treatment with DMSO or 20 μM TDCIPP for 1, 2, and 3 days of maturation. Nuclei are marked using DAPI. Images and quantification for oligodendrocytes treated with TMPP and TBPP are shown in Extended Data Fig. 4e,f. Data are mean ± SEM, n=3 biological replicates. p-values were calculated using two-way ANOVA (ANOVA p =) for overall chemical differences with Dunnett’s multiple comparison test for differences within each time point (p = ). h-k. Mice were treated with vehicle (corn oil), 10 mg/kg/day, or 100 mg/kg/day TDCIPP from P5-P14. h. TDCIPP brain concentration at P14, analyte concentrations below the lower limit of detection (10 ng/mL) coded as 0. i. Representative images showing DAPI, SOX10, and CC1 immunostaining and quantification of SOX10+CC1+ oligodendrocytes in the cerebellum (j) and corpus callosum (k). Data are mean ± SD from n=8 or 9 mice. p-values calculated using one-way ANOVA with Dunnett post-test correction for multiple comparisons. Scale bar, 50 μm (f, i).
Fig. 4:
Fig. 4:. TDCIPP inhibits human oligodendrocyte development and is associated with abnormal neurodevelopmental outcomes in children.
a-d. Human cortical organoids were treated with DMSO or TDCIPP at IC75 (18.7 μM). a. Representative images of human cortical organoids showing DAPI, SOX10, and CC1 immunostaining. Scale bars, 50 μm. Quantification total cell number (DAPI+ per mm2) (b), oligodendrocytes (SOX10+CC1+ per mm2) (c), and oligodendrocyte progenitors (SOX10+CC1− per mm2) (d), in whole cortical organoids. Data are mean ± SD, n = 21 or 29 biological replicates (individual organoids generated from 4 independent batches). Data points are colored based on organoid batch. p-values were calculated using unpaired two-tailed t test. e. Pie chart showing the number of children ages 3-11 years old from the NHANES 2013-2014, 2015-2016, and 2017-2018 datasets with undetectable and detectable levels of BDCIPP, the urine metabolite of TDCIPP. f. Creatinine-normalized levels of BDCIPP in children (3-11 years old), n = 1762, and adults (>18 years), n = 4988. p-value calculated using the two-sided Mann-Whitney U-test. g. Creatinine-normalized levels of BDCIPP in children 3-11 years of age across three NHANES data cycles, n = 337, 675 or 749. p-values were calculated using the Kruskal-Wallis test with Dunn’s multiple comparisons test. h. Range and quartiles of urine BDCIPP levels in children ages 3-11 years old from the NHANES 2013-2014, 2015-2016, and 2017-2018 datasets. i. Proportions of all US children in each urinary BDCIPP quartile, who utilize special education or have motor dysfunction. j. Fully adjusted odds ratio for the neurodevelopmental outcomes: special education and motor dysfunction, n = 1564 or 1566. Significant odds ratios (p-value ≤ 0.05) are indicated by closed circles (BDCIPP Q4 v Q1 OR 2.0 [95% CI = 1.0-3.8] for special education; BDCIPP Q3 v Q1 OR 4.2 [95% CI = 1.1-16.2], and BDCIPP Q4 v Q1 OR 6.0 [95% CI = 1.7-21.9] for motor dysfunction). Closed and open circles are the odds ratio and error bars indicate the 95% CI. Odds ratios and p-values were using the “survey” and “gtsummary” R packages. The Wald test was used to calculate p-values. Data for odds ratios and p-values calculated for all covariates are shown in Extended Data Fig. 5 d,e.

Update of

References

    1. Sanmarco LM, et al. Identification of environmental factors that promote intestinal inflammation. Nature (2022). - PMC - PubMed
    1. Wheeler MA, et al. Environmental Control of Astrocyte Pathogenic Activities in CNS Inflammation. Cell 176, 581–596 e518 (2019). - PMC - PubMed
    1. Lidsky TI & Schneider JS Lead neurotoxicity in children: basic mechanisms and clinical correlates. Brain 126, 5–19 (2003). - PubMed
    1. Grandjean P & Landrigan PJ Neurobehavioural effects of developmental toxicity. Lancet Neurol 13, 330–338 (2014). - PMC - PubMed
    1. Grandjean P & Landrigan PJ Developmental neurotoxicity of industrial chemicals. Lancet 368, 2167–2178 (2006). - PubMed

METHODS-ONLY REFERENCES:

    1. Najm FJ, et al. Isolation of epiblast stem cells from preimplantation mouse embryos. Cell Stem Cell 8, 318–325 (2011). - PMC - PubMed
    1. Najm FJ, et al. Transcription factor-mediated reprogramming of fibroblasts to expandable, myelinogenic oligodendrocyte progenitor cells. Nat Biotechnol 31, 426–433 (2013). - PMC - PubMed
    1. Allan KC, et al. Non-canonical Targets of HIF1a Impair Oligodendrocyte Progenitor Cell Function. Cell Stem Cell 28, 257–272 e211 (2021). - PMC - PubMed
    1. Hubler Z, et al. Accumulation of 8,9-unsaturated sterols drives oligodendrocyte formation and remyelination. Nature 560, 372–376 (2018). - PMC - PubMed
    1. Bankhead P, et al. QuPath: Open source software for digital pathology image analysis. Sci Rep 7, 16878 (2017). - PMC - PubMed

Publication types

LinkOut - more resources