. 2024 May;27(5):913-926.
doi: 10.1038/s41593-024-01604-8. Epub 2024 Mar 25.

Piezo1 regulates meningeal lymphatic vessel drainage and alleviates excessive CSF accumulation

Affiliations

Piezo1 regulates meningeal lymphatic vessel drainage and alleviates excessive CSF accumulation

Dongwon Choi et al. Nat Neurosci. 2024 May.

Abstract

Piezo1 regulates multiple aspects of the vascular system by converting mechanical signals generated by fluid flow into biological processes. Here, we find that Piezo1 is necessary for the proper development and function of meningeal lymphatic vessels and that activating Piezo1 through transgenic overexpression or treatment with the chemical agonist Yoda1 is sufficient to increase cerebrospinal fluid (CSF) outflow by improving lymphatic absorption and transport. The abnormal accumulation of CSF, which often leads to hydrocephalus and ventriculomegaly, currently lacks effective treatments. We discovered that meningeal lymphatics in mouse models of Down syndrome were incompletely developed and abnormally formed. Selective overexpression of Piezo1 in lymphatics or systemic administration of Yoda1 in mice with hydrocephalus or Down syndrome resulted in a notable decrease in pathological CSF accumulation, ventricular enlargement and other associated disease symptoms. Together, our study highlights the importance of Piezo1-mediated lymphatic mechanotransduction in maintaining brain fluid drainage and identifies Piezo1 as a promising therapeutic target for treating excessive CSF accumulation and ventricular enlargement.


Conflict of interest statement

The authors disclose no conflict of interest with this study except that The University of Southern California has filed a patent application, entitled ‘Methods and compositions for fluid drainage by Piezo ion channel activation’ on behalf of Y.-K.H. and D.C.

Figures
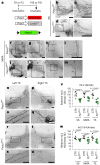
Fig. 1
Fig. 1. Piezo1 is required for mLV development.
a, Diagram depicting the experimental strategy for conditional lymphatic Piezo1 deletion. Tamoxifen (50 mg per kg (body weight)) was subcutaneously injected into neonatal pups at postnatal day 2 (P2) or P3. Wild-type Piezo1 (Piezo1WT) control (CTR) mice have Prox1-tdTomato, Prox1-CreERT2 and Piezo1+/+ alleles, whereas Piezo1dLEC mice have Prox1-tdTomato, Prox1-CreERT2 and Piezo1fl/fl alleles. bu, Mice were killed at P16 (bm) or P21 (nu), and their meninges were collected to capture mLV images. mLVs were visualized by the red fluorescent signals produced by the Prox1-tdTomato lymphatic reporter allele. v,w, Relative vessel density (v) and thickness (w) of mLVs in the sigmoid sinus (SS; be), middle meningeal artery (MMA) region (fm) and transverse sinus (TS) region (nu) in control or Piezo1dLEC mice are shown; scale bars, 500 µm; Pz1dLEC, Piezo1dLEC mice. Each data point represents one mouse; n = 6 mice per group. Data were analyzed by two-tailed t-test and are presented as mean values ± s.e.m. Source data
Fig. 2
Fig. 2. Effects of altered lymphatic Piezo1 expression on brain fluid drainage and CSF homeostasis.
a, Experimental scheme. Adult wild-type control (Prox1-CreERT2; Piezo1+/+; Prox1-tdTomato) and lymphatic Piezo1 deletion mice (Prox1-CreERT2; Piezo1fl/fl; Prox1-tdTomato) were i.p. injected with tamoxifen (50 mg per kg (body weight) twice, 3 days apart) at the age of 6 weeks. Three days after the second tamoxifen administration, a brain fluid tracer (ovalbumin Alexa Fluor 488 conjugate (OVA-Green); 3.5 µl, 0.5 mg ml–1) was i.c.m. injected. After 60 min, the cervical and mandibular LNs were collected and imaged; D, day. b, Fluorescence images of the collected cervical and mandibular LNs; scale bar, 0.5 mm. c, Quantification of the relative intensity of OVA-Green signal in the LNs. One data point represents the sum of the fluorescence intensity of the left and right LNs of a single mouse; n = 6–9 mice per group. dg, Control and lymphatic Piezo1-mutant pups (Prox1-CreERT2; Piezo1fl/fl) were subcutaneously injected with tamoxifen (50 mg per kg (body weight)) at P4. After 6 weeks, brain MRI was performed, magnetic resonance images were acquired (d), and ventricular volumes (e) were measured. Three-dimensional rendered images of the brain MRI are shown (Extended Data Fig. 3). ICP (f) and relative brain fluid content (g) were assessed 1 day after MRI. In eg, each data point corresponds to a single mouse; n = 5–8 mice per group. hj, Targeted lymphatic Piezo1 overexpression promotes brain fluid tracer clearance. h, Experimental scheme showing adult wild-type control (Prox1-CreERT2; Prox1-tdTomato) and lymphatic Piezo1-transgenic (Piezo1TG_LEC) mice (Prox1-CreERT2; Piezo1TG; Prox1-tdTomato) injected i.p. with tamoxifen (50 mg per kg (body weight) twice, 3 days apart) at the age of 7–8 weeks. Three days later, a green fluorescent tracer (OVA-Green) was i.c.m. injected. After 45 min, the cervical LNs were collected and imaged. The Piezo1 transgenic overexpression construct contains a nonfunctional mutant eGFP gene and four tandem copies of poly(A) (p(A)) sequences flanked by loxP sequences. i, Fluorescence images of the collected cervical LNs; scale bar, 1 mm. j, Relative intensity of OVA-Green signal in the LNs was quantified. Each data point represents the sum of the fluorescence intensity of LNs on the right and left sides of a single mouse; n = 4–6 mice per group. Pz1dLEC, Piezo1dLEC mice; Pz1TG, Piezo1TG_LEC mice. Data were analyzed by two-tailed t-test and are presented as mean values ± s.e.m. Source data
Fig. 3
Fig. 3. Local and systemic activation of Piezo1 stimulates brain fluid drainage.
ac, Experimental scheme (a). A red fluorescent tracer (albumin-Alexa Fluor 594 (ALB-Red)) was premixed with vehicle or Yoda1 (50 µM, final) and i.c.m. injected into Prox1-eGFP mice in two age groups (7 weeks old and 10 months old, five to six mice per group). After 45 min, the cervical LNs were collected and imaged (b), and their relative fluorescence intensities were graphed (c); n = 5–6 mice per group. Data were analyzed by one-way analysis of variance (ANOVA; P < 0.0001) followed by a Bonferroni multiple comparison test. d, Percent increase in drainage by Yoda1 treatment in each age group, which was calculated by dividing the intensity of individual Yoda1-treated LNs by the average intensity value of all vehicle-treated LNs; n = 5–6 mice per group. Data were analyzed by two-tailed t-test. eg, Systemic Yoda1 pretreatment by i.p. injection expedited brain tracer drainage. Prox1-eGFP mice (7 weeks old and 10 months old) were i.p. injected with vehicle or Yoda1 (213 µg per kg (body weight)) at 18 h and 90 min before i.c.m. injection of ALB-Red. After 45 min, the cervical LNs were collected and imaged (e), and the relative intensity of drained tracer is shown (f). Each data point represents the sum of the fluorescence intensity of LNs on both sides of one mouse; n = 4–9 mice per group. Data were analyzed by one-way ANOVA (P < 0.0001) followed by a Bonferroni multiple comparison test. g, Drainage enhancement by Yoda1 in each age group; n = 4–9 mice per group. Data were analyzed by two-tailed t-test; scale bars, 500 µm (b and e). h, Time-lapse image analysis showing Yoda1-induced enhancement of brain tracer drainage. Mice were systemically pretreated (i.p. injection) with vehicle or Yoda1 (213 µg per kg (body weight)) at 18 h and 90 min before i.c.m. injection of Indocyanine Green (ICG). Time-lapse images of ICG drained to LNs were captured at the indicated times after injection (Extended Data Fig. 6), and the relative fluorescence intensity was graphed; n = 6 mice per group. Data were analyzed by two-way repeated measures ANOVA (P = 0.0007). ik, Lymphatic Piezo1 deletion abolishes the Yoda1-induced enhancement of CSF outflow. Adult control (Prox1-tdTomato) and lymphatic Piezo1-null (Piezo1dLEC; Prox1-tdTomato) mice were i.p. injected with tamoxifen (50 mg per kg (body weight) twice, 3 days apart) at the age of 8 weeks. A fluorescent tracer (OVA-Green), premixed with vehicle (Veh) or Yoda1 (50 µM, final), was i.c.m. injected into control and Piezo1dLEC mice 6 days after the first injection of tamoxifen. After 45 min, LNs were collected and imaged (i). j,k, Quantification of relative tracer intensity in LNs (n = 8–9 mice). Each data point represents the total fluorescence intensity of LNs on both sides of one mouse; scale bars, 500 µm; Pz1dLEC, Piezo1dLEC mice. Data were analyzed by Kruskal–Wallis H-test (P < 0.0001) followed by a Bonferroni multiple comparison test (statistical significance, P < 0.0083; j) and one-way ANOVA (P < 0.0001) followed by a Bonferroni multiple comparison test (k). Data are presented as mean values ± s.e.m. Source data
Fig. 4
Fig. 4. Enhanced lymphatic drainage and transport by Piezo1 activation.
a, Increased phosphorylation of CDH5 (Try 658), VEGFR2 (Tyr 1054/Tyr 1059) and VEGFR3 (Tyr 1230/Tyr 1231) in cultured primary human LECs in vitro treated with Yoda1 (0.5 µM, final). b, CDH5 immunofluorescence stains showing increased junctional gaps (arrowheads) in 2D LEC in vitro cultures after Yoda1 treatment at 0.5, 1 or 2 µM for 8 h; scale bars, 20 µm. c, Piezo1-dependent increase in drainage efficiency of engineered lymphatics in vitro. Primary LECs were transfected with control (scrambled) or Piezo1 short interfering RNA (siRNA) for 24 h, used to build lymphatics in 3D PDMS chips and treated with vehicle or Yoda1 (1 µM, final) to evaluate drainage capability. Detailed images for the engineered lymphatics are shown in Extended Data Fig. 9; siCTR and vehicle, n = 7 independent experiments; siCTR and Yoda1, n = 8 independent experiments; siPiezo1 and vehicle, n = 8 independent experiments; siPiezo1 and Yoda1, n = 5 independent experiments. Data were analyzed by one-way ANOVA (P = 0.0097) followed by a Bonferroni multiple comparison test. d, Lymphatic vessel contractility test. Surgically excised axillary collecting lymphatics were treated with vehicle, Yoda1 or l-NAME + Yoda1 at the indicated intraluminal pressures, and the percent vessel tone was measured. Additional functionality values are shown in Extended Data Fig. 10; n = 6 independent samples. Data were analyzed by two-way repeated measures ANOVA (P = 0.003) between treatments followed by Tukey’s multiple comparison test; P < 0.0001 between control and Yoda1; P = 0.0004 between control and l-NAME + Yoda1; P < 0.0001 between Yoda1 and l-NAME + Yoda1. e, Inhibition of Piezo1 downstream effectors suppresses Yoda1-induced promotion of brain tracer drainage. Fluorescent tracer (OVA-Green) was premixed with vehicle, Yoda1 (50 µM, final) or Yoda1 (50 µM, final) + inhibitors, such as l-NAME (eNOS), capivasertib (Cap; AKT), axitinib (Axi; VEGFR1–VEGFR3), SAR131675 (SAR; VEGFR3) or cabozantinib malate (Cab; VEGFR2; 258 µg ml–1 final concentration of each inhibitor), and i.c.m. injected into Prox1-tdTomato mice (15 weeks old). After 45 min, LNs were collected and imaged; scale bars, 500 µm. f,g, Quantification of relative tracer intensity in cervical (f) and mandibular (g) LNs (n = 7 mice per group). One data point represents the sum of the fluorescence intensity of LNs of both sides of a single mouse. Data were analyzed by one-way ANOVA (P < 0.0001) followed by Tukey’s multiple comparison test. h,i, Protein expression levels of VEGF-C (h) and VEGF-D (i) were measured in the whole brains of mice that were treated with vehicle or Yoda1 (213 µg per kg (body weight) two times at 18 h and 90 min before tissue collection) or in the whole brains of control or Piezo1TG_LEC mice that were i.p. injected with tamoxifen (50 mg per kg (body weight) twice, 3 days apart) at the age of 8 weeks. Pz1TG, Piezo1TG_LEC mice. Each data point represents one mouse (n = 5 mice per group). Data were analyzed by two-tailed t-test and are presented as mean values ± s.e.m. Source data
Fig. 5
Fig. 5. Lymphatic Piezo1 overexpression ameliorates hydrocephalus phenotypes.
a, Adult wild-type control (Prox1-CreERT2; Prox1-tdTomato) or lymphatic Piezo1TG_LEC (Prox1-CreERT2; Prox1-tdTomato; Piezo1TG) mice (6–8 weeks old) were i.p. injected with tamoxifen (50 mg per kg (body weight)) on days 1 and 4 to induce Piezo1 overexpression in lymphatics. On day 7, the kaolin-based hydrocephalus (hydro) model was established, as described in the Methods. bd, On day 10, a fluorescent tracer (OVA-Green) was i.c.m. injected, and, after 60 min, the cervical and mandibular LNs were collected and imaged (b). The relative amounts of tracer drained to the cervical (c) and mandibular (d) LNs were quantified. One data point represents the sum of the fluorescence intensity of LNs of both sides of one mouse (n = 6–8 mice per group). Data were analyzed by one-way ANOVA (P < 0.0001) followed by Tukey’s multiple comparison test; scale bars, 500 µm. e,f, T2-weighted brain magnetic resonance images were captured on day 11 (e), and the ventricular volume was quantified (n = 5–6 mice per group; f). Three-dimensional rendered images of the brain MRI are shown (Extended Data Fig. 3). Data were analyzed by one-way ANOVA (P < 0.0001) followed by a Bonferroni multiple comparison test. gm, Brain fluid content (g) and ICP (h) were measured on day 11, and physical activity (im) was evaluated on day 10 (n = 6–8 mice per group). Data were analyzed by one-way ANOVA (P < 0.0001) followed by Tukey’s multiple comparison test (g and k), one-way ANOVA (P < 0.0001 (h and i), P = 0.005 (j) and P = 0.002 (l)) followed by a Bonferroni multiple comparison test or Kruskal–Wallis H-test (P = 0.0006 (l) and P < 0.0001 (m)) followed by a Bonferroni multiple comparison test (statistical significance, P < 0.0083). Each data point represents one mouse, whereas one data point in b and c is the sum of the fluorescence intensity of the left and right LNs of one mouse. Pz1TG, Piezo1TG_LEC mice. Data are presented as mean values ± s.e.m. Source data
Fig. 6
Fig. 6. Yoda1-mediated activation of Piezo1 suppresses hydrocephalus phenotypes.
a, Experimental scheme. The hydrocephalus model was induced in adult Prox1-eGFP mice (6–8 weeks old) on day 1, and mice were subsequently i.p. injected with Yoda1 (213 µg per kg (body weight) daily for 4 consecutive days from day 1). b,c, Brain magnetic resonance images were captured on day 6 (b), and ventricular volumes were calculated (c). Three-dimensional rendered images of the brain MRI are also shown in Extended Data Fig. 3. d,e, Brain fluid content (d) and ICP (e) were measured on day 6; n = 6–8 mice per group. Data were analyzed by one-way ANOVA (P < 0.0001) followed by Tukey’s multiple comparison test (c and e) or a one-way ANOVA (P < 0.0001) followed by a Bonferroni multiple comparison test (d). fh, On day 7, a fluorescent tracer (ALB-Red) was i.c.m. injected, and, after 60 min, the cervical and mandibular LNs were imaged (f) and quantified for the amount of drained tracer (g and h, respectively); n = 6 mice per group. Data were analyzed by Kruskal–Wallis H-test (P < 0.0001) followed by a Bonferroni multiple comparison test (statistical significance, P < 0.0167; g) or one-way ANOVA (P < 0.0001) followed by a Tukey’s multiple comparison test (h); scale bars, 500 µm. im, Mice were subjected to physical activity tests on day 5. Each data point represents one mouse, whereas one data point in g and h represents the sum of the fluorescence intensity of the left and right LNs of one mouse; n = 6–7 mice per group. Data were analyzed by Kruskal–Wallis H-test (P = 0.0004 (i) and P < 0.0001 (m)) followed by a Bonferroni multiple correction test (statistical significance, P < 0.0083), one-way ANOVA (P = 0.0028 (j) and P < 0.0001 (l)) followed by a Tukey’s multiple testing correction or one-way ANOVA (P < 0.0001) followed by a Bonferroni multiple testing correction (k). Data are presented as mean values ± s.e.m. Source data
Fig. 7
Fig. 7. Lymphatic Piezo1 overexpression reduces meningeal lymphatic malformation and ventriculomegaly in mice with DS.
a,b, Brightfield images showing distinct skull shapes (a) and T2-weighted brain MRIs displaying ventricular enlargement in Dp(16) mice with DS (b). Three-dimensional rendered images of the brain MRI are also shown in Extended Data Fig. 3. c,d, Ventricular volume (c) and ICP (d) of wild-type control and Dp(16) mice with DS. Each data point represents one mouse; n = 6–7 mice (6–8 weeks of age) per group. Data were analyzed by two-tailed t-test. e, mLVs in the transverse sinus (TS), confluence of sinuses (COS) and superior sagittal sinus (SSS) of wild-type (WT; Prox1-tdTomato) and Dp(16) mice with DS (Dp(16)1Yey; Prox1-tdTomato) were imaged (4 weeks old). f,g, Vessel density (f) and thickness (g) of mLVs were compared between wild-type mice and mice with DS (n = 4 mice per group). Data were analyzed by two-tailed t-test. Each data point in all graphs represents one mouse. h, A green fluorescent tracer (OVA-Green) was i.c.m. injected into control mice (Prox1-tdTomato) and mice with DS (Dp(16)1Yey; Prox1-tdTomato; 4 weeks old). After 60 min, the cervical and mandibular LNs were collected and imaged (n = 4 mice per group); scale bars, 500 µm. io, Lymphatic Piezo1 overexpression suppresses ventricular enlargement in a DS model. i, Experimental scheme. Young-adult control (Prox1-tdTomato), Piezo1TG_LEC (Prox1-tdTomato; Prox1-CreERT2; Piezo1TG), DS (Prox1-tdTomato; Dp(16)1Yey/+) and DS/Piezo1TG_LEC (Dp(16)1Yey/+; Prox1-tdTomato; Prox1-CreERT2; Piezo1TG; 4 weeks old) mice were i.p. injected with tamoxifen (day 1 and day 4) to induce lymphatic Piezo1 overexpression. j, After 7 weeks, the OVA-Green tracer was i.c.m. injected, and the cervical and mandibular LNs were collected and imaged after 45 min; scale bars, 500 µm. Longer-exposure images revealed a distinct difference in tracer drainage amounts between control mice and mice with DS (Supplementary Fig. 6a). k,l, Relative OVA-Green intensity was quantified for the cervical (k) and mandibular (l) LNs. One data point represents the sum of the fluorescence intensity of the left and right LNs of one mouse; n = 5–6 mice per group. Data were analyzed by Kruskal–Wallis H-test (P = 0.0003) followed by a Bonferroni multiple testing correction (statistical significance, P < 0.0083; k) or a one-way ANOVA (P < 0.0001) followed by a Tukey’s multiple comparison test (l). mo, Additional sets of mice were equally prepared and subjected to brain MRI (m), ventricular volume assessment (n) and brain fluid content quantification (o). Three-dimensional rendered images of the brain MRI are also shown in Extended Data Fig. 3; scale bars, 500 µm; n = 4–6 mice per group. Data were analyzed by one-way ANOVA (P = 0.0007 (n) and P < 0.0001 (o)) followed by a Bonferroni multiple testing correction. Each data point represents one mouse, whereas one data point in c and d represents the sum of the fluorescence intensity of the left and right LNs of one mouse. Data are presented as mean values ± s.e.m. Pz1TG, Piezo1TG_LEC mice. Source data
Fig. 8
Fig. 8. Systemic Yoda1 treatment enhances CSF drainage and reduces ventricle volume in a DS model.
a, Experimental scheme. Young-adult control mice (Prox1-tdTomato) and mice with DS (Prox1-tdTomato; Dp(16)1Yey/+; 4 weeks old) were i.p. injected with vehicle or Yoda1 (213 µg per kg (body weight)) every 2 days for 30 days. b, The OVA-Green tracer was then i.c.m. injected, and, after 45 min, cervical and mandibular LNs were collected and imaged; scale bars, 500 µm. Longer-exposure images revealed a clear difference in tracer drainage amounts between control mice and mice with DS (Supplementary Fig. 6b). c,d, Relative fluorescence intensity of the tracer drained to the cervical (c) and mandibular (d) LNs. One data point represents the total fluorescence intensity of the left and right LNs of one mouse; n = 7–9 mice per group. Data were analyzed by one-way ANOVA (P < 0.0001) followed by a Tukey’s multiple comparison test (c) or a Kruskal–Wallis H-test (P < 0.0001) followed by a Bonferroni multiple testing correction (statistical significance, P < 0.0083; d). e,f, Brain magnetic resonance imaging was conducted (e), and ventricular volume was determined (f). Three-dimensional rendered images of the brain MRI are also shown (Extended Data Fig. 3). g, Brain fluid content was measured; n = 5–12 mice per group. Data were analyzed by Kruskal–Wallis H-test (P < 0.0001) followed by a Bonferroni multiple testing correction (statistical significance, P < 0.0083; f) or a one-way ANOVA (P < 0.0001) followed by a Bonferroni multiple testing correction (g). Data are presented as mean values ± s.e.m. Source data
Extended Data Fig. 1
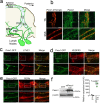
Extended Data Fig. 1. Expression of Piezo1 in Mouse Meningeal Lymphatic Vessels.
(a) Diagram illustrating the distribution of mouse meningeal lymphatic vessels (mLVs). SSS, Superior Sagittal Sinus; TS, Transverse Sinus; PSS, Petrosquamosal Sinus; SS, Sigmoid Sinus; PSF, Petrosquamous Fissure; MMA, Middle Meningeal Artery; PPA, Pterygopalatine Artery. (b) Expression of Piezo1 protein in mLVs. The meninges were isolated from adult Prox1-tdTomato mice and subjected to whole-mount staining with a rabbit anti-Piezo1 polyclonal antibody (generated by the authors). Scale bars, 50 µm. (c-e) Expression of LYVE1, VEGFR3, and PDPN in mLVs. The meninges from Prox1-EGFP mice were whole-mount stained with anti-LYVE1, anti-VEGFR3, or anti-PDPN antibodies. Scale bars, 100 µm. (f) Specificity test of the rabbit anti-Piezo1 polyclonal antibody. HEK293 cells were transiently transfected with a control vector or a mouse Piezo1-expressing vector. After 48 hours, western blot analyses were performed against the cell lysates using the rabbit anti-Piezo1 polyclonal antibody or a rabbit anti-beta actin antibody. Statistics: two-tailed t-test. Source data
Extended Data Fig. 2
Extended Data Fig. 2. Short-term Deletion of Piezo1 Doesn’t Lead to Significant Morphological Changes in Adult Meningeal Lymphatics.
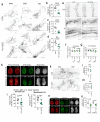
Adult wild-type control (CTR, Prox1-tdTomato) mice and lymphatic Piezo1 null mice (Pz1 dLEC) (Piezo1dLEC, Prox1-tdTomato) were i.p. injected with Tamoxifen (50 mg/kg, twice, three days apart) at the age of 8 weeks. (a) mLV images were captured six days after the first Tamoxifen injection. Scale bars: 200 µm. (b, c) Lymphatic vascular density (b) and thickness (c) in the control and Pz1 dLEC mice (n = 7 mice /group) were quantitated and compared. Statistics: two-tailed t-test. Data are presented as mean values +/- SEM. Source data
Extended Data Fig. 3
Extended Data Fig. 3. 3-D Rendering of MRI Scans for Ventricular Volume Measurements.
The two-dimensional MRI brain images presented in Fig. 2d, Fig. 5e, Fig. 6b, Fig. 7b, m, and Fig. 8e of the main figure section were rendered to three-dimensional representations in panels (a) through (f) using the Multi-image Analysis GUI (Mango) to display the volume of the ventricles. See Methods for details.
Extended Data Fig. 4
Extended Data Fig. 4. Essential Roles of the mLV Intraluminal Valves in Brain Fluid Drainage.
(a-j) Targeting Lymphatic Valves during the Developmental Phase in Neonates. Control mice (CTR) (Prox1-CreERT2; Piezo1+/+; Prox1-tdTomato) and lymphatic Piezo1 KO mice (Pz1 dLEC) (Prox1-CreERT2; Piezo1flox/flox; Prox1-tdTomato) were subcutaneously injected with Tamoxifen at a low dose (15 mg/kg) at P1 to target deletion of Piezo1 in lymphatic valves. The mice were euthanized at P21 for further analyses of lymphatic valves and vessels. (a) Microscopic images showing the presence of lymphatic valves (arrowheads) in the basal mLVs around Pterygopalatine Artery (PPA), Petrosquamous Fissure (PSF), and Sigmoid Sinus (SS). Scale bars: 500 µm. (b-d) Number of lymphatic valves in these areas was counted. n = 6 mice/group. (e) Images showing the absence of morphological changes of mLVs in mice (P21) treated with low dose Tamoxifen. Scale bars: 200 µm. The lymphatic vascular density (f) and thickness (g) in the control and Pz1 dLEC mice showed no significant differences. n = 6 mice/group (h) A brain fluid tracer (OVA-Green: Ovalbumin, Alexa Fluor™ 488 Conjugate) was i.c.m. injected at P21. The cervical and mandibular LNs were harvested and imaged 60 minutes after the tracer injection. Note dramatically diminished tracer drainages. Scale bars: 500 µm. (I, j) The relative OVA intensity in LNs was quantified. n = 10 mice/group. (k-o) Targeting Matured Lymphatic Valves in Adult Mice: Control (CTR) and Pz1 dLEC mice (6 months old) were i.p. injected with Tamoxifen at a low dose (15 mg/kg, twice, three days apart). After 6 days from the first tamoxifen administration, a brain fluid tracer (OVA-Green: Ovalbumin, Alexa Fluor™ 488 Conjugate) was i.c.m. injected, and the mice were euthanized to analyze lymphatic valves and brain fluid drainage. Lymphatic valves (arrowheads) around Pterygopalatine Artery (PPA) and Petrosquamous Fissure (PSF) were imaged (k) and their numbers were counted (I, m). n = 6 mice/group. (n) After 60 minutes from the tracer injection, the cervical and mandibular LNs were harvested and imaged. Scale bars: 500 µm. (o) The relative intensity of OVA-Green in LNs was quantified. n = 6 mice/group. Each data point represents the sum of the fluorescence intensity of LNs on the right and left sides of a single mouse (h, n). Statistics: (b, f) two-tailed Mann-Whitney U test. (c, d, g, i, j, l, m, o) two-tailed t-test. Statistics: two-tailed t-test. Data are presented as mean values +/- SEM. Source data
Extended Data Fig. 5
Extended Data Fig. 5. Absence of Detectable Lymphangiogenesis in Piezo1 Lymphatic Transgenic Mice After Brief Piezo1 Overexpression.
Adult control (Prox1-CreERT2; Prox1-tdTomato) and lymphatic Piezo1 transgenic mice (Pz1 TG) (Prox1-CreERT2; Piezo1TG; Prox1-tdTomato) were i.p. injected with Tamoxifen (50 mg/kg, twice, three days apart) at the age of 10 weeks. mLV images were captured 6 days after the first Tamoxifen injection (a). Relative lymphatic vascular density (b) and thickness (c) in the control and Pz1 TG mice (n = 8 mice/group) were quantitated. Scale bars: 200 µm. Statistics: (b) two-tailed Mann-Whitney U test. (c) two-tailed t-test. Data are presented as mean values +/- SEM. Source data
Extended Data Fig. 6
Extended Data Fig. 6. Systemic Yoda1 Administration Enhances Brain Fluid Tracer Outflow to Lymph Nodes.
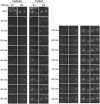
Time-lapse images showing lymphatic drainage of i.c.m. injected Indocyanine Green (ICG) to the mandibular LNs. Adult Prox1-EGFP mice (6-7 months, n = 6 mice/group) were i.p. injected with the vehicle or Yoda1 (213 µg/kg) at 18 hours and 90 minutes before ICG tracer injection (3.5 µL, 2.5 mg/mL). Time-lapse images of ICG tracer accumulated to the LNs were captured from 10 to 95 minutes post ICG injection. The GFP signal serves as the locational reference of the left- and right-side mandibular LNs. The relative amount of drained ICG was quantified and charted in Fig. 3h in the main figure section.
Extended Data Fig. 7
Extended Data Fig. 7. The Yoda1 Effect on Brain Fluid Outflow Persists Up to 24 Hours.
Adult wild-type lymphatic reporter mice (Prox1-tdTomato, 9-10 months old) were i.p. injected with the vehicle or Yoda1 (213 µg/kg) at seven days, 24 hours, 12 hours before tracer i.c.m. injection (OVA-Green: Ovalbumin, Alexa Fluor™ 488 Conjugate). After 45 minutes post tracer injection, LNs were collected and imaged to visualize the drained tracer (a). (b, c) The relative tracer intensity in the cervical LNs (b) and mandibular LNs (c) was quantified (n = 6 mice/group). Each data point represents the sum of the fluorescence intensity of LNs on the right and left sides of a single mouse. Scale bars: 500 µm. Statistics: Kruskal-Wallis H test, p = 0.0032 (b); p = 0.0002 (c), followed by Bonferroni correction method (statistical significance, p < 0.0083). Data are presented as mean values +/- SEM. Source data
Extended Data Fig. 8
Extended Data Fig. 8. AKT1, eNOS, CDH5, and VEGFR2 Proteins Are Rapidly Phosphorylated in Cultured Lymphatic Endothelial Cells Upon Yoda1 Treatment.
(a-f) Phosphorylation of eNOS (Ser1177) and AKT1 (Ser473) in cultured human primary dermal LECs after Yoda1 treatment at different concentrations for 10 minutes (a) or at a fixed concentration (1 µM) for different periods (d). The ratio of phosphorylated protein over the entire protein is expressed (b, c, e, f). (g-j) Phosphorylation of CDH5 (Y658, Y685) and VEGFR2 (Tyr1054/1059) in cultured human LECs after Yoda1 (0.3 µM) treatment for the indicated periods (g). The phosphorylation level relative to the entire protein is quantified (h-j). Experiments were repeated three times. Statistics: one-way ANOVA, p < 0.0001, followed by Dunnett’s multiple comparison test. Data are presented as mean values +/- SEM. Source data
Extended Data Fig. 9
Extended Data Fig. 9. Piezo1 Activation Decreases the CDH5-stained Area and Increases Drainage of Lymphatic Vessel Mimetics in Polydimethylsiloxane (PDMS) Chip.
(a) Schematic illustration of the 3-D lymphatic vessel model used for this study. The outcome of the Yoda1-induced drainage increase is presented in Fig. 4c. (b) Fluorescence confocal images of the engineered lymphatic vessels stained for F-actin and CDH5. Enlarged CDH5 images (boxed) show more discontinuous junctions in the Yoda1-treated group than in the vehicle group. Scale bars: 100 μm (10 μm, enlarged images). Acellular channels are not shown. (c) The relative area of CDH5-stained cellular junctions (n = 8 independent experiments). Statistics: two-tailed t-test. (d) Western blot assays verifying the efficient knock-down of Piezo1 in LECs prepared for the drainage measurement shown in Fig. 4c (n = 4 independent samples). Data are presented as mean values +/- SEM. Source data
Extended Data Fig. 10
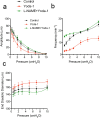
Extended Data Fig. 10. Yoda1 Modifies the Contractile Characteristics of Collecting Lymphatics via an eNOS-Dependent Mechanism.
Axillary collecting lymphatic vessel was surgically excised and exposed to the vehicle, Yoda1 (1 µM), or L-NAME (100 µM) +Yoda1 (1 µM). Lymphatic vessel contractile amplitude (a), frequency (b), and end-diastolic diameter (c) were measured while intraluminal pressure was stepped from 0.5 cmH2O to 10 cmH2O as indicated. The enclosed videos display the changes in the contractile parameters of an excised collecting lymphatic when exposed to the vehicle, Yoda1, and L-NAME+Yoda1 (See Supplementary Videos S1-S6). n = 6 independent samples. Statistics: two-way repeated measure ANOVA, p = 0.2217 (a); p < 0.0001 (b); p = 0.1145 (c) between treatments. Tukey’s multiple comparison test for frequency measures followed, p < 0.0001 between control vs. Yoda1; p = 0.0138 between control vs. L-NAME+Yoda1; p < 0.0001 between Yoda1 vs. L-NAME+Yoda1 (b). Data are presented as mean values +/- SEM. Source data

References

    1. Petrova TV, Koh GY. Organ-specific lymphatic vasculature: from development to pathophysiology. J. Exp. Med. 2018;215:35–49. - PMC - PubMed
    1. Coste B, et al. Piezo1 and Piezo2 are essential components of distinct mechanically activated cation channels. Science. 2010;330:55–60. - PMC - PubMed
    1. Coste B, et al. Piezo proteins are pore-forming subunits of mechanically activated channels. Nature. 2012;483:176–181. - PMC - PubMed
    1. Li J, et al. Piezo1 integration of vascular architecture with physiological force. Nature. 2014;515:279–282. - PMC - PubMed
    1. Ge J, et al. Architecture of the mammalian mechanosensitive Piezo1 channel. Nature. 2015;527:64–69. - PubMed

Publication types