. 2024 May;27(5):862-872.
doi: 10.1038/s41593-024-01611-9. Epub 2024 Mar 25.

Spatial enhancer activation influences inhibitory neuron identity during mouse embryonic development

Affiliations

Spatial enhancer activation influences inhibitory neuron identity during mouse embryonic development

Elena Dvoretskova et al. Nat Neurosci. 2024 May.

Abstract

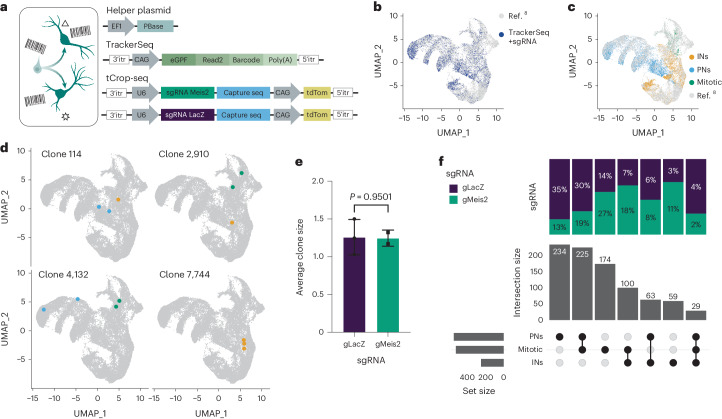
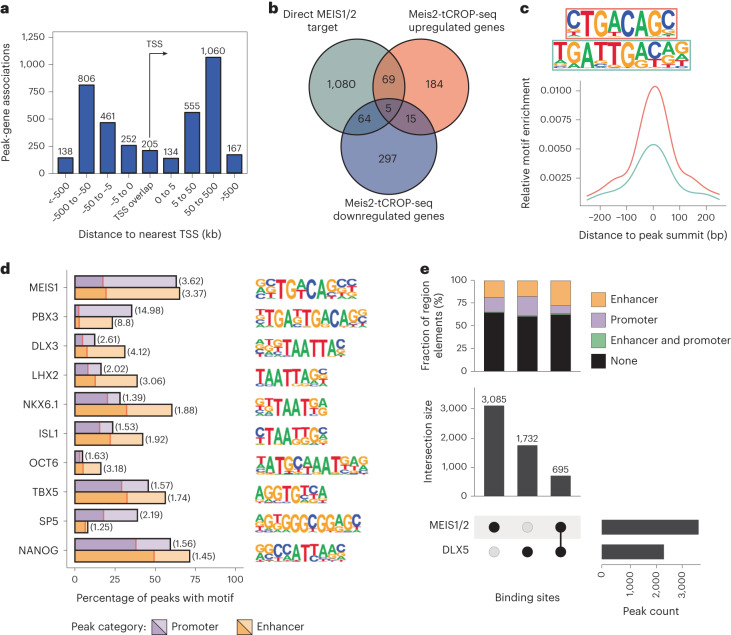
The mammalian telencephalon contains distinct GABAergic projection neuron and interneuron types, originating in the germinal zone of the embryonic basal ganglia. How genetic information in the germinal zone determines cell types is unclear. Here we use a combination of in vivo CRISPR perturbation, lineage tracing and ChIP-sequencing analyses and show that the transcription factor MEIS2 favors the development of projection neurons by binding enhancer regions in projection-neuron-specific genes during mouse embryonic development. MEIS2 requires the presence of the homeodomain transcription factor DLX5 to direct its functional activity toward the appropriate binding sites. In interneuron precursors, the transcription factor LHX6 represses the MEIS2-DLX5-dependent activation of projection-neuron-specific enhancers. Mutations of Meis2 result in decreased activation of regulatory enhancers, affecting GABAergic differentiation. We propose a differential binding model where the binding of transcription factors at cis-regulatory elements determines differential gene expression programs regulating cell fate specification in the mouse ganglionic eminence.


Conflict of interest statement

The authors declare no competing interests.

Figures

Fig. 1
Fig. 1. In vivo tCROP-seq of Meis2 in the mouse forebrain.
a, Logistic regression coefficients of genes being predictive of IN or PN fate. Genes with coefficients >0.5 are predictive of PN fate and genes with coefficients <0.5 are predictive of IN fate. Logistic regression model was trained on equal cell numbers for INs and PNs (n = 8,825). b, Vector maps and schematic of the in vivo tCROP-seq workflow in which mutations are introduced by in utero electroporation of sgRNAs and the effect is determined at a later time point by scRNA-seq. c, UMAP plot of inhibitory cells colored by clusters (n = 34,619 cells). d, Dotplot of the top four marker genes of inhibitory clusters. e, UMAP plot of the integrated dataset colored by sgRNAs. Gray dots represent cells from a published dataset (n = 21,454 cells from ref. ; n = 13,165 cells from this study). f, Top, relative increase or decrease in the cell number in gMeis2 compared to gLacZ control in inhibitory neuron clusters. Plot shows log10((proportion of cells of the given type in gMeis2 perturbed animals)/(proportion of cells of the given type in gLacZ controls)). Bottom, perturbation effects in different clusters compared to gLacZ controls. Dot color corresponds to effect size, dot size corresponds to −log10(P). P values were derived from Poisson regression models. FDR correction was applied to the P values. The black outline indicates statistical significance (P ≤ 0.05). RE, regression analysis; Loc., location of the presumed origin of the cluster within the GE. Box plots show the median (center line), quartiles (box bounds), extend to 1.5 times the interquartile range (whiskers); n is the number of independent experiments (shown on the plot); color depicts clusters. NA, not assigned. g, Plot showing the distribution of DEGs between gMeis2 and gLacZ across various cell types. The height of each bar represents the number of DEGs in a specific cell type and the size of the dots is scaled on the basis of the number of cells in each type. Dot color depicts clusters. h, Volcano plot showing the results of the differential gene expression analysis in PNs at E16 (Methods). The x axis represents log2(fold change), the y axis represents the FDR adjusted −log10(P). The dotted lines show a cutoff (adjusted P ≤ 0.05, log2(fold change) <−0.3 and >0.3). Source data
Fig. 2
Fig. 2. In vivo TrackerSeq lineage tracing and tCROP-seq perturbation of Meis2.
a, Schematic of TrackerSeq lineage tracing, in which clonal boundaries are determined using heritable RNA tags. b, UMAP of the integrated dataset with labeling of cells containing TrackerSeq lineage barcodes (n = 13,165 cells where a gRNA and TrackerSeq lineage barcode could be recovered; n = 21,454 cells from ref. ). c, UMAP of the integrated dataset colored by cell class (mitotic, INs and PNs; n = 34,619 cells). d, Examples of clones which are shared between classes and an example of a clone restricted to one class (n = 34,619 cells per plot). e, Clone sizes for gLacZ and gMeis2. Bars, mean ± s.d. The dots represent the mean number of clones for each gRNA in each independent experiment (n = 3 experiments for gLacZ and n = 2 experiments for gMeis2). Statistical significance was assessed by two-way ANOVA, P = 0.9825. f, UpSet plot showing clonal intersections between groups of clusters. The bar graph on top shows the proportion of clones belonging to gLacZ or gMeis2. The bar graph in the middle shows the number of observed intersections. The bar graph on the left indicates the number of cells per group. Source data
Fig. 3
Fig. 3. DNA-binding sites of MEIS1/2 in the GE at E14.5.
a, Distribution of MEIS1/2 ChIP–seq peaks relative to the nearest TSS. b, Venn diagram showing overlap between MEIS1/2 target genes and genes upregulated or downregulated in inhibitory neurons of gMeis2 tCROP-seq. A cutoff was applied to select DEGs (adjusted P ≤0.05, log2(fold change) <−1.0 and >1.0). Overlap of upregulated and downregulated genes is due to opposite regulation in different subtypes of inhibitory neurons. c, De novo identified MEIS1/2-binding motifs and their position relative to peak summits. d, Motif occurrence of selected known motifs enriched within enhancer- or promoter-overlapping MEIS1/2-binding sites (light bars) compared to G/C-matched reference sequences (dark bars), with fold-enrichment in parentheses. e, Overlap between binding sites of MEIS1/2 and DLX5 (bottom), with respective distribution of binding sites overlapping promoter and/or enhancer regions. Source data
Fig. 4
Fig. 4. Cooperation between MEIS2 and DLX5 activates enhancers of projection-neuron-specific genes.
a, Representative profiles of MEIS1/2 (red) and DLX5 (blue) ChIP–seq at E14.5 and E13.5, respectively, as well as scATAC-seq from LGE (dark gray) and MGE (gray) at E12.5 are shown at the Foxp2 gene locus. DLX5 ChIP–seq data from ref. ; scATAC-seq data from ref. . b, Luciferase activity driven by the enhancer hs1080, cotransfected with Meis2 and Dlx5 expression vectors in Neuro2a cells. c, Luciferase reporter assays of the enhancer hs956. d, Representative profiles of the Drd1 gene enhancer enhD1. e, Luciferase reporter assays of enhD1. f, Luciferase reporter assays of enhD1, cotransfected with Dlx5 and increasing concentration of Meis2 or with Meis2*333. g, Luciferase reporter assays of the wild-type (WT) or mutated (mut.), shorter version of enhD1. h, Representative profiles of the Tshz1 promoter. i, Luciferase reporter assays of the Tshz1 promoter. j, Representative profiles of Aldh1a3 enhancer enhAldh1a3. k, Luciferase reporter assays of enhAldh1a3. In b,c,e,f,g,i and k, bars represent mean ± s.e.m from a total of nine replicates, split into three independent batches, each performed in triplicate. Points represent the mean of each batch for each condition. Statistical significance was assessed by two-way ANOVA. P values of pairwise comparisons from post hoc Tukey’s HSD are presented for selected conditions. Exact P values between specific conditions are shown in Source Data for Fig. 4. Source data
Fig. 5
Fig. 5. Regulation of LGE enhancers by MEIS2, DLX5 and LHX6.
a, Immunohistochemistry of MEIS2 and LHX6 in the MGE of E13.5 embryos. MEIS2 immunoreactivity is high in cells of the ventricular zone (VZ) and low as cells transition to the mantle zone (MZ). Few cells in the SVZ retain MEIS2 expression (white triangle). Conversely, few cells in the VZ are immunoreactive for LHX6 (empty triangles). Some cells at the VZ to SVZ interface are co-immunoreactive against MEIS2 and LHX6 (dotted triangles). Coronal forebrain sections of three wild-type mice were analysed. Scale bars, 20 μm. b, LacZ expression in the LGE of E12.5 embryos, driven by the enhancer hs1041 (ref. ). c, LacZ expression in the LGE of E12.5 embryos, driven by the enhancer hs9566. d,e, Representative tracks of MEIS1/2 ChIP–seq in the GE at E14.5 (red), DLX5 ChIP–seq in the GE at E13.5 (blue), LHX6 ChIP–seq in the GE at E13.5 (purple) and scATAC-seq in LGE (dark gray) and MGE (gray) at E12.5 (ref. ) are shown for the enhancers hs1041 (d) and hs956 (e). f,g, Luciferase activity driven by the enhancers hs1041 (f) and hs956 (g), cotransfected with Meis2, Dlx5 and Lhx6 expression vectors in Neuro2a cells. h, Representative tracks of enhancer enhMeis2. i, Luciferase reporter assays of enhMeis2. j, Model of the proposed actions of MEIS2, DLX5 and LHX6. MEIS2 promotes PN fate in the presence of DLX. LHX6 represses Meis2 expression and function. SVZ, subventricular zone. In fi, bars represent mean ± s.e.m from a total of nine replicates, split into three independent batches, each performed in triplicate. Points represent the mean of each batch for each condition. Statistical significance was assessed by two-way ANOVA. P values of pairwise comparisons from post hoc Tukey’s HSD are presented for selected conditions. For P values between specific conditions, see Source Data for Fig. 5. Source data
Fig. 6
Fig. 6. Embryonic disruption of developmental TFs alters postnatal cell types.
a,b, Schematics of tCROP-seq vector maps (a) and the experimental workflow (b). c, UMAP plot of the P7 data colored by cell type (n = 8,486 cells). d, Dotplot showing the top five marker genes of each cell type. OB, olfactory bulb; prec, precursors; Th, tyrosine hydroxylase expressing cells; OPC, oligodendrocyte progenitor cells; ITC, intercalated cells; MSN, medium spiny neurons; Oligo, oligodendrocyte; Astro, astrocytes. e, Cell-type compositions for each sgRNA. f, Perturbation effects in different clusters compared to gLacZ controls. Dot color corresponds to effect size, dot size corresponds to −log10(P). P values were derived from Poisson regression models. FDR correction was applied to the P values. The black outline indicates statistical significance (adjusted P ≤ 0.05). g, Bar graph showing the number of DEGs detected in inhibitory neurons for each sgRNA. h, Volcano plot showing DEGs in inhibitory neurons for each sgRNA, compared to gLacZ (Methods). The x axis represents log2(fold change), the y axis represents the FDR adjusted −log10(P). The dotted lines depict a cutoff (adjusted P ≤ 0.05, log2(fold change) <−1 and >1). i, Dotplot showing the effect of perturbation by sgRNAs on the module scores of inhibitory modules. The P values were adjusted using Bonferroni correction. A circle denotes statistical significance (−log2(P) > 3). Source data
Extended Data Fig. 1
Extended Data Fig. 1. Targeting of sgRNAs to progenitors in the ganglionic eminence.
a, UMAP depicting groups of cells used for a logistic regression analysis to predict PN and interneuron fate genes (n=29380 cells). Data from Bandler et al. (2022). b, Immunohistochemistry of E18.5 brains electroporated with tCROP-seq LacZ sgRNA vector at E12.5. Subsets of tdTomato expressing neurons show immunoreactivity against markers of different inhibitory neuron types: anti-CTIP2, LGE-derived striatal PNs; anti-SST, MGE-derived cortical INs; anti-PROX1, CGE-derived cortical INs. Coronal forebrain sections of 3 different mice were analysed. Scale bars = 20 μm. c, Localization of tdTomato expression driven by gLacZ and gMeis2 plasmids in the cortex, striatum and GE at E16.5, following IUE at E12.5. Scale bar, 0.1 mm. 3 mice for each condition were analysed. d, UMAP plot displaying the E16 data colored by cell class (Inhibitory: 16098 neurons; Excitatory: 10010 neurons; Radial Glial: 5915 cells; Pericytes: 1008 cells; Fibroblasts: 537 cells; Macrophages: 523 cells; Blood: 390 cells) e-g, Feature plots depicting the expression of the canonical marker genes Nes, Neurod2 and Gad1 (n=34481 cells). h, UMAP plot illustrating the selection of cells for downstream analysis.
Extended Data Fig. 2
Extended Data Fig. 2. gMeis2 modulates gene expression in inhibitory neuron precursor cells.
a, Lollipop plots illustrating the impact of gMeis2 on inhibitory clusters, with the number of DEGs shown after downsampling each group to 314 cells. b, Volcano plot depicting the DEGs in interneurons for gMeis2 compared to gLacZ. c, Volcano plot depicting the DEGs in mitotic cells for gMeis2 compared to gLacZ. d, Volcano plot depicting the DEGs in cells belonging to the projection neuron class for gMeis2 compared to gLacZ. Gene ontology analysis was performed separately on upregulated and downregulated DEGs. Significantly enriched GO terms are shown (adjusted P value ≤0.05). In b,c,d, the dotted lines depict a cutoff (FDR P value ≤0.05, log2(Fold Change) <-0.3 and >0.3). Source data
Extended Data Fig. 3
Extended Data Fig. 3. Combined lineage tracing and CRISPR-Cas9 induced perturbation.
a, Histogram depicting the clone size distribution for gLacZ. b, Histogram depicting the clone size distribution for gMeis2. c, Clonal coupling between cell states. The number of shared barcodes between pairs of cell types was normalized by the expectation when clonal membership is shuffled. Normalized metrics close to 1 indicate that clonal coupling is consistent with random expectation. The observed trend did not pass the statistical threshold of empirical FDR-corrected P values of ≤0.05; see Methods; ns, not significant. d, UpSet plot showing clonal intersections between cell classes. The bar graph on top displays the proportion of clones belonging to gLacZ or gMeis2. The bar graph in the middle shows the number of observed intersections. The bar graph on the left indicates the number of cells per group. Mitotic (mitotic progenitors); PN (projection neuron precursors); IN-CGE (CGE interneuron precursors); IN-MGE (MGE-interneuron precursors); and IN-NA (interneurons from intermediate clusters that we couldn’t assign to either MGE or CGE; Classification into categories was made based on the cluster annotations, see Fig. 1f, Supplementary Table 3). Source data
Extended Data Fig. 4
Extended Data Fig. 4. Overlap of MEIS1/2 and DLX5 ChIP–seq binding sites in the ganglionic eminence.
a, Feature plot depicting the expression level of Meis2 at E16 (n = 34619 cells). b, Feature plot depicting the expression level of Meis1 at E16 (n = 34619 cells). c, Motif occurrence analysis of selected known motifs enriched within all MEIS1/2-binding sites (gray bars) compared to G/C-matched reference sequences (yellow). d, Motif spacing analysis of MEIS2 and DLX5 motifs within shared binding sites. The position weight matrix (PWM) of the most frequent motif configuration is shown on the left, while the right panel illustrates the overall distribution of the DLX5 motif in relation to the MEIS2 motif. e, Overlap analysis of binding sites between MEIS1/2 and DLX5 (bottom) and their distribution within different classes of Vista enhancers (top). f, Overlap analysis of binding sites between MEIS1/2, DLX5 and LHX6. g, Quantification of enhancers with MEIS1/2–DLX5-LHX6 overlapping peaks in respect to VISTA enhancers. 41 were within VISTA enhancers and 28 of these enhancers showed activity in the developing forebrain. h, Visualization of LacZ expression driven by the hs748 enhancer in the E12.5 mouse forebrain Visel et al. (2007). i, Representative tracks of GE ChIP–seq of MEIS1/2 at E14.5 (red), DLX5 at E13.5 (blue) Lindtner et al. (2019), LHX6 at E13.5 (purple) Sandberg et al. (2016) and scATAC-seq Rhodes et al. (2022) from the LGE (dark gray) and MGE (gray) at E12.5. j, Overlap between binding sites of MEIS1/2, DLX5 and LHX6 in enhancer hs748, which associated with the gene Zfp503. j, Luciferase activity driven by hs748, cotransfected with Meis2, Dlx5 and Lhx6 expression vectors in Neuro2a cells. Bars represent mean ± s.e.m from a total of 9 replicates, split into three independent batches, each performed in triplicate. Points represent the mean of each batch for each condition. Statistical significance was assessed by two-way ANOVA. P values of pairwise comparisons from post hoc Tukey’s HSD are presented for selected conditions. For P values between specific conditions, see Source Extended Data for Fig. 4. Source data
Extended Data Fig. 5
Extended Data Fig. 5. Regulation and functional analysis of PN gene enhancers.
a, d, Combined MEIS (red) and DLX (blue) binding motifs found within hs1080 (a) and hs956 (d) enhancers. b, hs1080 and e, hs956 enhancers drive LacZ expression in the E12.5 mouse forebrain Visel et al. (2007). c, f, Luciferase assay measuring the activation effect of MEIS2 and PBX1 on hs1080 (c) or hs956 (f) driven luciferase reporter in Neuro2a cells. g, Feature plot depicting the expression level of Meis2, Dlx5, Foxp2, Drd1, Tshz1 and Aldh1a3 at E16 (n=34619 cells per plot). h, Visualization of the Drd1 locus with aligned tracks of MEIS1/2 ChIP–seq at E14.5 (red), DLX5 ChIP–seq at E13.5 (blue) and LGE (dark gray) Rhodes et al. (2022). The predicted enhancer-gene interactions are also depicted Gorkin et al. (2020). i, Depiction of the DNA sequence of the shortened version of the enhancer enhD1, highlighting the combined MEIS (red) and DLX (blue) binding motifs. The TG bases removed in the mutated version of enhD1 are indicated with a strikeout line. In panels c and f, bars represent mean ± s.e.m from a total of 9 replicates, split into three independent batches, each performed in triplicate. Points represent the mean of each batch for each condition. Statistical significance was assessed by two-way ANOVA. P values of pairwise comparisons from post hoc Tukey’s HSD are presented for selected conditions. For P values between specific conditions, see Source Extended Data for Fig. 5. Source data
Extended Data Fig. 6
Extended Data Fig. 6. MEIS2 acts primarily via distal enhancers in the ganglionic eminence.
a-c, Representative tracks of MEIS1/2 ChIP–seq in the GE at E14.5 (red), DLX5 ChIP–seq in the GE at E13.5 (blue) Lindtner et al. (2019) and scATAC-seq in the LGE (dark gray) and MGE (gray) at E12.5 Rhodes et al. (2022) are shown at the gene promotors of Pbx3, Six3 and Zfp503. d-f, Luciferase activity driven by promoters of Pbx3, Six3 and Zfp503 genes, transfected with MEIS2 and DLX5 expression vectors in Neuro2a cells. g, Overlap between binding sites of MEIS1/2, DLX1, DLX2 and DLX5. h-i, Luciferase activity driven by the enhancer hs956 (j) and hs1080 (k), transfected with MEIS2 (g) and DLX1, DLX2, DLX5 or DLX6 expression vectors in Neuro2a cells. j-k, Luciferase activity driven by enhancers, transfected with MEIS2 (j) or DLX5 (k) expression vectors in Neuro2a cells. The data represents the combined results from multiple experiments. In panels d, e, f, g, h, j and k, bars represent mean ± s.e.m from a total of 9 or 12 replicates, split into 3–4 independent batches, each performed in triplicate. Points represent the mean of each batch for each condition. Statistical significance was assessed by two-way ANOVA. P values of pairwise comparisons from post hoc Tukey’s HSD are presented for selected conditions. For P values between specific conditions, see Source Extended Data for Fig. 6. Source data
Extended Data Fig. 7
Extended Data Fig. 7. Transcription factor expression patterns in the ganglionic eminence.
In situ Hybridization (ISH) images of Dlx5, Meis2, Nkx2-1, Nr2f1, Lhx6 and Tcf4 from the Allen Brain Institute’s Developing Mouse Brain Atlas at E11.5 and E13.5. MGE, medial ganglionic eminence; LGE, lateral ganglionic eminence; CGE, caudal ganglionic eminence.
Extended Data Fig. 8
Extended Data Fig. 8. Spatial activity of select enhancers in the embryonic forebrain.
Selected Vista enhancers with in vivo activity at E11.5 (data: Visel et al. (2007)) and cobinding of MEIS-DLX5-LHX6. On the left side of each image are panels with representative tracks of GE ChIP–seq of MEIS1/2 at E14.5 (red), DLX5 at E13.5 (blue) (data: Lindtner et al. (2019)), LHX6 at E13.5 (purple) (data: Sandberg et al. (2016)) and scATAC-seq from the LGE (dark gray) and MGE (gray) at E12.5 (data: Rhodes et al. (2022)). MGE, medial ganglionic eminence; LGE, lateral ganglionic eminence.
Extended Data Fig. 9
Extended Data Fig. 9. Batch correction and sgRNA coverage of P7 tCROP-seq datasets.
a-b, 2D visualization of the P7 tCROP-seq dataset pre (a) and post (b) batch correction using Harmony. c-d, Feature plots of canonical marker genes Gad2 and Nes at P7 (n = 8486 cells). e, Proportional distribution of cells categorized by dataset and cell type for the P7 tCROP-seq dataset. f, Proportional distribution of cells categorized by dataset and sgRNA for the P7 tCROP-seq dataset. g, Dotplot showing the top marker genes of inhibitory clusters using the “RNA count" data. h, Dotplot illustrating the top marker genes of inhibitory clusters using the‘decontXcounts’ data.
Extended Data Fig. 10
Extended Data Fig. 10. Module analysis of the P7 tCROP-seq dataset.
a, Feature plots of gene module expression scores and the correlated genes within each module. b, Average expression of the top 5 module genes for each sgRNA at P7. c, Schematic summary of spatial factors in the ganglionic eminence leading to specific enhancer activation. MGE, medial ganglionic eminence; CGE, caudal ganglionic eminence; LGE, lateral ganglionic eminence; Ctx, cortex; RA, retinoic acid; SHH, sonic hedgehog; FGF, fibroblast growth factor. 1. Storm et al. (2006); Marklund et al. (2004); 2, Molotkova et al. (2007); Chatzi et al. (2011); 3, Borello et al. (2008); Hunt et al. (2023); 4, Su et al. (2022); 5, Vogt et al. (2014); Asgarian et al. (2022). The red circle outline represents the findings of this study.

References

    1. Bandler RC, Mayer C. Deciphering inhibitory neuron development: the paths to diversity. Curr. Opin. Neurobiol. 2023;79:102691. - PubMed
    1. Leung RF, et al. Genetic regulation of vertebrate forebrain development by homeobox genes. Front. Neurosci. 2022;16:843794. - PMC - PubMed
    1. Zug R. Developmental disorders caused by haploinsufficiency of transcriptional regulators: a perspective based on cell fate determination. Biol. Open. 2022;11:bio058896. - PMC - PubMed
    1. Lindtner S, et al. Genomic resolution of Dlx-orchestrated transcriptional circuits driving development of forebrain GABAergic neurons. Cell Rep. 2019;28:2048–2063. - PMC - PubMed
    1. Su Z, et al. Dlx1/2-dependent expression of Meis2 promotes neuronal fate determination in the mammalian striatum. Development. 2022;149:dev200035. - PMC - PubMed

Publication types

MeSH terms