. 2024 Mar 25;24(1):115.
doi: 10.1186/s12935-024-03301-9.

The upregulation of VGF enhances the progression of oral squamous carcinoma

Affiliations

The upregulation of VGF enhances the progression of oral squamous carcinoma

Chung-Hsien Chou et al. Cancer Cell Int. .

Abstract

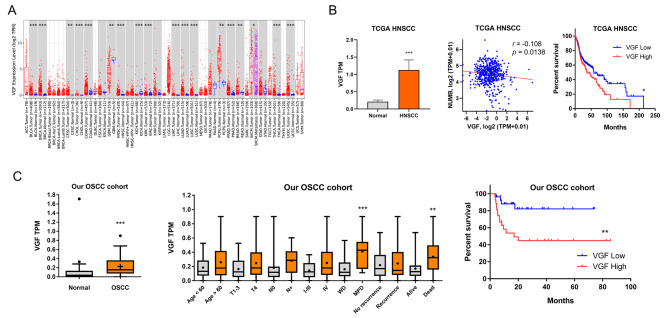
Background: Oral squamous cell carcinoma (OSCC) is a prevalent neoplasm worldwide, necessitating a deeper understanding of its pathogenesis. VGF nerve growth factor inducible (VGF), a neuropeptide, plays critical roles in nerve and endocrine cell regulation.

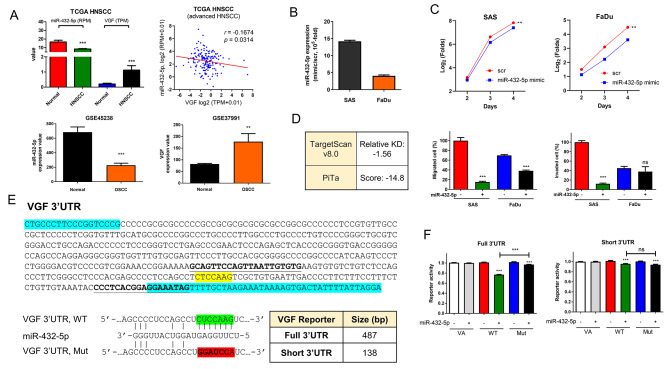
Methods: In this study, the TCGA datasets were initially screened, identifying the upregulation of VGF in various malignancies. We focused on OSCC cell lines, identifying the suppressor mRNA miR-432-5p as a negative regulator of VGF. Additionally, we examined the prognostic value of VGF expression in OSCC tumors and its impact on cellular functions.

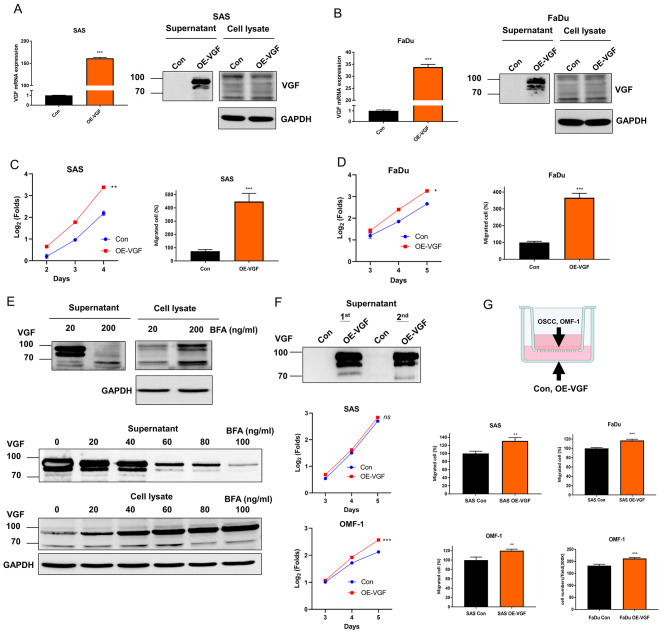
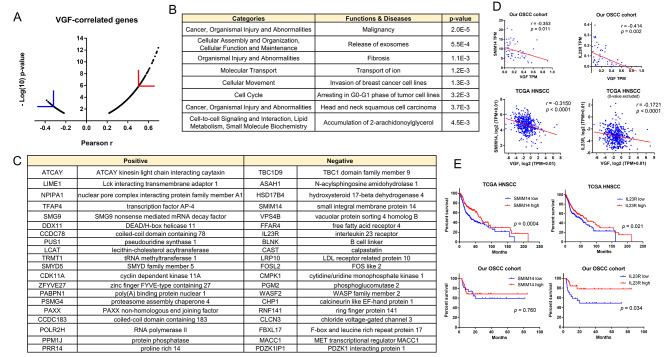
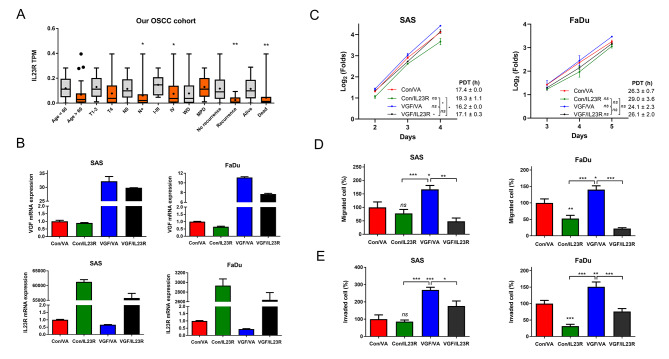
Results: VGF expression was found to be an independent prognostic predictor in OSCC tumors. Cells expressing VGF exhibited increased oncogenicity, influencing the proliferation and migration of oral mucosal fibroblast. Transcriptome analysis revealed associations between VGF and various pathological processes, including malignancies, exosome release, fibrosis, cell cycle disruption, and tumor immune suppression. Moreover, IL23R expression, a favorable OSCC prognostic factor, was inversely correlated with VGF expression. Exogenous IL23R expression was found to suppress VGF-associated mobility phenotypes.

Conclusions: This study highlights the multifaceted role of VGF in OSCC pathogenesis and introduces the miR-432-5p-VGF-IL23R regulatory axis as a critical mediator. The combined expression of VGF and IL23R emerges as a potent predictor of survival in oral carcinoma cases, suggesting potential implications for future therapeutic strategies.

Keywords: IL23R; Oral cancer; Tumor microenvironment; VGF; miR-432-5p.


Conflict of interest statement

The authors declare no competing interests.

Figures

Fig. 1
Fig. 1
Upregulation of VGF in HNSCC and OSCC. (A) Analysis of pan-malignancies in TCGA database using TIMER algorithm. Upregulation of VGF transcript in the vast majority of paired malignancies is noted. (B) TCGA HNSCC data. Lt, upregulation of VGF in tumors. Middle, a reverse correlation lies between VGF expression and NUMB expression. Rt, Kaplan-Meier survival curve illustrating an association between high VGF expression and worse patient survival. (C) Our OSCC cohort data. Lt, upregulation of VGF in tumors. Middle, VGF expression as related to clinicopathologic parameters. Rt, Kaplan-Meier survival curve illustrating an association between high VGF expression and worse patient survival. Medium TPM values of VGF in HNSCC or OSCC tumors are used as a cutoff to designate high or low expression in VGF
Fig. 2
Fig. 2
miR-432-5p suppresses oncogenicity and targets VGF. (A) HNSCC data. Upper Lt, downregulation of miR-432-5p, and upregulation of VGF expression in tumors. Upper Rt, a reverse correlation lies between VGF expression and miR-432-5p expression in the advanced HNSCC patient subset (T3/T4 and node-positive; n = 166). Lower, GEO dataset of Taiwanese OSCC, Lt, downregulation of miR-432-5p in tumors; Rt, upregulation of VGF in tumors. (B, C) The effects of miR-432-5p mimic in OSCC cells. (B) Induction of miR-432-5p expression with the treatment of mimic. (C) Phenotypes in OSCC cells. Upper, growth. A two-way ANOVA test is performed to evaluate the difference in growth in the exponential growth phase between day 2 and day 4. The original growth curves are shown in Fig. S1. Lower Lt, migration; Lower Rt, invasion. (D) Prediction of targeting of miR-432-5p on the 3’UTR of VGF transcript. (E) Upper, VGF 3’UTR sequences. Blue boxes, primer sites to amplify full 3’UTR sequence. Bold fonts/underline, primers to amplify short 3’UTR sequence. Yellow box, predicted targeted site. Lower, Lt, the alignment of miR-432-5p, wild-type and mutant sequences in the reporters. Green box, wild-type targeted sequences. Red box, mutant sequences. Rt, the differences in the size of full 3’UTR reporter and short 3’UTR reporter. (F) Reporter assays. Lt, full 3’UTR reporter. Rt, short 3’UTR reporter
Fig. 3
Fig. 3
Induction of VGF expression in OSCC cells. (A) VGF mRNA expression in cell lines. H1299 serves as a control to denote the relative VGF expression levels in OSCC cells. (B) Western blot analysis of supernatant and cell lysate. (C) Transient exogenous VGF expression. Upper, SAS; Middle OECM1; Lower, FaDu. Lt, VGF mRNA expression following the transfection for 24 h. Rt, Western blot analysis to show the VGF protein in the supernatant and cell lysate following the transfection for 12, 24, or 48 h. Con, vector alone control; VGF, HR’-VGF plasmid. (DG) Induction of endogenous VGF expression using SAM system. (D) Schematic diagram to illustrate 9 predicted sgRNA binding segments in VGF promoter that may allow for SAM-based activation. (E) sgRNA sequences. (F) qPCR analysis. The changes in VGF mRNA expression following SAM induction using solitary sgRNA or combined sgRNAs transfection. The combination of sgRNA 109/133/154/179 yields induction effects simulating the combination of 8 sgRNAs. (G) Lt, qPCR analysis. Rt. Western blot analysis. It shows that the induction of VGF mRNA expression is associated with the increased VGF protein in the supernatant 24 h after induction. Con, vector alone control
Fig. 4
Fig. 4
The generation of OSCC OE-VGF stable cells and phenotypic influences. (A, C) SAS cell. (B, D) FaDu cell. (A, B) Lt, qPCR analysis. Rt, Western blot analysis. (C, D) Lt, growth. A two-way ANOVA test is performed to evaluate the difference in growth in the exponential growth phase between day 2 and day 4 in SAS cells and between day 3 and day 5 in FaDu cells. The original growth curves are shown in Fig. S2. Rt, cell migration assay. Drastic increases in VGF mRNA expression, supernatant VGF protein, growth, and migration are noted in stable cell subclones relative to controls. Con, vector alone control. (EG) The effects of supernatant and co-cultivated OSCC OE-VGF. (E) The VGF localization in SAS OE-VGF cell following BFA treatment for 24 h. Upper, With the treatment of 200 ng/ml, the secretion of VGF is completely inhibited, and the cytosolic retention of VGF is noted. Lower, the gradual decrease of VGF secretion and accumulation of cytosolic VGF notified following the 0–100 ng/ml BFA treatment. (F) Upper, Western blot analysis of the supernatant was collected in two turns during the continuous SAS OE-VGF culture. Middle and Lower, growth. A two-way ANOVA test is performed to evaluate the difference in growth in the exponential growth phase between day 3 and day 5. The original growth curves are shown in Fig. S4. Adding supernatants at day 1 and day 3 to culture barely affects the growth of SAS and significantly accelerates OMF-1 growth. Con, vector alone control. (G) Upper, schematic diagram to illustrate the co-culture system. Middle, co-cultivated SAS OE-VGF increases the migration of OSCC cells compared to the control. Lower, co-cultivated OSCC OE-VGF increases the migration of OMF-1 cells compared to the control
Fig. 5
Fig. 5
VGF co-regulated genes and functions. (A) Dot plot of VGF co-regulated transcripts in our OSCC tumor cohort. X-axis, r value; Y-axis, -Log10(p value). The number of positively correlated transcripts is much more than those negatively correlated. Symbol ∟ separate r > 0.50 or r < -0.33 transcripts from the remaining transcripts. (B) The functions and diseases associated with VGF co-regulated transcripts analyzed with the IPA algorithm. (C) Enlisting of coding transcript highly co-regulated with VGF, as revealed in (A). The detailed parameters are organized in Table S7. (D) The correlation between VGF expression and smim14 expression (Lt panels), and IL23R expression (Rt panels) in our OSCC tumors (Upper panels, analyzed with TPM) and TCGA HNSCC tumors (Lower panels, analyzed with semi-log graph of TPM+0.01). (E) Kaplan-Meier survival analysis. Upper panels, TCGA HNSCC tumors. Lower panels, our OSCC tumors. Medium TPM values of SMIM14 or IL23R in tumor samples are used as cutoffs to designate high or low expression of these genes
Fig. 6
Fig. 6
Clinical and functional implications of IL23R expression. (A) IL23R transcripts as related to clinicopathological parameters in our OSCC tumors. X-axis clinicopathological states. Y-axis, TPM of IL23R. (BE) Exogenous IL23R expression rescues VGF-associated oncogenicity in OSCC cells. (B) qPCR analysis. Duplicate analysis, statistical analysis not performed. (C - E) Phenotypes. (C) Growth. A two-way ANOVA test is performed to evaluate the difference in growth in the exponential growth phase between day 2 and day 4 in SAS cells and between day 3 and day 5 in FaDu cells. The original growth curves are shown in Fig. S6. (D) Migration, (E) Invasion. Lt, SAS cell. Rt, FaDu cell. VGF, VGF expression cell subclones established by the transfection of pBabe-puroVGF plasmid and selection with puromycin. Con, Control cell subclones. IL23R, Transfection of pcDNA3.1(-)IL23R plasmid. VA, vector alone transfection

References

    1. Siegel RL, Miller KD, Jemal A. Cancer statistics, 2020. CA Cancer J Clin. 2020;70(1):7–30. doi: 10.3322/caac.21590. - DOI - PubMed
    1. Chou CH, Chiang CF, Yang CC, Liu YC, Chang SR, Chang KW, Lin SC. Mir-31-NUMB Cascade modulates Monocarboxylate transporters to increase oncogenicity and lactate production of oral carcinoma cells. Int J Mol Sci 2021, 22(21). - PMC - PubMed
    1. Chou CH, Tu HF, Kao SY, Chiang CF, Liu CJ, Chang KW, Lin SC. Targeting of miR-31/96/182 to the numb gene during head and neck oncogenesis. Head Neck. 2018;40(4):808–17. doi: 10.1002/hed.25063. - DOI - PubMed
    1. Lin SC, Wu HL, Yeh LY, Yang CC, Kao SY, Chang KW. Activation of the miR-371/372/373 miRNA Cluster Enhances Oncogenicity and Drug Resistance in Oral Carcinoma Cells. Int J Mol Sci 2020, 21(24). - PMC - PubMed
    1. Liu CJ, Tsai MM, Hung PS, Kao SY, Liu TY, Wu KJ, Chiou SH, Lin SC, Chang KW. miR-31 ablates expression of the HIF regulatory factor FIH to activate the HIF pathway in head and neck carcinoma. Cancer Res. 2010;70(4):1635–44. doi: 10.1158/0008-5472.CAN-09-2291. - DOI - PubMed