. 2024 May;11(20):e2306059.
doi: 10.1002/advs.202306059. Epub 2024 Mar 25.

The Dual Role of the NFATc2/galectin-9 Axis in Modulating Tumor-Initiating Cell Phenotypes and Immune Suppression in Lung Adenocarcinoma

Affiliations

The Dual Role of the NFATc2/galectin-9 Axis in Modulating Tumor-Initiating Cell Phenotypes and Immune Suppression in Lung Adenocarcinoma

Zhi-Jie Xiao et al. Adv Sci (Weinh). 2024 May.

Abstract

Tumor-initiating cells (TICs) resilience and an immunosuppressive microenvironment are aggressive oncogenic phenotypes that contribute to unsatisfactory long-term outcomes in lung adenocarcinoma (LUAD) patients. The molecular mechanisms mediating the interaction between TICs and immune tolerance have not been elucidated. The role of Galectin-9 in oncogenesis and immunosuppressive microenvironment is still unknown. This study explored the potential role of galectin-9 in TIC regulation and immune modulation in LUAD. The results show that galectin-9 supports TIC properties in LUAD. Co-culture of patient-derived organoids and matched peripheral blood mononuclear cells showed that tumor-secreted galectin-9 suppressed T cell cytotoxicity and induced regulatory T cells (Tregs). Clinically, galectin-9 is upregulated in human LUAD. High expression of galectin-9 predicted poor recurrence-free survival and correlated with high levels of Treg infiltration. LGALS9, the gene encoding galectin-9, is found to be transcriptionally regulated by the nuclear factor of activated T cells 2 (NFATc2), a previously reported TIC regulator, via in silico prediction and luciferase reporter assays. Overall, the results suggest that the NFATc2/galectin-9 axis plays a dual role in TIC regulation and immune suppression.

Keywords: NFATc2; galectin‐9; immune; lung adenocarcinoma; tumor‐initiating cells.


Conflict of interest statement

The authors disclose no potential conflicts of interest.

Figures
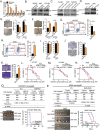
Figure 1
Figure 1
Galectin‐9 supported the TIC phenotypes of lung adenocarcinoma. A) Expression of LGALS9 in tumor spheres and monolayers determined by qPCR. B) Expression of galectin‐9 in tumor spheres and monolayers determined by western blot. C) Expression of galectin‐9 and NFATc2 in the ALDH+/CD44+ and ALDH/CD44 subsets determined by western blot analysis. D) Expression of galectin‐9 in HCC827 and A549 cells with or without galectin‐9 knockout or overexpression determined by western blot. E,F) Sphere formation assay in HCC827 and A549 cells with galectin‐9 manipulation. G,H) ALDH/CD44 expression was analyzed by flow cytometry in HCC827 and A549 cells with galectin‐9 knockout or overexpression. I) BrdU proliferation assay of HCC827 and A549 cells after galectin‐9 manipulation. J,K) Migration assay of HCC827 and A549 cells with galectin‐9 manipulation. L,M) Effects of galectin‐9 knockout on cisplatin (L) and gefitinib (M) sensitivity in HCC827 cells determined by MTT assay. N) Effect of galectin‐9 overexpression on the cisplatin sensitivity of A549 cells, as determined by MTT assay. O,P) In vivo limiting dilution assay in which decreasing numbers of HCC827 (O) or A549 cells (P) were injected via a galectin‐9 mixture into SCID mice; n = 6 for each group. The tumor incidence, latency, and estimated TIC frequency calculated by L‐cal software are shown in the table (upper panel). Representative tumor images of the in vivo limiting dilution assay (lower left panel) and the effect of galectin‐9 manipulation on the tumor‐free survival of HCC827 or A549 xenografts analyzed by the log‐rank test are shown (lower right panel). * p < 0.05, ** p < 0.01 versus the control according to Student's t‐test. The data are presented as the means±SDs of three replicates.
Figure 2
Figure 2
Galectin‐9 supported TIC phenotypes in LUAD organoids. A) Representative bright field images of paired normal and tumor organoids cultured from patient‐derived tissues. B) Representative H&E and IHC staining of ALK in tumor organoids and the corresponding primary tissue. Scale bar: 40 µM. C) Expression of galectin‐9 in normal lung organoids and LUAD organoids determined by western blot analysis. D) Expression of galectin‐9 in LUAD organoids with or without galectin‐9 knockout determined by western blot analysis. E–F) The ALDH/CD44 TIC fraction of tumor organoid Case #2 (E) and Case #3 (F) after galectin‐9 manipulation was analyzed by flow cytometry. G,H) An in vitro limiting dilution assay was performed. Tumor organoids from Case #1 (G) and Case #2 (H), with or without galectin‐9 KO, were digested into single cells. A total of 250, 50, and 5 cells per well were seeded into 32, 64, and 96 wells of 96‐well plates, respectively. The cells were cultured in TIC medium and allowed to form tumor spheres for 3 weeks. The number of wells with tumorspheres was counted for each cell dose. Limiting dilution analyses were performed using Extreme Limiting Dilution Analysis software. (http://bioinf.wehi.edu.au/software/elda) I–J) Cell viability assay of Crizotinib sensitivity in Case #2 (I) and cisplatin sensitivity in Case #3 (J) with or without galectin‐9 knockout using CellTiter‐Glo reagents. * < 0.5, ** p < 0.01 versus the control according to Student's t‐test. The data are presented as the means±SDs of three replicates.
Figure 3
Figure 3
Secretary galectin‐9 from tumor organoids suppressed T cell proliferation A) Peripheral blood and lung cancer and normal lung tissues were collected from LUAD patients. PBMCs were isolated from peripheral blood and cryopreserved until the corresponding organoids were established. Coculture experiments of autologous PBMCs with normal lung organoids or LUAD organoids were performed. B) PBMCs stimulated with CD3/CD28 and stained with CFSE were cocultured with tumor or normal lung organoids from Case #2 and Case #3 at a ratio of 10:1 for 72 h. The proportions of proliferating T cells under experimental or control conditions were assessed using flow cytometry. Gray curve, unstained cells; gray area, CSFC‐stained PBMCs without CD3/CD28 stimulation; red curve, CFSE‐stained PBMCs stimulated with CD3/CD28. C) PBMCs were stained with CFSE, stimulated with CD3/CD28, and cocultured with or without organoid case #2 in the presence or absence of a transwell insert. T‐cell proliferation was detected by flow cytometry, and the red curve indicates the proportion of proliferating cells. D) Correlation between protein expression levels of galectin‐9 and the secreted levels of galectin‐9 in a panel of lung cancer cell lines. E) Effect of conditioned medium from Case#2 and Case#3 with or without galectin‐9 manipulation on T cell proliferation. F) Effect of conditioned medium from A549 cells with or without galectin‐9 overexpression or treatment with an anti‐galectin‐9 antibody on T cell proliferation. ** p < 0.01, compared with the control by one‐way ANOVA. The data are presented as the means±SDs of three replicates. ns, not significant.
Figure 4
Figure 4
Tumor‐secreted galectin‐9 suppressed T‐cell cytotoxicity by increasing the Treg proportion and inducing apoptosis in CD8+ T cells. A–C) Effects of conditioned medium collected from organoid case #2 (A), A549 cells (B), and H1975 cells (C) with or without galectin‐9 manipulation on the CD3+/CD4+/FOXP3+ fraction of PBMCs analyzed by flow cytometry. D–F) Effects of conditioned medium collected from H1975 (D), organoid case #2 (E), and A549 (F) cells with or without galectin‐9 manipulation on the CD3+/CD8+/ IFNγ+ fractions of PBMCs analyzed by flow cytometry. G,H) Apoptosis of CD8+ T cells treated with conditioned medium from organoid case#2 (G) and A549 cells (H) with or without galectin‐9 manipulation assessed by flow cytometry using annexin V and 7‐AAD staining. * < 0.05, ** p < 0.01, compared with the control by one‐way ANOVA. The data are presented as the means±SDs of three replicates.
Figure 5
Figure 5
Tumor galectin‐9 increased the Treg proportion and suppressed cytotoxic T cells in vivo. A) Expression of galectin‐9 in LLC1 cells with or without Lgals9 knockdown. B–D) A total of 5 × 105 LLC1 cells were subcutaneously inoculated into the flanks of C57BL mice, and the tumor volumes were monitored; n = 5 per group. Representative tumor images (B), tumor growth curves (C), and tumor volumes (D) are shown. *** p < 0.001, compared with the respective control by two‐way ANOVA and corrected by Tukey's test. The error bars indicate the means ± SDs of the tumor volumes. E–G) At the endpoint of the experiment, xenografts were harvested and digested with collagenase to obtain single‐cell suspensions. Flow cytometry analysis of the infiltration of CD3+ T cells, CD3+/CD8+ T cells, and CD3+/CD4+/FOXP3+ Treg cells was performed. Proportions of infiltrated CD3+ T cells (E), CD3+/CD4/CD8+ T cells (F), and CD3+/CD4+/FOXP3+ Treg cells (G) in xenografts with or without Lgals9 knockdown are shown. H) The fractions of CD8+ T cell subtypes of single‐cell suspensions derived from LLC1 xenografts with or without Lgals9 knockdown were analyzed by flow cytometry. Proportions of infiltrated CD3+/CD4/CD8+/CD62L+/CD44+ T cells, CD3+/CD4/CD8+/CD62L/CD44+, CD3+/CD4/CD8+/TIM3+, CD3+/CD4/CD8+/PD‐1+, and CD3+/CD4/CD8+/PD‐1+ /TIM3+ in xenografts are shown. I,J) Effects of conditioned medium collected from HCC827 (I) and A549 cells (J) with or without galectin‐9 manipulation on the CD3+/CD8+/TIM3+, CD3+/CD8+/PD‐1+, and CD3+/CD8+/PD‐1+ /TIM3+ fractions of CD3/CD28 stimulated PBMCs analyzed by flow cytometry. K) Effects of recombinant galectin‐9 (rhGal9) treatment on the CD3+/CD8+/TIM3+, CD3+/CD8+/PD‐1+, and CD3+/CD8+/PD‐1+ /TIM3+ fractions of CD3/CD28 stimulated PBMCs analyzed by flow cytometry. * < 0.05, ** < 0.01, *** < 0.001, compared with the control analyzed by one‐way ANOVA and corrected by Tukey's test. The data are presented as the mean±SD. L,M) Effects of anti‐galectin‐9 antibody on tumor growth of LLC1 xenograft model. 5 × 105 of LLC1 cells were subcutaneously inoculated into the flanks of C57BL mice. Mice bearing subcutaneous xenografts were randomly separated into two groups and treated with anti‐galectin‐9 antibody or IgG as control (150 µg/mouse, twice/week by intraperitoneal injection). Graph of tumor growth curve (L), tumor weight, and tumor image (M) were shown. * p < 0.05: by two‐way ANOVA. ** p < 0. 01: by t test. The error bar indicates the mean ± SD of tumor volumes or tumor weight of five mice.
Figure 6
Figure 6
Galectin‐9 expression in tumor cells was positively correlated with Treg infiltration. A) mRNA level of LGALS9 in paired normal/tumor lung cancer tissues from the HKU cohort. ** p < 0.01 by paired t‐test. B) Serum galectin‐9 level from 93 LUAD patients and 19 healthy donors. *** p < 0.001 by un‐paired t‐test. C) Representative immunohistochemistry image of galectin‐9 showing low‐grade (left) and high‐grade (right) expression in lung adenocarcinoma. D) Kaplan–Meier survival curves according to log‐rank tests of 264 resected primary LUAD samples stratified by galectin‐9 expression levels for progression‐free survival (PFS). E) Representative multiplex image (left) and the corresponding cell phenotype map of the LUAD core with high tumor galectin‐9 expression. F) Representative multiplex image (left) and the corresponding cell phenotype map of the LUAD core with low tumor galectin‐9 expression. G) Galectin‐9 intensity in different types of cells in LUAD tissue. *** < 0.001 compared to tumor cells analyzed by one‐way ANOVA and corrected by Tukey's test. H) Correlation between tumor galectin‐9 intensity and the total number of Treg cells analyzed by the Pearson correlation test. I) Correlations between tumor galectin‐9 intensity and the total number of CD8+ T cells were analyzed via Pearson correlation analysis. J) Correlation between tumor galectin‐9 intensity and the number of total CD4+ T cells analyzed by Pearson correlation analysis. K) Correlation between tumor galectin‐9 intensity and the number of tumor‐infiltrated Treg cells analyzed by the Pearson correlation test. L) Correlation of LGALS9 and NFATc2 mRNA levels determined by qPCR in the TCGA lung cancer dataset analyzed by Pearson correlation analysis.
Figure 7
Figure 7
NFATc2 supported TIC phenotypes and mediated immune suppression through galectin‐9. A,B) LGALS9 mRNA expression in NFATc2‐knockdown (A) or NFATc2‐overexpressing (B) lung cancer cells determined via qPCR. C,D). (C) Protein levels of galectin‐9 and NFATc2 in NFATc2‐knockdown (C) or NFATc2‐overexpressing lung cancer cells determined by western blot (D). E) Correlation of LGALS9 and NFATc2 mRNA expression levels determined by qPCR in a local human LUAD cohort analyzed by Pearson correlation analysis. F) Computational prediction of NFAT binding sites (marked in red) in the LGALS9 regulatory region. TSS: transcription start site (upper). Luciferase activity of the LGALS9 reporters in 293T cells was determined by dual‐luciferase reporter assay. G,H) Luciferase activity of LGALS9 reporters with NFATc2‐WT or NFATc2‐MUT binding sites in H1299 cells (G) and A549 cells (H) with or without NFATc2 overexpression determined by dual luciferase reporter assay. I) Expression of galectin‐9 and NFATc2 in A549 cells with or without NFATc2 and galectin‐9 manipulation determined via western blotting. J) Sphere formation assay was performed in A549 cells with or without NFATc2/galectin‐9 manipulation. K) Cell viability assay of cisplatin performed on A549 cells with NFATc2/galectin‐9 manipulation. L) Effect of conditioned medium from HCC827 and A549 cells with or without NFATc2/galectin‐9 manipulation on T cell proliferation, as determined by flow cytometry. (M) Effect of conditioned medium from HCC827 cells and A549 cells with or without NFATc2/galectin‐9 manipulation on the CD3+/CD4+/FOXP3+ Treg cell proportion, as determined by flow cytometry. * p < 0.05; ** p < 0.01 compared with the control. ## p < 0.01 compared with cells with only NFATc2 manipulation by one‐way ANOVA corrected by Tukey test. The data are presented as the means±SDs of three replicates.

References

    1. Sung H., Ferlay J., Siegel R. L., Laversanne M., Soerjomataram I., Jemal A., Bray F., CA Cancer J. Clin. 2021, 71, 209. - PubMed
    1. Li Y., Laterra J., Cancer Res. 2012, 72, 576. - PMC - PubMed
    1. Kreso A., Dick J. E., Cell Stem Cell 2014, 14, 275. - PubMed
    1. Clarke M. F., N. Engl. J. Med. 2019, 380, 2237. - PubMed
    1. Garon E. B., Rizvi N. A., Hui R., Leighl N., Balmanoukian A. S., Eder J. P., Patnaik A., Aggarwal C., Gubens M., Horn L., Carcereny E., Ahn M.‐J., Felip E., Lee J.‐S., Hellmann M. D., Hamid O., Goldman J. W., Soria J.‐C., Dolled‐Filhart M., Rutledge R. Z., Zhang J., Lunceford J. K., Rangwala R., Lubiniecki G. M., Roach C., Emancipator K., Gandhi L., N. Engl. J. Med. 2015, 372, 2018. - PubMed

MeSH terms