. 2024 Mar 11:15:1355862.
doi: 10.3389/fneur.2024.1355862. eCollection 2024.

Epilepsy-related functional brain network alterations are already present at an early age in the GAERS rat model of genetic absence epilepsy

Affiliations

Epilepsy-related functional brain network alterations are already present at an early age in the GAERS rat model of genetic absence epilepsy

Lydia Wachsmuth et al. Front Neurol. .

Abstract

Introduction: Genetic Absence Epilepsy Rats from Strasbourg (GAERS) represent a model of genetic generalized epilepsy. The present longitudinal study in GAERS and age-matched non-epileptic controls (NEC) aimed to characterize the epileptic brain network using two functional measures, resting state-functional magnetic resonance imaging (rs-fMRI) and manganese-enhanced MRI (MEMRI) combined with morphometry, and to investigate potential brain network alterations, following long-term seizure activity.

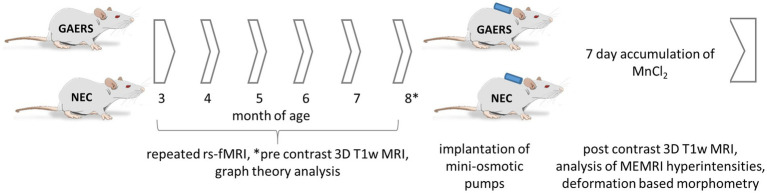
Methods: Repeated rs-fMRI measurements at 9.4 T between 3 and 8 months of age were combined with MEMRI at the final time point of the study. We used graph theory analysis to infer community structure and global and local network parameters from rs-fMRI data and compared them to brain region-wise manganese accumulation patterns and deformation-based morphometry (DBM).

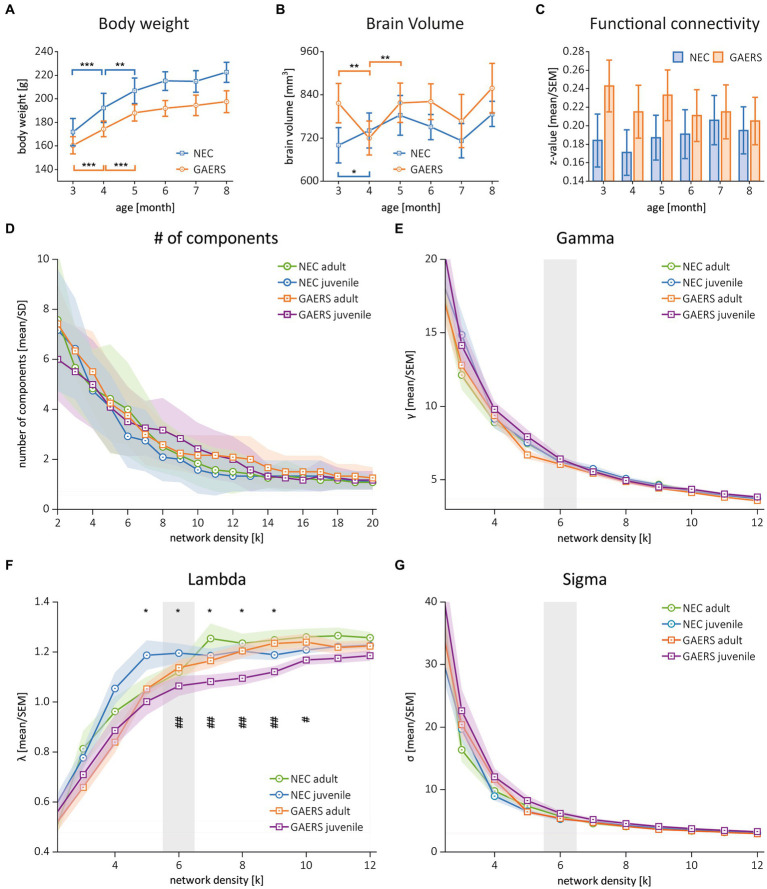
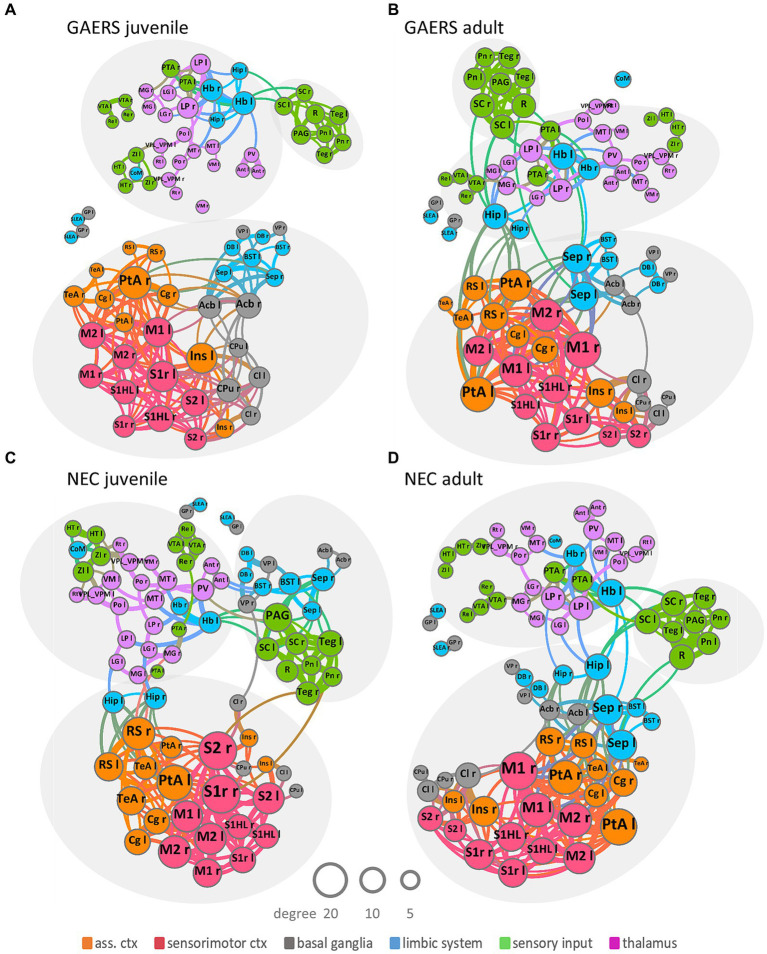
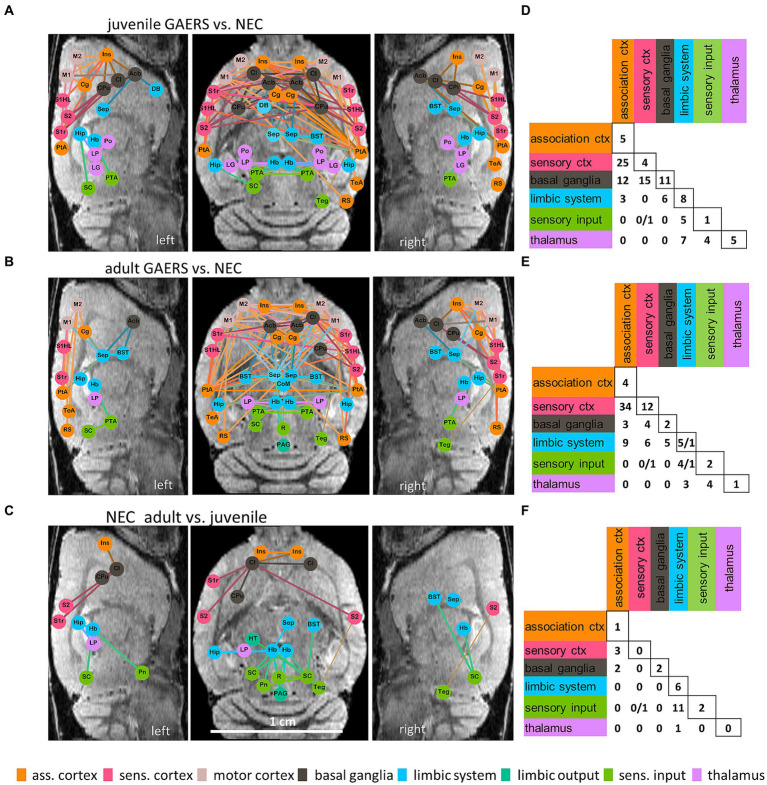
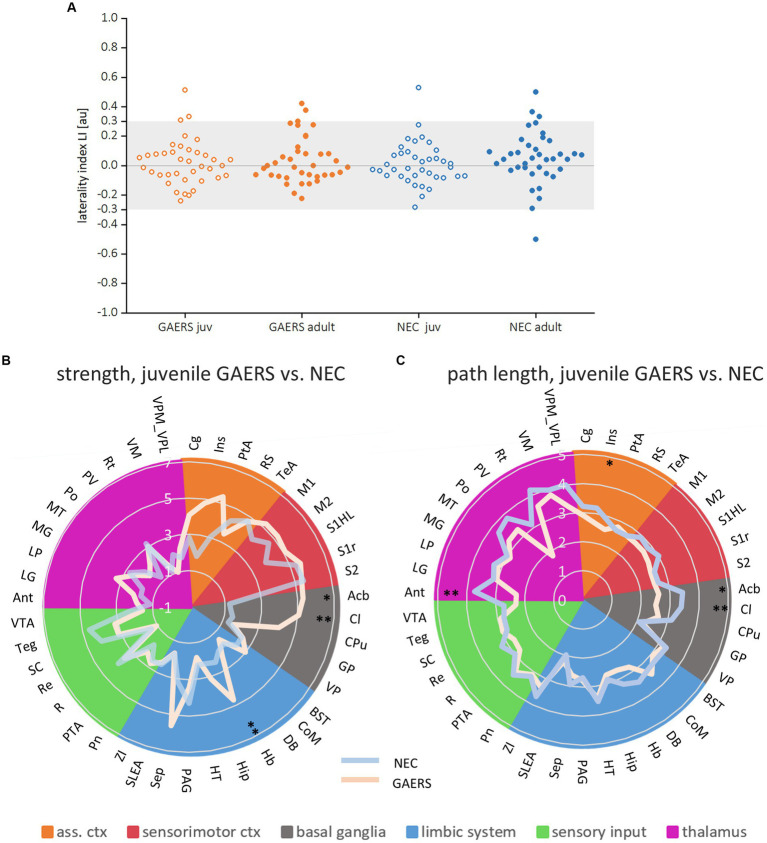
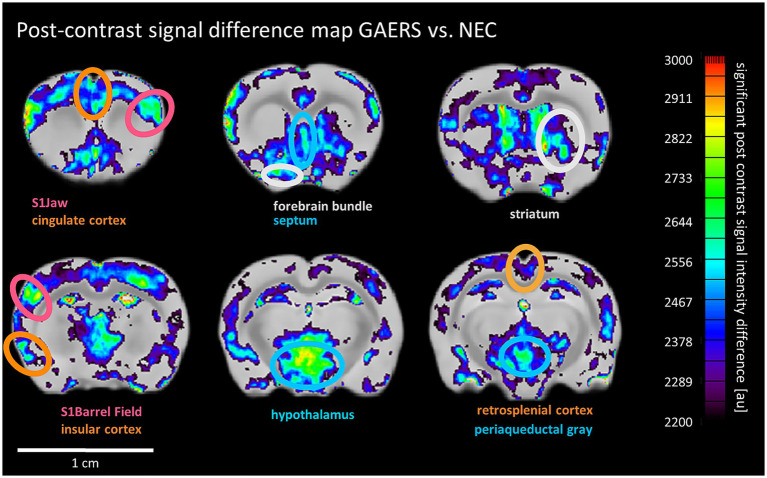
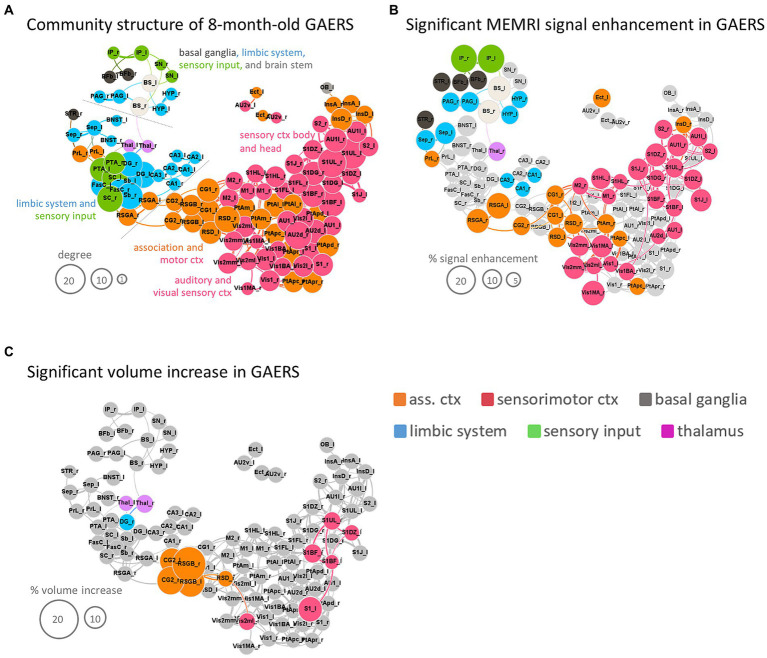
Results: Functional connectivity (FC) was generally higher in GAERS when compared to NEC. Global network parameters and community structure were similar in NEC and GAERS, suggesting efficiently functioning networks in both strains. No progressive FC changes were observed in epileptic animals. Network-based statistics (NBS) revealed stronger FC within the cortical community, including regions of association and sensorimotor cortex, and with basal ganglia and limbic regions in GAERS, irrespective of age. Higher manganese accumulation in GAERS than in NEC was observed at 8 months of age, consistent with higher overall rs-FC, particularly in sensorimotor cortex and association cortex regions. Functional measures showed less similarity in subcortical regions. Whole brain volumes of 8 months-old GAERS were higher when compared to age-matched NEC, and DBM revealed increased volumes of several association and sensorimotor cortex regions and of the thalamus.

Discussion: rs-fMRI, MEMRI, and volumetric data collectively suggest the significance of cortical networks in GAERS, which correlates with an increased fronto-central connectivity in childhood absence epilepsy (CAE). Our findings also verify involvement of basal ganglia and limbic regions. Epilepsy-related network alterations are already present in juvenile animals. Consequently, this early condition seems to play a greater role in dynamic brain function than chronic absence seizures.

Keywords: GAERS; MEMRI; absence epilepsy; deformation-based morphometry; functional connectivity; graph theory; rs-fMRI; spike–wave-discharges.


Conflict of interest statement

The authors declare that the research was conducted in the absence of any commercial or financial relationships that could be construed as a potential conflict of interest.

Figures

Figure 1
Figure 1
Study design. 12 GAERS and NEC, each, were subjected to repeated rs-fMRI examinations at 3, 4, 5, 6, 7, and 8 months of age under low dose isoflurane anesthesia. Graph theory analysis was applied to analyze longitudinal rs-fMRI data. At 8 months of age mini-osmotic pumps prefilled with MnCl2x4H2O were implanted. Before and after 7 days of continuous manganese application, high-resolution 3D T1w-MRI were acquired. Manganese accumulation was assessed by brain region-wise analysis of signal intensities in T1-weighted images. Regional volume differences between GAERS and NEC were retrieved from data registration.
Figure 2
Figure 2
Global parameters. (A) Body weights of GAERS (blue) and NEC (orange) significantly increased between 3 and 5 months of age, followed by a plateau from 6 months and onwards. (B) Label mask volumes from rs-fMRI analysis with MagnAn were taken as rough estimate for brain volumes. Asterisks indicate significant differences between time points (rm ANOVA followed by posthoc Student’s t-test, *p < 0.05, **p < 0.01. and ***p < 0.001). (C) Mean correlation coefficients (z-transformed) of GAERS and NEC over time. Variance analysis with rm ANOVA revealed significant higher FC in GAERS when compared to NEC, but no effect of age (Table 1). (D) Number of components and (E–G) the global parameters clustering coefficient (gamma), shortest path length (lambda), and small world index (sigma) of juvenile and adult GAERS and NEC, respectively, plotted vs. network density k. Please note that x-axis in E–G only show network density up to k = 12. Asterisks (F) indicate significant differences of global parameter lambda between juvenile strains (*p < 0.05, unpaired Student’s t-test). Hash keys indicate significant differences between juvenile and adult GAERS (#p < 0.05 and ##p < 0.01, paired Student’s t-test). Grey bars highlight density threshold of k = 6, which was used for subsequent analyses. All graphs show mean and standard error of the mean (SEM).
Figure 3
Figure 3
Network topology. Group-averaged force-based network plots of juvenile and adult GAERS (A,B) and NEC (C,D), respectively, at a network density of k = 6. Nodes represent brain regions and edges connections between them. Arrangement and closeness of nodes takes correlation strength between brain regions into account. Brain networks subdivided into three major communities, indicated by light grey ellipses, irrespective of strain and age: one cortical community, comprising association cortex (orange) and sensorimotor cortex (red) mingling with basal ganglia (grey) and some limbic regions (blue); one sensory input community (green) colocalized with limbic region periaqueductal grey (blue) and one subcortical community comprising thalamic (pink), sensory input (green) and limbic regions (blue). Node and label size scale with degree and edge thickness represents the correlation strength between connected brain regions. Nodes are color-coded according to affiliation with functional group. Abbreviations of brain regions can be found in Supplementary Table S1.
Figure 4
Figure 4
Network based statistics. NBS at k = 6 revealed significant differences between brain networks of GAERS and NEC in both, the juvenile (A,D) and the adult (B,E) groups, and between juvenile and adult NEC (C,F). Graphical layouts (A–C) are overlaid, in approximate anatomical position, on one representative left and right sagittal and one axial MR image (scale bar in grey). Only nodes with significantly altered connections are shown. Colors encode affiliation with the functional group. The colors of the edges are a combination of the colors of the connected nodes. Statistically stronger connections in GAERS compared to NEC (A,B) and in adult compared to juvenile NEC (C) are represented by thick lines, thin lines represent statistically weaker connections for the respective comparison. Matrices (D–F) summarize the numbers of significantly different connections between brain regions per functional group (please note, sensory cortex and motor cortex as well as limbic system and limbic output were combined) when comparing GAERS with NEC (D,E) and adult with juvenile NEC (F). If two numbers are shown in one cell, the first represents the number of stronger, the second the number of weaker connections for the respective comparison. Group permutations: 1,000, alpha: p < 0.05.
Figure 5
Figure 5
Local parameters. (A) Laterality indices of the local parameter degree for both juvenile and adult GAERS and NEC do not indicate hemispheric dominance. Dots represent brain regions, light grey areas indicate the laterality index (LI) threshold set at 0.3. Radar plots display strength (B) and path length (C) of juvenile GAERS (light blue) and NEC (light orange) averaged across hemispheres. Asterisks indicate significant differences between strains (Posthoc Mann Whitney U *p < 0.05 and **p < 0.01). List of abbreviations of brain regions can be found in Supplementary Table S1. Summary of results of non-parametric variance analysis are reported in Table 2.
Figure 6
Figure 6
MEMRI post-contrast signal difference maps. Pixels with significantly higher post contrast signal intensity in GAERS than NEC are shown and overlaid onto the mean difference image. Ellipses highlight selected areas with significant vs. NEC’s signal enhancement. Color scale uses arbitrary units for signal intensity difference. Color of labels and ellipses indicate functional group affiliation.
Figure 7
Figure 7
Synopsis. (A) Force-based network plot of community structure for GAERS based on analysis of 8 m rs-fMRI data with the RatSigma template at k = 6. (B) Same network plot as in (A), but only highlighting regions with significant MEMRI hyperintensity. (C) Same network plot as in (A), but only highlighting regions with significant volume increase. Node sizes scale with degree (A), % signal enhancement (B) or % volume increase (C), respectively. Colors indicate functional group affiliation (orange = association cortex, red = sensorimotor cortex, grey = basal ganglia, blue = limbic system, green = sensory input, pink = thalamus). Brain region abbreviations are listed in Supplementary Table S1.

Similar articles

References

    1. Centeno M, Carmichael DW. Network connectivity in epilepsy: resting state fMRI and EEG-fMRI contributions. Front Neurol. (2014) 5:e93. doi: 10.3389/fneur.2014.00093 - DOI - PMC - PubMed
    1. Falsaperla R, Vitaliti G, Marino SD, Praticò AD, Mailo J, Spatuzza M, et al. . Graph theory in paediatric epilepsy: a systematic review. Dialogues Clin Neurosci. (2021) 23:3–13. doi: 10.1080/19585969.2022.2043128, PMID: - DOI - PMC - PubMed
    1. Bernhardt BC, Bonilha L, Gross DW. Network analysis for a network disorder: the emerging role of graph theory in the study of epilepsy. Epilepsy Behav. (2015) 50:162–70. doi: 10.1016/j.yebeh.2015.06.005, PMID: - DOI - PubMed
    1. Bernhardt BC, Chen Z, He Y, Evans AC, Bernasconi N. Graph-theoretical analysis reveals disrupted small-world organization of cortical thickness correlation networks in temporal lobe epilepsy. Cereb Cortex. (2011) 21:2147–57. doi: 10.1093/cercor/bhq291, PMID: - DOI - PubMed
    1. Dingledine R, Varvel NH, Dudek FE. When and how do seizures kill neurons, and is cell death relevant to epileptogenesis? Adv Exp Med Biol. (2014) 813:109–22. doi: 10.1007/978-94-017-8914-1_9, PMID: - DOI - PMC - PubMed