

Distribution of case volumes in surgery: an analysis of the British Spine Registry
- PMID: 38529085
- PMCID: PMC10961580
- DOI: 10.1136/bmjsit-2023-000202
Distribution of case volumes in surgery: an analysis of the British Spine Registry
Abstract
Objectives: To characterize the distribution of case volumes within a surgical field.
Design: An analysis of British Spine Registry.
Setting: 295 centers in England that conducted at least one spinal operation either within the NHS or private settings between 1 May 2016 and 27 February 2021.
Participants: 644 surgeons.
Main outcome measures: Mathematical descriptions of distributions of cases among surgeons and the extent of workforce-level case-volume concentration as a surrogate marker.
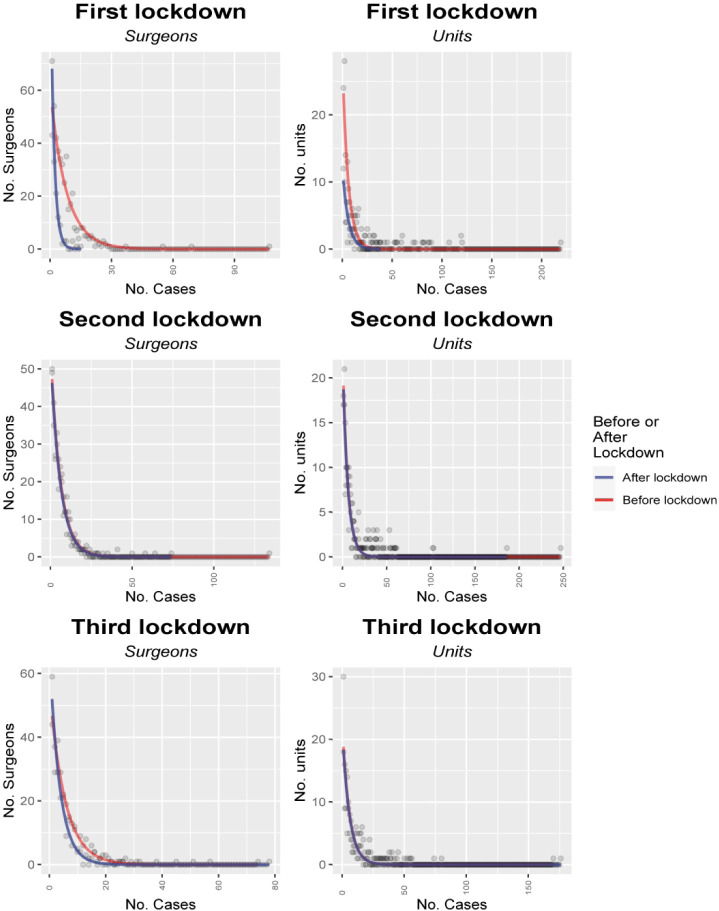
Results: There were wide variations in monthly caseloads between surgeons, ranging from 0 to average monthly high of 81.8 cases. The curves showed that 37.7% of surgeons were required to perform 80% of all spinal operations, which is substantially less than in fields outside of healthcare.With the COVID-19 pandemic, the case volumes of surgeons with the highest volumes dropped dramatically, whereas those with the lowest case numbers remained nearly unchanged. This, along with the relatively low level of case-volume concentration within spinal surgery, may indicate an inevitability of at least some level of surgical care being provided by the relatively lower volume surgeons.
Conclusions: While there is a reasonable degree of workforce-level case volume concentration within spinal surgery, with high volume spinal surgeons providing a large proportion of care, it is not clear whether a further concentration of case volumes into those few hands is possible or desirable.
Keywords: Health Care Quality, Access, and Evaluation; Health Policy; Health Services Research; Learning Curve.
© Author(s) (or their employer(s)) 2024. Re-use permitted under CC BY-NC. No commercial re-use. See rights and permissions. Published by BMJ.
Conflict of interest statement
Competing interests: None declared.
Figures


References
-
- Hardy M. Pareto’s law. Math Intelligencer 2010;32:38–43. 10.1007/s00283-010-9159-2 - DOI
-
- Nicholls PT. Price’s square root law: empirical validity and relation to Lotka’s law. Inf Process Manage 1988;24:469–77. 10.1016/0306-4573(88)90049-0 - DOI
-
- Nicholls PT. Empirical validation of Lotka’s law. Inf Process Manage 1986;22:417–9. 10.1016/0306-4573(86)90076-2 - DOI
-
- Pao ML. An empirical examination of Lotka's law. J Am Soc Inf Sci 1986;37:26–33. 10.1002/asi.4630370105 - DOI
-
- Newman MEJ. Power laws, Pareto distributions and Zipf's law. Contemporary Physics 2005;46:323–51. 10.1080/00107510500052444 - DOI
Grants and funding
LinkOut - more resources
Full Text Sources