. 2024 Mar 21:17:1085-1100.
doi: 10.2147/IJGM.S454546. eCollection 2024.

Mapping the Spatial Evolution of Proximal Femur Osteoporosis: A Retrospective Cross-Sectional Study Based on CT Scans

Affiliations

Mapping the Spatial Evolution of Proximal Femur Osteoporosis: A Retrospective Cross-Sectional Study Based on CT Scans

Robert B Bot et al. Int J Gen Med. .

Abstract

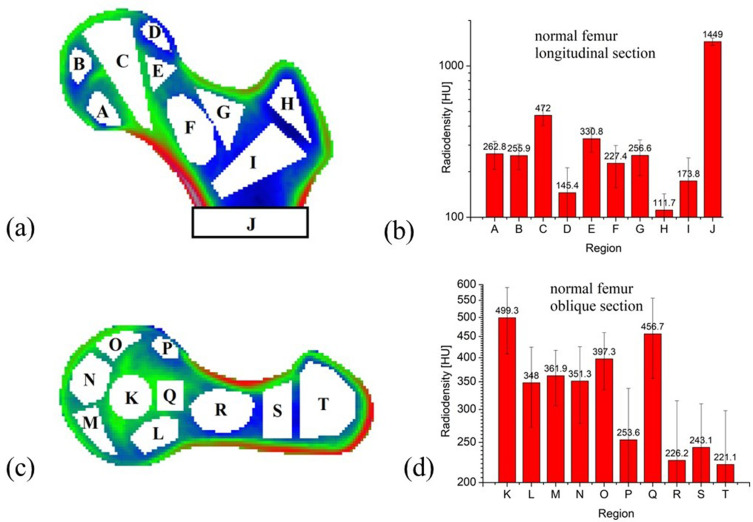
Purpose: The purpose of this study was to quantify the modifications occurring in osteoporosis at the level of the human proximal femur throughout the trabecular structure, along with the identification of certain anatomic regions preferentially affected by osteoporosis. Another goal was to map the evolution of the radiodensity of the trabecular bone as osteoporosis progresses to an advanced stage.

Methods: The study included CT scans (right femur) from 51 patients, out of which 40 had various degrees of osteoporosis, but no other local pathology. Ten regions of interest in two orthogonal slices have been identified and the differences in radiodensity as well as their evolution have been statistically analyzed in terms of relative and absolute changes.

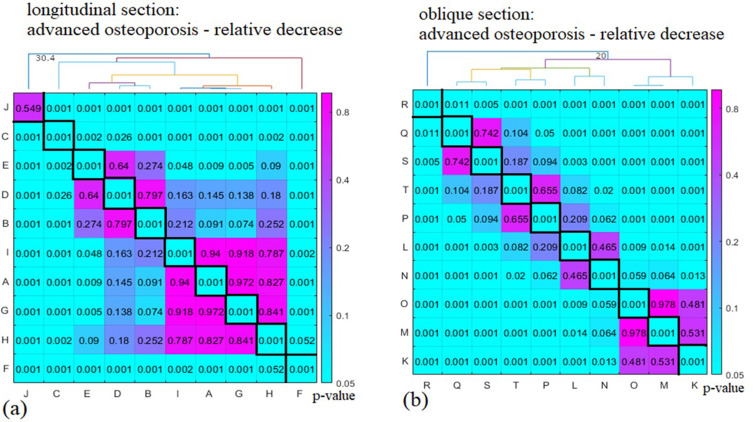
Results: A detailed spatial map showing the evolution of osteoporosis was obtained. As osteoporosis evolved, the relative decrease in radiodensity was inversely correlated to the radiodensity of the healthy bone. In particular, the region covering the Ward triangle decreased the most, by an average 61-62% in osteopenia and 101-106% in advanced osteoporosis, while the principal compressive group was affected the least, showing a decrease by an average 14-15% in osteopenia and 29-32% in advanced osteoporosis. The absolute decrease in radiodensity was not correlated to the radiodensity of the healthy bone and was shifted to the inferior-posterior edge of the femur. Inside the femoral head, the upper region was affected the most in absolute terms, while the greater trochanter was less affected than the femoral neck. The maximum metaphyseal cortical bone density was unaffected by the progression of osteoporosis.

Conclusion: Significant differences were noticed in terms of the absolute and relative osteoporotic changes in radiodensity related to different anatomical regions of the human femoral bone. These differences become more pronounced as the disease progresses.

Keywords: CT; femur; osteoporosis; radiodensity.


Conflict of interest statement

The authors declare no conflicts of interest in this work.

Figures

Figure 1
Figure 1
Warping process example for longitudinal (a) and the corresponding oblique slices (b), using a healthy femur as reference and warping a femur with advanced osteoporosis (original image). Gray levels and spatial scales of various images have been auto-scaled for best viewing and are not comparable. The oblique sections in (b) correspond to the oblique center line running through the femoral head and neck in (a), perpendicular to its plane.
Figure 2
Figure 2
Average femur CT cross section for healthy patients (a and d), patients diagnosed with osteopenia (b and e) and patients with advanced osteoporosis (c and f). The color scales represent HU.
Figure 3
Figure 3
Average spatial distribution of osteopenia (a and c) and advanced osteoporosis (b and d), displayed as the relative decrease in radiodensity.
Figure 4
Figure 4
Average spatial distribution of osteopenia (a and c) and advanced osteoporosis (b and d), displayed as absolute decrease in radiodensity, measured in HU.
Figure 5
Figure 5
Analyzed anatomical regions, shown as white areas superimposed onto the average healthy femur (a and c). The histograms show the average normal bone radiodensity and corresponding standard deviations for the analyzed regions (b and d). The features of trabecular bone were investigated in the regions A-I and K-T, while the cortical bone in region J.
Figure 6
Figure 6
Relative decrease in radiodensity of femurs with moderate and advanced osteoporosis, in the longitudinal (a) and oblique (b) sections.
Figure 7
Figure 7
p-values heat map (log scale) of the spatial distribution of osteopenia, measured by the relative decrease in radiodensity in the various anatomical regions, in the longitudinal (a) and oblique (b) sections. The dendrograms compare the means of the spatial distribution of osteopenia in the various regions.
Figure 8
Figure 8
p-values heat map (log scale) of the spatial distribution of advanced osteoporosis, measured by the relative decrease in radiodensity in the various anatomical regions in the longitudinal (a) and oblique (b) sections. The dendrograms compare the means of the spatial distribution of advanced osteoporosis in the various regions.
Figure 9
Figure 9
Absolute decrease of radiodensity in femurs with osteopenia respectively advanced osteoporosis, in the longitudinal (a) and oblique (b) sections.
Figure 10
Figure 10
p-values heat map (log scale) for the spatial distribution of osteopenia as measured by the absolute decrease in radiodensity for the various anatomical regions, in the longitudinal (a) and oblique (b) sections. The dendrograms compare the means of the spatial distribution of osteopenia in the various regions.
Figure 11
Figure 11
p-values heat map (log scale) for the spatial distribution of advanced osteoporosis as measured by the absolute decrease in radiodensity for the various anatomical regions, in the longitudinal (a) and oblique (b) sections. The dendrograms compare the means of the spatial distribution of advanced osteoporosis in the various regions.
Figure 12
Figure 12
Correlation between normal femur radiodensity and relative decrease radiodensity in osteoporotic femurs, in the longitudinal (a) and oblique (b) sections. The various regions are indicated with capital letters. The red lines represent the best linear fit for all 10 regions while the blue lines in panel (a) consider only the 9 trabecular regions.

References

    1. Waddell JP. Fractures of the Proximal Femur: Improving Outcomes: Expert Consult: Online and Print. 1st ed. Philadelphia, PA: Saunders; 2010.
    1. Moreland BL, Legha JK, Thomas KE, Burns ER. Hip fracture-related emergency department visits, hospitalizations and deaths by mechanism of injury among adults aged 65 and older, United States 2019. J Aging Health. 2023;35:345–355. doi:10.1177/08982643221132450 - DOI - PMC - PubMed
    1. Greenspan SL, Myers ER, Maitland LA, Resnick NM, Hayes WC. Fall severity and bone mineral density as risk factors for Hip fracture in ambulatory elderly. JAMA. 1994;271:128–133. doi:10.1001/jama.1994.03510260060029 - DOI - PubMed
    1. Lewis SR, Macey R, Stokes J, Cook JA, Eardley WG, Griffin XL. Surgical interventions for treating intracapsular Hip fractures in older adults: a network meta‐analysis. Cochrane Database Syst Rev. 2022;2022:CD013404. doi:10.1002/14651858.CD013404.pub2 - DOI - PMC - PubMed
    1. Beck A, Rüter A. Schenkelhalsfrakturen-Diagnostik und therapeutisches Vorgehen. Unfallchirurg. 1998;101:634–648. doi:10.1007/s001130050317 - DOI - PubMed