[Preprint]. 2024 Feb 29:2024.02.26.582147.
doi: 10.1101/2024.02.26.582147.

An injury-induced tissue niche shaped by mesenchymal plasticity coordinates the regenerative and disease response in the lung

Affiliations

An injury-induced tissue niche shaped by mesenchymal plasticity coordinates the regenerative and disease response in the lung

Dakota L Jones et al. bioRxiv. .

Abstract

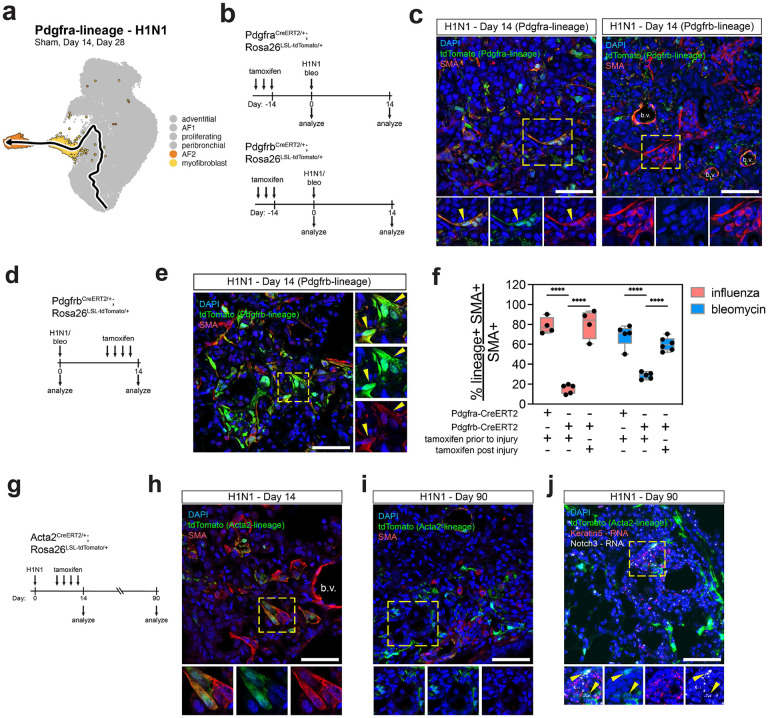
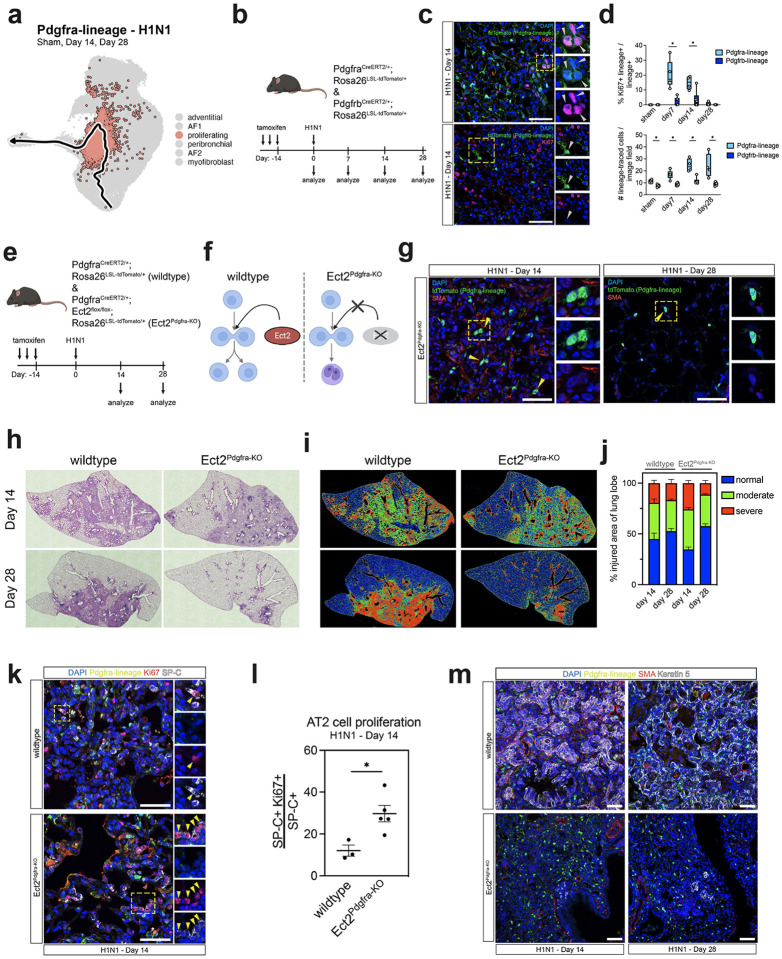
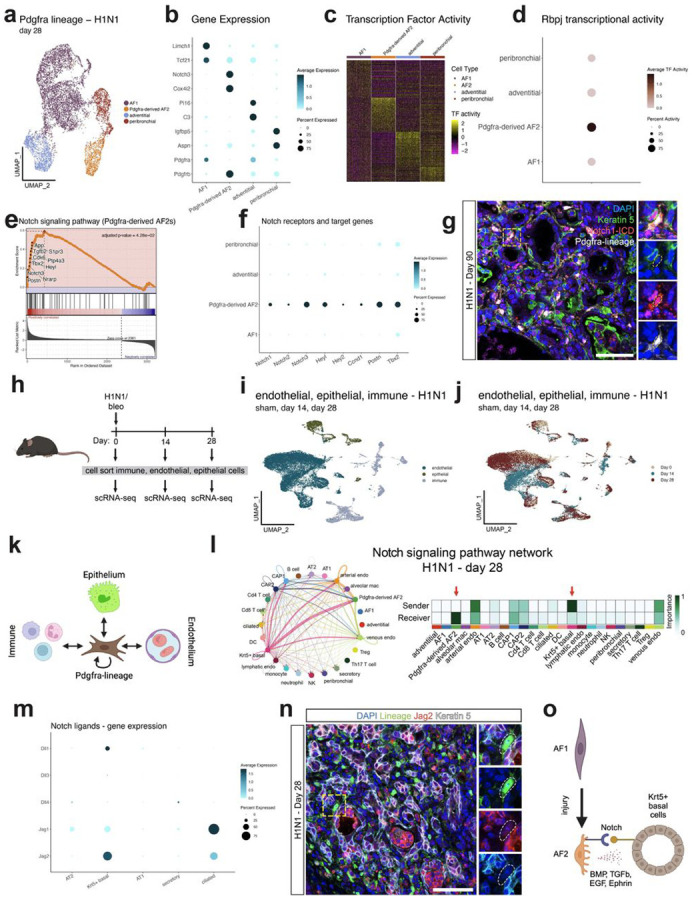
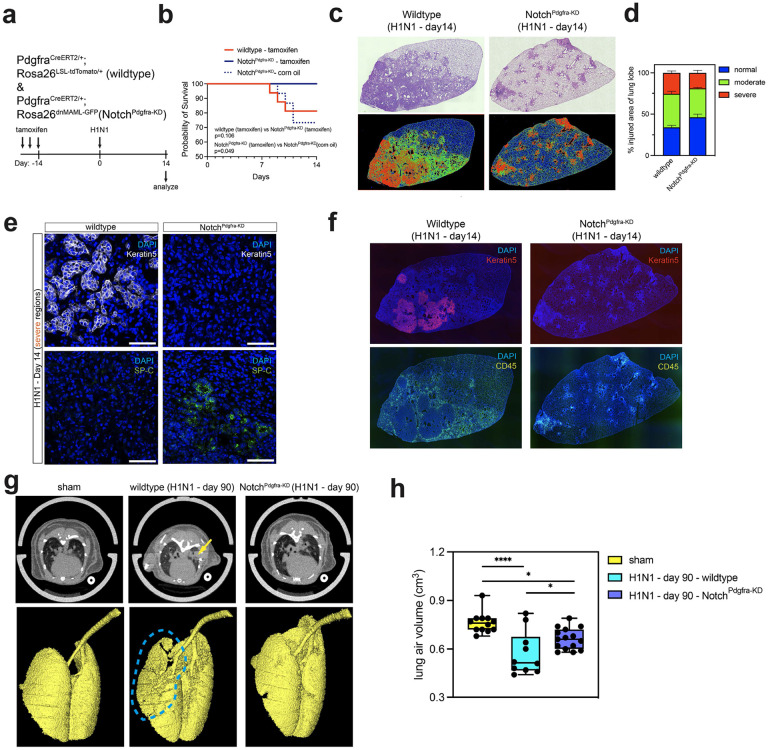
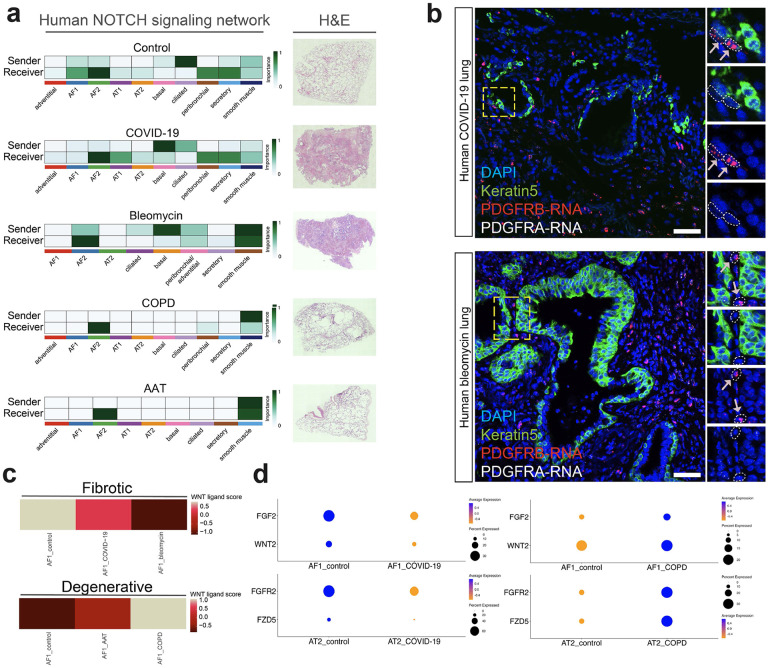
Severe lung injury causes basal stem cells to migrate and outcompete alveolar stem cells resulting in dysplastic repair and a loss of gas exchange function. This "stem cell collision" is part of a multistep process that is now revealed to generate an injury-induced tissue niche (iTCH) containing Keratin 5+ epithelial cells and plastic Pdgfra+ mesenchymal cells. Temporal and spatial single cell analysis reveals that iTCHs are governed by mesenchymal proliferation and Notch signaling, which suppresses Wnt and Fgf signaling in iTCHs. Conversely, loss of Notch in iTCHs rewires alveolar signaling patterns to promote euplastic regeneration and gas exchange. The signaling patterns of iTCHs can differentially phenotype fibrotic from degenerative human lung diseases, through apposing flows of FGF and WNT signaling. These data reveal the emergence of an injury and disease associated iTCH in the lung and the ability of using iTCH specific signaling patterns to discriminate human lung disease phenotypes.


Conflict of interest statement

Declaration of interests The authors declare no competing interests.

Figures

Figure 1:
Figure 1:. Reactivity and plasticity of the pulmonary Pdgfra+ mesenchymal cells in the lung.
(a) experimental schematic of the approach to dissect Pdgfra+ and Pdgfrb+ cell heterogeneity in the adult mouse lung at homeostasis. (b) UMAP representation of the scRNA-seq data of the Pdgfra and Pdgfrb-lineage mesenchymal cells. (c) IHC and RNA in situ hybridization to visualize spatial location of AF1 and AF2 cells. (d) experimental schematic of the approach to dissect overlap of Pdgfra+ and Pdgfrb+ cells in the mouse adult lung. (e) flow-cytometry showing overlap and separation of Pdgfra+ (eGFP+) and Pdgfrb+ (tdTomato+) cells in the adult mouse lung. (f) IHC confirmation of flow-cytometry using Pdgfra and Pdgfrb as unique markers of AF1s and AF2s respectively. (g) schematic approach to study Pdgfra+ and Pdgfrb+ lineage mesenchymal cells after respiratory influenza and separately bleomycin-induced lung injuries. (h) UMAP representation of the scRNA-seq data of the Pdgfra and Pdgfrb-lineage mesenchymal cells after influenza infection. Data represents integrated libraries (sham, day 14, and day 28) for each lineage. (i) UMAPs and FeaturePlots showing division of Pdgfra and Pdgfrb-lineage mesenchymal cells at each timepoint, and the expression of Pdgfra and Pdgfrb of these cells over time. (j) IHC and RNA in situ hybridization for Pdgfra-derived AF2 cells (tdTomato+ Pdgfrb+ Notch3+) showing that these cells are embedded in iTCHs. (k) Slingshot trajectory analysis showing trajectory of AF1 cells differentiating into AF2 cells. (l) Dynamic gene expression through pseudotime of genes enriched in each cell state within the trajectory. (m) Correlation plot showing Spearman correlation coefficients of Pdgfra-derived AF2 cells compared to endogenous AF1 and AF2 cells. (n) Spearman correlation plot and calculation of R correlation coefficient and p-value revealing the high degree of similarity between wildtype AF2 and Pdgfra-derived AF2 cells. (o) summary schematic generated using Biorender.com
Figure 2:
Figure 2:. Source and fate of Acta2 expressing cells in the lung during injury and regeneration.
(a) UMAP of scRNA-seq from Pdgfra-lineage cells after influenza (sham, day 14, and day 28) highlighting myofibroblasts and AF2 cells along the predicted trajectory of AF1 cells differentiating into AF2 cells. (b) Experimental schematic depicting approach to dissect whether Pdgfra+ or Pdgfrb+ cells are the primary producers of myofibroblasts in the lung. (c) IHC of the lineage reporter (tdTomato) and alpha smooth muscle actin (SMA) at 14 days after influenza infection showing that Pdgfra+ cells are the major producer of SMA+ myofibroblasts in the lung, relative to Pdgfrb+ cells. (d) Experimental schematic depicting approach to test whether lineage labeling Pdgfrb+ cells during injury labels SMA+ myofibroblasts. Mice were given daily tamoxifen from days 10-13 and collected for analysis at day 14. (e) IHC of the lineage reporter (tdTomato) and SMA at 14 days after influenza infection showing that labeling actively expressing Pdgfrb+ cells during injury captures the Pdgfra-derived SMA cells on their way to become AF2 cells. (f) Box plots showing quantification of the percentage of lineage-labeled SMA+ cells out of the total SMA+ cells after both influenza infection and separately bleomycin. (g) Experimental schematic depicting approach to capture and trace the Acta2 expressing cells during injury and after resolution. (h) IHC of the lineage reporter (tdTomato) and SMA showing that administration of tamoxifen after influenza infection labels the actively expressing Acta2+ myofibroblasts. (i) IHC showing previously labeled SMA cells extinguish SMA expression and reside in iTCHs. (j) IHC and RNA in situ hybridization showing that at later timepoints after influenza infection, labeled Acta2+ cells express the AF2 marker Notch3 and are embedded in iTCHs directly adjacent to the dysplastic Krt5-expressing epithelium. All scale bars represent 50 um. Each data point in (f) represents data obtained from an individual mouse (i.e. biological replicate). ****P<0.0001, evaluated by one-way ANOVA with Tukey’s adjustment for multiple comparisons.
Figure 3:
Figure 3:. Selective inhibition of mesenchymal cell cytokinesis inhibits iTCH formation and promotes euplastic alveolar repair.
(a) UMAP of scRNA-seq from Pdgfra-lineage cells after influenza (sham, day 14, and day 28) highlighting proliferating cells along the predicted trajectory of AF1 cells differentiating into AF2 cells. (b) Experimental schematic depicting approach to evaluate and quantifiy proliferation of Pdgfra+ and Pdgfrb+ mesenchymal cells over time after influenza infection. (c) IHC of the lineage-reporter (tdTomato) and Ki67 showing Pdgfra+ cell pool proliferates and expands after injury while Pdgfrb+ cells do not proliferate. (d) Box plots showing quantification of percentage of tdTomato+ Ki67+ cells out of the total tdTomato+ cells for both Pdgfra and Pdgfrb-lineage over time after influenza infection and also total number of lineage-traced cells per image field. (e) Experimental schematic depicting approach to evaluate the function of Pdgfra+ cell pool expansion after influenza injury via deletion of Ect2. (f) Cartoon schematic depicting function of Ect2 and the effect of deletion made with Biorender.com. (g) IHC showing bi-nucleated Pdgfra-lineaged trace cells after Ect2 deletion following influenza infection at days 14 and 28. (h) representative H&E sections of the left lobes after Ect2 deletion following influenza infection. (i) injury-severity algorithm showing regions of normal (blue), moderately damaged (green), and severely damaged (red) lung tissue after injury. (j) quantification of injury severities as a percentage of total lung area. (k) IHC of the Pdgfra-lineage reporter (tdTomato), SP-C, and Ki67 showing increased AT2 cells proliferation after Ect2 deletion in Pdgfra+ cells. (l) quantification of AT2 cell proliferation from IHC images. (m) IHC of Pdgfra-lineage (tdTomato), SMA, and Keratin5 showing absence of Krt5+ cells in the alveolar space after Ect2 deletion in Pdgfra+ cells. All scale bars represent 50 um. Each data point in panels d and l represents data obtained from a single mouse (i.e. biological replicate). n = 4-6 mice/group in panel j. All error bars represent SEM. *P<0.05, evaluated by un-paired t-test.
Figure 4:
Figure 4:. Pdgfra-derived AF2 cells are embedded within iTCHs and are enriched for Notch signaling.
(a) UMAP of scRNA-seq data from Pdgfra-lineage cells at 28 days after influenza infection. (b) DotPlot showing unique gene experession markers of each cluster shown in panel (a). (c) Heatmap depicting the top 25 active transcription factors unique to each cell cluster. (d) DotPlot showing activity of Rbpj, the main transcription factor downstream of Notch signaling, in each cell cluster shown in panel (a) demonstrating that Pdgfra-derived AF2 cells have the highest Rbpj activity relative to other cell types. (e) GSEA analysis showing Pdgfra-derived AF2 cells are enriched for downstream target genes of Notch signaling. (f) DotPlot showing expression level of Notch receptors and downstream target genes in cell clusters shown in panel (a). (g) IHC at 90 days after influenza infection showing Notch+ Pdgfra-lineage cells are embeded within iTCHs directly adjacent to the dysplastic Krt5+ epithelium. (h) Experimental schematic depicting approach to temporally profile immune, endothelial, and epithelial cells using scRNA-seq after influenza infection and separately bleomycin. (i) UMAP representation of the scRNA-seq data showing endothelial, epithelial, and immune cells. (j) UMAP representation of the scRNA-seq data showing aggregation of cells by time point (sham, day 14, and day 28). (k) Cartoon schematic showing approach to examine which cell types are communicating with Pdgfra-lineage cells after injury made with Biorender.com. (l) Notch signaling network at 28 days after influenza infection showing a unique niche between the Krt5+ dysplastic basal cells, the primary sender of the Notch signals, and Pdgfra-derived AF2 cells, the primary receiver of Notch signals. (m) DotPlot showing expression of Notch ligands across the distinct epithelial cell types at day 28 after influenza infection showing Krt5+ basal cells express high levels of Dll1 and Jag2. (n) IHC showing Jag2+ Krt5+ dysplastic epithelial cells exist directly adjacent to the Pdgfra-lineage mesenchymal cells at day 28 after influenza infection. (o) Cartoon summary schematic made with Biorender.com. All scale bars represent 50 um.
Figure 5:
Figure 5:. Inhibition of mesenchymal Notch signaling blunts dysplastic alveolar remodeling.
(a) Experimental schematic showing approach to understand the function of intracellular Notch signaling in Pdgfra+ cells. (b) Survival curve of wildtype and NotchPdgfra-KD mice after influenza infection. P-values calculated from Log-rank (Mantel-Cox) tests. (c) H&E and injury severity zones of the left lobes from wildtype and NotchPdgfra-KD mice after influenza infection. (d) quantification of injury severity zones from wildtype and NotchPdgfra-KD mice. (e) IHC showing that wildtype mice iTCHs contain Krt5+ dysplastic epithelium and no SP-C+ AT2 cells, but in NotchPdgfra-KD mice iTCHs do not contain Krt5+ epithelium with an increase in SP-C+ AT2 cells. (f) whole lobe IHC analysis showing remain iTCHs in NotchPdgfra-KD mice exhibit dense CD45+ immune cell infiltration. (g) uCT scans of sham, wildtype (day 90 after influenza infection), and NotchPdgfra-KD (day 90 after influenza infection) showing a reduction in gross lung scar tissue formation in NotchPdgfra-KD compared to wildtype mice at 90 days after influenza infection. (h) Box plot of uCT analysis showing a rescue in total lung air volume in NotchPdgfra-KD (day 90 after influenza infection) relative to wildtype (day 90 after influenza infection). All scale bars represent 50 um. All error bars represent SEM. Each data point in (h) represents data obtained from an individual mouse (i.e. biological replicate). n = 5-6 mice/group in panel d. ****P<0.0001, *P<0.05, evaluated by one-way ANOVA with Tukey’s correction for multiple comparisons.
Figure 6:
Figure 6:. Mesenchymal Notch signaling rewires the alveolar signaling niche
(a) Experimental schematic showing approach to identify the mechanism by which inhibiting intracellular mesenchymal Notch signaling rescues euplastic alveolar regeneration. (b) UMAP of scRNA-seq data from wildtype and NotchPdgfra-KD Pdgfra-lineage cells at 14 days after influenza infection. (c) UMAP highlighting spatial location of cells from each condition (wildtype and NotchPdgfra-KD). (d) UMAP of mesenchymal cells showing three distinct clusters of AF1 mesenchymal cells. (e) Contribution of each condition (wildtype and NotchPdgfra-KD) to the cell clusters shown in panel (d) showing AF1b is enriched for wildtype AF1 cells and AF1c is enriched for NotchPdgfra-KD AF1 cells. (f) KEGG pathway analysis of the gene expression programs enriched in AF1b and AF1c clusters and violin plots of relevant genes from the highlighted pathways. (g) UMAP of epithelial cells. (h) Contribution of each condition (wildtype and NotchPdgfra-KD) to each cell cluster shown in panel (g) showing strong reduction in Krt5+ basal cells after Notch inactivation in the Pdgfra+ cells. (i) Incoming/outgoing signaling strength of all identified celltypes from panel (b) in both conditions (wildtype and NotchPdgfra-KD) showing an increase in the incoming signaling from AT2 cells and an increase in outgoing signaling in AF1 cells in NotchPdgfra-KD mice compared to wildtype mice. (j) Differential pathway information flow for FGF and WNT signaling showing an overall system wide increase in FGF and WNT signaling in NotchPdgfra-KD mice compared to wildtype mice. (k) WNT signaling network in wildtype and NotchPdgfra-KD conditions showing a re-wiring of the WNT signaling niche after Notch inactivation in the Pdgfra+ cells. (l) Violin plots showing an upregulation of Wnt ligands (Wnt2) and receptors (Fzd5) in AF1 and AT2 cells respectively in NotchPdgfra-KD mice compared to wildtype. (m) Slingshot trajectory analysis depicting potential trajectory of AF1c cells, the common AF1 subcluster between wildtype and NotchPdgfra-KD mice, transiting into AF1b (dominated by wildtype) or AF1c (dominated by NotchPdgfra-KD) subclusters. (n) Dynamic gene expression from each trajectory shown in panel (m) of AF1 markers (Pdgfra, Wnt2) and transient AF1 markers on their way to becoming AF2 cells (Pdgfrb, Acta2). (o) Cartoon summary schematic generated with Biorender.
Figure 7:
Figure 7:. Phenocopying chronic human lung diseases using NOTCH, WNT, and FGF mesenchymal-epithelial signaling networks
(a) Notch signaling network between mesenchymal and epithelial cells from a scRNA-seq mutli-disease dataset of a variety of human lung diseases along with representative H&E tile scans of the distal lung isolated from each disease. (b) IHC and RNA in situ hybridization showing PDGFRB+ mesenchymal cells exist directly adjacent to KRT5+ dysplastic epithelium in COVID-19 and bleomycin-induced human lung injuries. (c) WNT ligand module score in AF1 cells from fibrotic (COVID-19 & bleomycin) human lungs and degenerative (AAT & COPD). (d) DotPlots showing relative expression level of FGF and WNT ligands and receptors within AF1 and AT2 cells from control, COVID-19, and COPD human lungs.

References

    1. Planer J. D., Morrisey E. E., After the Storm: Regeneration, Repair, and Reestablishment of Homeostasis Between the Alveolar Epithelium and Innate Immune System Following Viral Lung Injury. Annu Rev Pathol 18, 337–359 (2023). - PMC - PubMed
    1. Wei X., Narasimhan H., Zhu B., Sun J., Host Recovery from Respiratory Viral Infection. Annual Review of Immunology 41, 277–300 (2023). - PubMed
    1. Boyd D. F., Allen E. K., Randolph A. G., Guo X.-Z. J., Weng Y., Sanders C. J., Bajracharya R., Lee N. K., Guy C. S., Vogel P., Guan W., Li Y., Liu X., Novak T., Newhams M. M., Fabrizio T. P., Wohlgemuth N., Mourani P. M., PALISI Pediatric Intensive Care Influenza (PICFLU) Investigators, Wight T. N., Schultz-Cherry S., Cormier S. A., Shaw-Saliba K., Pekosz A., Rothman R. E., Chen K.-F., Yang Z., Webby R. J., Zhong N., Crawford J. C., Thomas P. G., Exuberant fibroblast activity compromises lung function via ADAMTS4. Nature 587, 466–471 (2020). - PMC - PubMed
    1. Basil M. C., Katzen J., Engler A. E., Guo M., Herriges M. J., Kathiriya J. J., Windmueller R., Ysasi A. B., Zacharias W. J., Chapman H. A., Kohon D. N., Rock J. R., Snoeck H. W., Vunjak-Novakovic G., Whitseh J. A., Morrisey E. E., The Cellular and Physiological Basis for Lung Repair and Regeneration: Past, Present, and Future. Cell stem cell 26, 482–502 (2020). - PMC - PubMed
    1. Barkauskas C. E., Cronce M. J., Rackley C. R., Bowie E. J., Keene D. R., Stripp B. R., Randell S. H., Noble P. W., Hogan B. L. M., Type 2 alveolar cells are stem cells in adult lung. J Clin Invest 123, 3025–3036 (2013). - PMC - PubMed

Publication types