[Preprint]. 2023 Sep 14:2023.09.12.556363.
doi: 10.1101/2023.09.12.556363.

B Cells Promote T Cell Immunosenescence and Mammalian Aging Parameters

Affiliations

B Cells Promote T Cell Immunosenescence and Mammalian Aging Parameters

Saad Khan et al. bioRxiv. .

Abstract

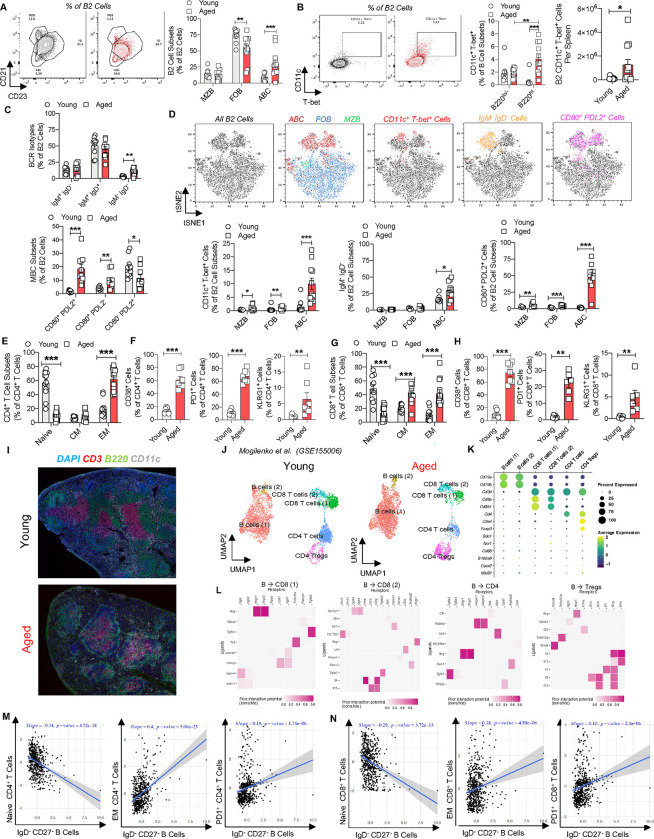
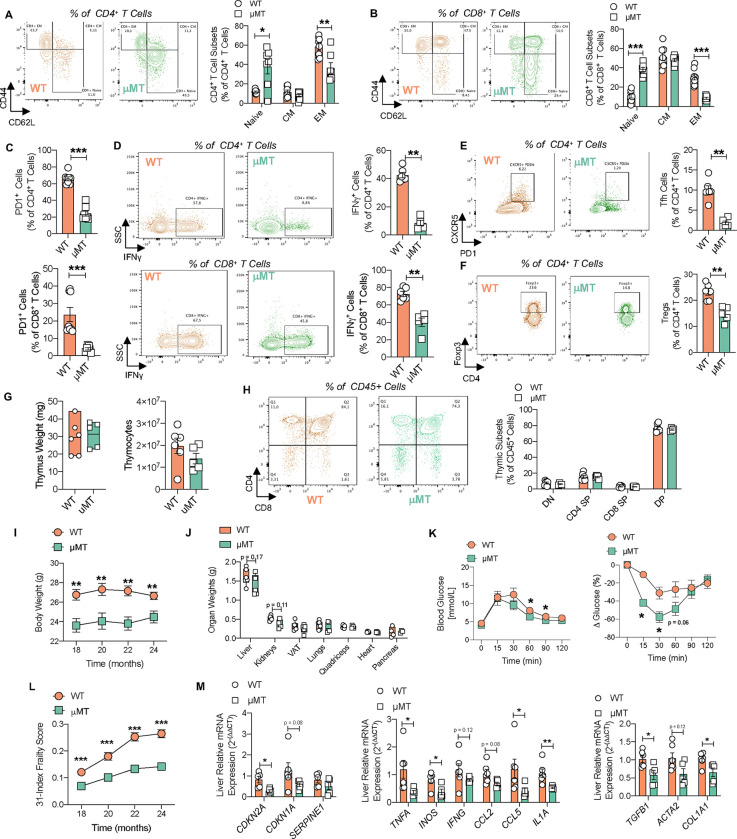
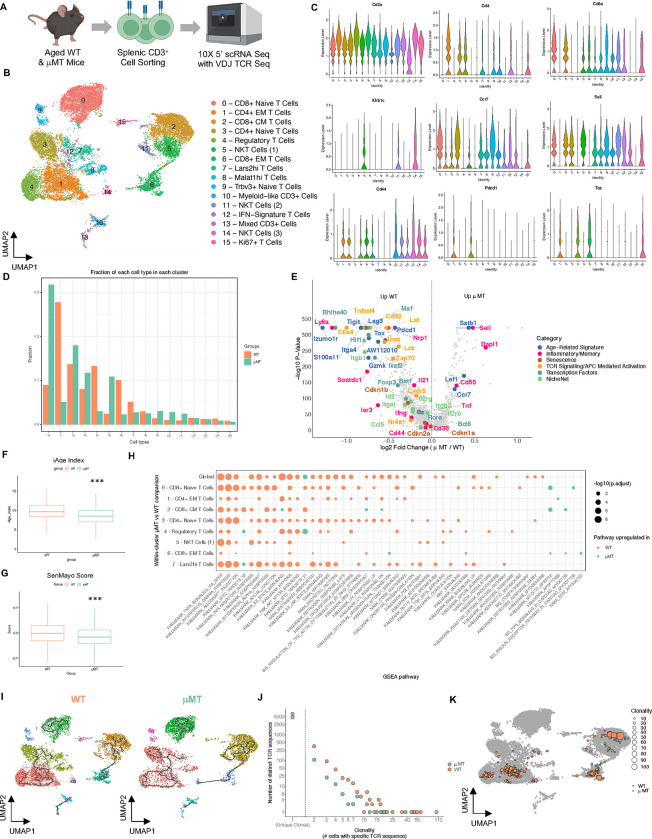
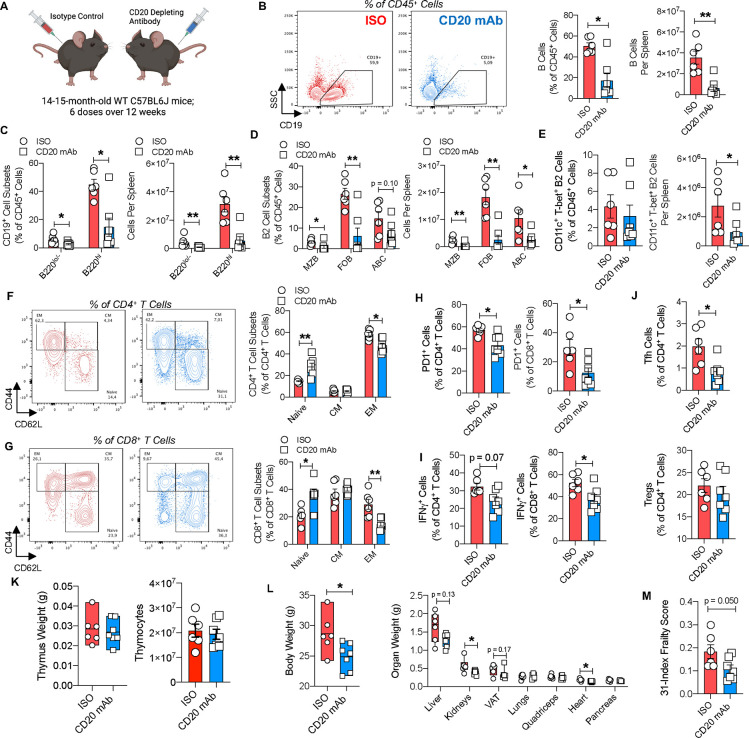
A dysregulated adaptive immune system is a key feature of aging, and is associated with age-related chronic diseases and mortality. Most notably, aging is linked to a loss in the diversity of the T cell repertoire and expansion of activated inflammatory age-related T cell subsets, though the main drivers of these processes are largely unknown. Here, we find that T cell aging is directly influenced by B cells. Using multiple models of B cell manipulation and single-cell omics, we find B cells to be a major cell type that is largely responsible for the age-related reduction of naive T cells, their associated differentiation towards pathogenic immunosenescent T cell subsets, and for the clonal restriction of their T cell receptor (TCR). Accordingly, we find that these pathogenic shifts can be therapeutically targeted via CD20 monoclonal antibody treatment. Mechanistically, we uncover a new role for insulin receptor signaling in influencing age-related B cell pathogenicity that in turn induces T cell dysfunction and a decline in healthspan parameters. These results establish B cells as a pivotal force contributing to age-associated adaptive immune dysfunction and healthspan outcomes, and suggest new modalities to manage aging and related multi-morbidity.


Conflict of interest statement

Competing Interests: The authors of this manuscript declare that they have no competing interests.

Figures

Fig. 1:
Fig. 1:. Age-related changes to B and T cells is associated with increased cellular crosstalk.
(A-H): Flow cytometric assessment of splenic B and T cells in young and aged WT mice (n= 9–12 per group). (A) Representative plots (left) and relative abundance (right) of splenic B2 cell subsets. (B) Representative plots of CD11c+ T-bet+ B2 cells (left), relative abundance of CD11c+ T-bet+ B cells (middle) and cell number of CD11c+ T-bet+ B2 cells. (C)Abundance of B2 B cell receptor isotypes (top) and memory B cell subsets (bottom). (D) Representative tSNE plots of B2 cell subsets (top) and abundance of CD11c+ T-bet+ cells (bottom left), IgM IgD cells (bottom middle) and CD80+ PDL2+ cells (bottom right). (E) Naive, effector memory, and central memory abundance in CD4+ T cells. (F) CD38+ cells (left), PD1+ cells (middle) and KLRG1+ cells (right) abundance in CD4+ T cells. (G) Naive, effector memory, and central memory abundance in CD8+ T cells. (H) CD38+ cells (left), PD1+ cells (middle) and KLRG1+ cells (right) abundance in CD8+ T cells (I) Representative immunofluorescent staining of CD3, B220 and CD11c in young (top) and aged (bottom) spleen. (J-L): NicheNet analysis on B cell sender populations driving age-related T cell changes (Mogilenko et al. GSE155006). (J) UMAP of young (left) and aged (right) re-analyzed splenic B and T cell cluster. (K) Gene expression profile of individual clusters from aggregated young and aged splenic samples. (L) NicheNet predictive analysis highlighting B cell ligands interacting with various T cell cluster receptors driving age-related changes to T cells. (M-N) Correlation of IgD CD27 B cells with T cell subsets in peripheral blood of 1000 immunomes cohort (n=609). (M) Correlation of naive (left), effector memory (middle) and PD1+ (right) CD4+ T cells against IgD CD27 B cells. (N) Correlation of naive (left), effector memory (middle) and PD1+ (right) CD8+ T cells against IgD CD27 B cells. Data are means ± SEM. * denotes p < 0.05, ** denotes p < 0.01, and *** denotes p < 0.001.
Fig. 2:
Fig. 2:. Aged μMT mice display decreased splenic T cell immunosenescence and improved age-related health parameters
(A-F) Flow cytometric assessment of T cells from spleens of aged μMT and WT mice (n=6–8 per group). (A) Representative plots (left) and relative abundance (right) of naive, effector memory and central memory in CD4+ T cells. (B) Representative plots (left) and relative abundance (right) of naive, effector memory and central memory cells in CD8+ T cells. (C) Relative abundance of PD1+ cells in CD4+ (top) and CD8+ (bottom) T cells. (D)Representative plots (left) and relative abundance (right) of IFNγ+ cells in CD4+ (top) and CD8+ (bottom) T cells post 5-hour ex vivo stimulation. (E) Representative plots (left) and relative abundance (right) of T follicular helper cells. (F) Representative plots (left) and relative abundance (right) of regulatory T cells. (G-H) Thymus and thymocyte assessment of aged μMT and WT mice (n=4–6 per group). (G) Thymus weight (left) and thymocyte yield (right). (H) Representative plots (left) and relative abundance (right) of thymic T cell subsets. (I-L) Healthspan parameters of aged μMT and WT mice (n=3–14 per group). (I) Body weight over time. (J) Organ weight. (K) Glucose tolerance test (left) and insulin tolerance test (right) results. (L) 31-index frailty scores. (M) RT-PCR gene expression of senescence (left), senescence associated secretory phenotype (middle) and fibrosis (right) markers in perfused livers. Data are means ± SEM. * denotes p < 0.05, ** denotes p < 0.01, and *** denotes p < 0.001.
Fig. 3:
Fig. 3:. B cells shape the aging T cell transcriptional landscape and TCR repertoire.
(A-K) 5’ single cell transcriptomics with VDJ T cell receptor analyses on splenic CD3+ cells from aged uMT and WT mice (2 pooled co-housed mice per group). (A) Schematic illustration of experiment workflow. (B) UMAP and annotation of splenic CD3+ clusters from aggregated aged μMT and WT mice. (C) Gene expression violin plots from aggregated aged μMT and WT mice. (D) Abundance of each cluster from μMT and WT mice. (E) Volcano plot of genes globally upregulated in CD3+ cells from aged μMT and WT mice. (F) iAge Index of bulk CD3+ cells. (G) SenMayo score of bulk CD3+ cells from aged μMT and WT mice. (H) GSEA pathway analysis of CD3+ cells from aged μMT and WT mice. (I) Trajectory analysis of CD3+ cells from aged μMT and WT mice. (J) TCR diversity and clonality analysis of bulk from aged μMT and WT mice. (K) TCR clonality overlaid on UMAP projection of CD3+ clusters from aged μMT and WT mice. *** denotes p < 0.001.
Fig. 4:
Fig. 4:. CD20 mAb therapy depletes age-related B cell subsets, halts T cell immunosenescence and improves healthspan outcomes.
(A-J): Flow cytometric assessment of B and T cells from spleens of aging CD20 mAb and isotype control treated mice (n=6–7 per group). (A) Schematic illustration of experiment design. (B) Representative plot (left), relative abundance (middle) and cell number (right) of total B cells. (C) Relative abundance (left) and cell number (right) of B cell subsets. (D) Relative abundance (left) and cell number (right) of B2 cell subsets. (E) Relative abundance (left) and cell number (right) of splenic CD11c+ T-bet+ B2 cells. (F) Representative plot (left) and relative abundance (right) of naive, central memory, and effector memory subsets in CD4+ T cells. (G) Representative plot (left) and relative abundance (right) of naive, central memory, and effector memory subsets in CD8+ T cells (H) Abundance of PD1+ cells in CD4+ (left) and CD8+ (right) T cells. (I) Abundance of IFNγ+ cells in CD4+ (left) and CD8+ (right) T cells. (J) Abundance of T follicular helper cells (top) and regulatory T cells (bottom). (K) Thymus weight (left) and thymocyte yield (right) from CD20 mAb and isotype treated aged WT mice (n=6–7 per group). (L) Body weight (left) and organ weight (right) of CD20 mAb and isotype treated aged WT mice (n=6–7 per group). (M) 31-index frailty score of CD20 mAb and isotype treated aged WT mice (n=6–7 per group). Data are means ± SEM. * denotes p < 0.05, and ** denotes p < 0.01.
Fig. 5
Fig. 5. Insulin boosts age-related B cell responses linked with an immunosenescent T cell compartment
(A) GeneRatio analysis of bulk splenic, hepatic, pulmonary, and peritoneal B cells highlighting insulin signaling related pathways upregulated in aged WT mice compared to young WT mice (Mogilenko et al. GSE155006). (B) Representative plot of pAKT-T308 (left), MFI of pAKT-T308 (middle) and MFI of pAKT-S473 (right) in young and aged splenic B2 cells (n=7–8 per group). (C) Representative plot of pAKT-T308 (left), MFI of pAKT-T308 (middle) and MFI of pAKT-S473 (right) aged splenic B2 cell subsets (n=8). (D) Expression of INSR mRNA in unstimulated and ABC-stimulated B cells (n=4 per group). (E)Representative plots (left) and abundance (right) of CD11c+ T-bet+ cells from unstimulated, ABC stimulated, and ABC + Insulin stimulated B cells (n=4 per group). (F) Culture supernatant cytokine concentration from unstimulated, ABC stimulated, and ABC + Insulin stimulated B cells (n = 4–7 per group). (G-M) Flow cytometric assessment of B and T cells from spleens of aged B-InsRWT and B-InsRFL mice (n=5–13 per group). (G) Relative abundance of B cell subsets. (H) Representative plot (left) and MFI (right) of CD23 expression in B2 cells. (I) Abundance (left) and cell numbers (right) of CD11c+ T-bet+ B2 cells. (J) Representative plot (left) and MFI (right) of MHCII expression in B2 cells. (K) Representative plot (left) and relative abundance (right) of naive, central memory, and effector memory subsets in CD4+ T cells. (L) Representative plot (left) and relative abundance (right) of naive, central memory, and effector memory subsets in CD8+ T cells. (M) Abundance of PD1+ cells in CD4+ (left) and CD8+ (right) T cells. (N) Thymus weight (left) and thymocyte yield (right) from aged B-InsRWT and B-InsRFL mice (n=5–6 per group). (O-Q) Healthspan parameters of aged B-InsRWT and B-InsRFL (n=5–14, per group). (O) Body weight over time. (P) Glucose tolerance test (left) and insulin tolerance test (right) results. (Q) 31-index frailty scores over time. Data are means ± SEM. * denotes p < 0.05, ** denotes p < 0.01, and *** denotes p < 0.001.

References

    1. Flatt T., A new definition of aging? Front Genet 3, 148 (2012). - PMC - PubMed
    1. Kennedy B. K. et al., Geroscience: linking aging to chronic disease. Cell 159, 709–713 (2014). - PMC - PubMed
    1. Goldberg E. L., Dixit V. D., Drivers of age-related inflammation and strategies for healthspan extension. Immunol Rev 265, 63–74 (2015). - PMC - PubMed
    1. Lopez-Otin C., Blasco M. A., Partridge L., Serrano M., Kroemer G., The hallmarks of aging. Cell 153, 1194–1217 (2013). - PMC - PubMed
    1. Franceschi C., Garagnani P., Parini P., Giuliani C., Santoro A., Inflammaging: a new immune-metabolic viewpoint for age-related diseases. Nat Rev Endocrinol 14, 576–590 (2018). - PubMed

Publication types